
Total national consumption of gasoline in the United States was about 140 billion gallons per year in 2009 and is expected to fall over time as a result of increasing fuel economy standards (Tyner and Viteri, 2010). As of 2010, if every drop of gasoline were blended as E10, the maximum ethanol that could be absorbed would be 14 billion gallons. In reality, blending 10-percent ethanol into gasoline is not feasible in all regions and seasons. Most experts consider about 9 percent to be the effective maximum, which amounts to about 12.6 billion gallons per year of ethanol blended (Tyner et al., 2008). U.S. ethanol production capacity already exceeds this level. Thus, the nation’s ability to consume ethanol as fuel has reached a limit called the blend wall.
This physical constraint is the biggest issue facing U.S. ethanol industry in 2010. If the blending limit of 10 percent is maintained, the ethanol industry cannot grow; indeed, it could not even operate its productive capacity of over 13 billion gallons in 2010. The blend wall partially explains why about 2 billion gallons of annual capacity was shut down during much of 2009, and about 1 billion gallons of capacity remained inoperative in 2010. It also explains why ethanol prices during much of the 2009 were driven mainly by corn prices, instead of gasoline prices as it was before 2008-2009.
In 2010, the relatively low U.S. price for ethanol has led to some ethanol exports. With the world sugar price at its highest level since 1995, Brazil allocated relatively more sugarcane to sugar and less to ethanol, so the Brazilian ethanol price in the summer of 2010 was higher than the U.S. price. However, in late summer, corn price started increasing significantly, and ethanol price increased in step. Although ethanol exports occurred, the exports were a tiny fraction of the total U.S. production.
The basic economics of the blend wall are depicted in Figure N-1. Moving from left to right down the demand curve, once the blend wall is reached, the price plummets from the market equilibrium (with subsidy) at P* (or Pm without subsidy) to the intersection of the supply curve and the blend wall PBW. Ethanol becomes priced on a breakeven basis with corn, which was the situation in the first three quarters of 2009. Markets picked up in the
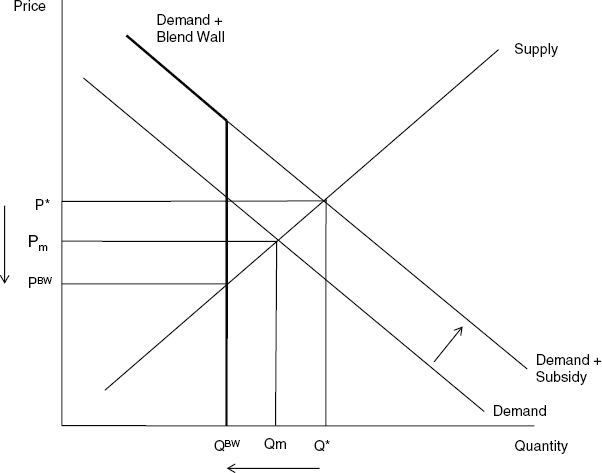
FIGURE N-1 Economics of the ethanol blend wall.
NOTE: P* = market price with subsidy; Pm = market price without subsidy; PBW = price at the blend wall; Q* = quantity with subsidy; Qm = quantity without subsidy; QBW = quantity at the blend wall.
fourth quarter as more ethanol can be blended in winter months than summer months due to summer evaporative emissions constraints. However, in spring 2010, ethanol pricing returned to breakeven with corn. Given the fact that gasoline demand is expected to decrease because of higher fuel-economy standards, the blend wall becomes a severe constraint to future ethanol growth and a barrier to achieving the legislative mandates of the Energy Independence and Security Act (110 P.L. 104).
Ethanol production and use are facing two opposing realities: the Renewable Fuel Standard (RFS2) that mandates increasing consumption of biofuels each year from 2005 to 2022, and a physical blend wall that makes it difficult for ethanol consumption to grow beyond present levels. An ethanol industry support and lobby group called Growth Energy petitioned EPA to increase the blending limit from 10 to 15 percent. In October 2010, EPA approved the 15-percent limit for cars built in 2007 or later. In the following January, EPA extended the waiver to model year 2001 to 2006 light-duty vehicles. But even an increase of the blending limit to 15 percent only buys some time (about 4 years) before the blend wall is reached again and only so long as ethanol remains the primary biofuel.
In the following analysis, the consequences of seven alternative RFS2 pathways were analyzed:
- The blend limit remains at 10 percent (E10), and all biofuel is ethanol.
- The blend limit is increased to 15 percent (E15), and all biofuel is ethanol.
- The blend limit is 10 percent (E10), and all cellulosic biofuel is thermochemically produced biogasoline or equivalent. The physical properties of thermochemical biofuels are identical with gasoline, and thus, it can be blended with gasoline at any percentage.
- The blend limit is 15 percent (E15), and all cellulosic biofuel is thermochemically produced biogasoline or equivalent.
- The blend limit is 10 percent (E10), and cellulosic technology is so expensive that EPA waives the cellulosic part of RFS.
- The blend limit is 15 percent (E15), and cellulosic technology is so expensive that EPA waives the cellulosic part of RFS.
- A regional strategy is used to emphasize use of E85 in the Midwest where most of the ethanol is produced.
For each of the scenarios, the total net present value (NPV) of installing the flex-fuel vehicles (FFVs) and pumps was calculated using a real social discount rate of 10 percent and an average inflation of 3 percent per year. The cost of installing E85 fuel dispensers depends on the type of tank installed (new underground tank or conversion of existing tank). Between 30 to 60 percent of the E85 installations involve new tanks, while the others convert a current tank (Moriarty et al., 2009). The typical gas station has 3.3 tanks, one for regular, midgrade, and premium. If a tank is converted, the station loses the revenue stream from one blend. However, some stations, especially at convenience stores, lack the space to add a new tank (Moriarty et al., 2009). Cost estimates for new tanks range from $50,000 to $200,000, with a mean at $74,418. The average cost of a tank retrofit is about $21,244. Thus, the weighted average cost of installing a tank is $45,000. In addition, it costs an additional $100 per vehicle to produce a FFV instead of a standard vehicle (Corts, 2010). Other infrastructure costs are not included so that the cost estimates provided here are clearly underestimates of total cost.
The first alternative of maintaining the blending limit at 10 percent and producing only ethanol as a biofuel is clearly out of question. It would require massive increases in E85, with accompanying huge increases in FFVs (Tyner and Viteri, 2010). Annual sales of FFVs would need to be at least 8.7 million cars per year compared with a cumulative total of 7.9 million on the road today. The total FFVs needed by 2022 would be 121.5 million. It would also require installation of 24,277 E85 fueling pumps per year compared with a cumulative total of 2,100 operating today. A cumulative total of 158,000 stations would need to add flex-fuel pumps. The total cost of E85 pump installation and FFVs around the whole United States have a NPV of $11.13 billion for this scenario. Furthermore, E85 would have to be priced no more than 78 percent of E10 blend gasoline because of the mileage difference. (See the discussion of the regional strategy below for more on E85 pricing.) The bottom line is that this scenario is not likely to be feasible, and EPA would be forced to waive RFS2 at some point. The time profile of E10 and E85 for this scenario is illustrated in Figure N-2.
The second alternative of a 15-percent blend limit with only ethanol as biofuel is less restrictive than the first but suffers similar problems over the longer term. The higher blend limit essentially extends the time before the blend wall is reached but does not solve the problem. E15 consumption would grow from 13.1 billion gallons per year in 2010 to 17.5 billion gallons per year in 2022, as the continued growth in E85 once again crowds out the use of the lower blend fuel (Figure N-2). By 2022, there needs to be about 90.4 million FFVs on the roads, served by 236,208 E85 gas dispensers. The total NPV value cost
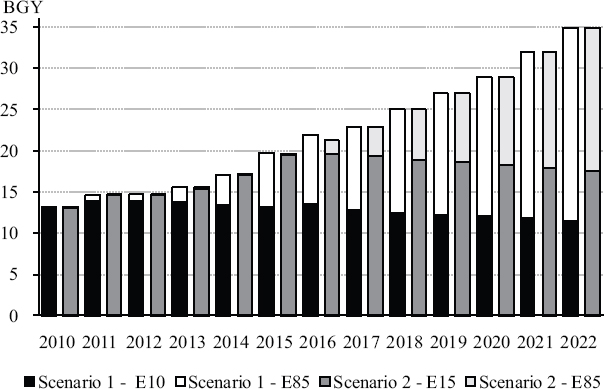
FIGURE N-2 Projected consumption of E10 and E85 under scenario 1 in which the ethanol can be used as E85 blend in FFVs or E10 in conventional vehicles, and under scenario 2 in which ethanol can be used as E85 blend in FFvs or E15 in conventional vehicles.
of installation for E85 pumps and FFVs is $8.0 billion for this scenario. Thus, compared to the E10 scenario, the adoption of an E15 blending limit would reduce the consumption of E85 by 6 billion gallons per year in 2022 and lessen the demand for FFVs and E85 pumps. This change would save a NPV of $3.1 billion. The time profile of scenario 2 also is illustrated in Figure N-2.
The third scenario combines E10 and E85 with the thermochemical refining of cellulosic biomass. Because the biofuel produced using thermochemical conversion can have similar physical properties as gasoline, it can be consumed and blended with gasoline at any percentage. Thermochemical conversion also produces green diesel, but this section focuses on the gasoline component, and ethanol is a gasoline substitute. Ethanol is still blended as an oxygenate in E10 ethanol, and relatively small volumes of E85 are produced (7.6 billion gallons per year in 2022 instead of 23.5 billion gallons per year in scenario 1) (Figure N-3). This scenario would require fewer FFVs, approximately 39 million being needed on the road by 2022, and about 76,100 E85 dispensers. The NPV of E85 pump installation and more FFVs falls to $3.7 billion. Compared to Scenario 1, the adoption of thermochemical biofuels avoids $7.4 billion in E85 related investment. The time path of the different fuels for scenario 3 is illustrated in Figure N-3.
Scenario 4 combines the use of thermochemically produced biogasoline with increasing the ethanol blend rate to E15. The growth of E85 is limited, with only 90 million gallons of E85 in the market by 2022 (Figure N-3). As such, there is also limited demand for increasing the market penetration of FFVs. It is assumed that no additional E85 vehicles are produced and the FFV fleet contracts to 8.5 million by 2022 as vehicles are retired. The number of E85
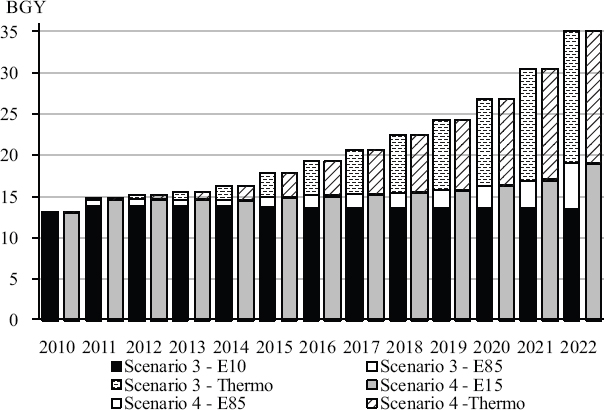
FIGURE N-3 Projected consumption of E10 and E85 under scenario 3 in which the ethanol can only be used as E85 blend in FFVs and as E10 blended with thermochemically produced biogasoline and under scenario 4 in which the ethanol can be used as E85 blend in FFVs and as E15 blended with thermochemically produced biogasoline.
dispensers does not change from 2010 because of low E85 usage rates. This leads to a NPV of $554 million for replacement FFVs.
The fifth scenario assumes E10 and E85 as in scenario 1 but also assumes that cellulosic technology does not become feasible. As a result, the 16 billion gallon cellulosic biofuel component of RFS2 is waived. By 2011, all gasoline will be blended with a 10-percent ethanol mix, and by 2012, E85 consumption will start growing in small amounts until it reaches 7.6 billion gallons in 2022. The effect of the RFS2 waiver on the number of FFVs and E85 stations is the same as the use of thermochemical biofuels in scenario 3. Again, 39.2 million FFVs are needed, as well as 76,100 E85 dispensers. The NPV for pump installation and new FFVs is the same as scenario 3 ($3.7 billion). In addition, the investment cost of thermochemical plants is avoided.
The sixth scenario is analogous to scenario 5 except that the blend level is E15 instead of E10. Again no cellulosic biofuel is required because it is waived. The results are the same as scenario 4 except that no cellulosic biofuels are produced. The only cost is FFV replacement cost of $554 billion.
The seventh scenario is to make E85 more attractive and economically viable by focusing the E85 marketing and infrastructure investments in the Midwest where most of the ethanol is produced. If E85 could reach substantial penetration in the Midwest, it is argued that the blend wall might not be reached. Ethanol will not have to be transported far because it is distributed and used close to where it is produced. This strategy could lower transport and
distribution cost of ethanol by as much as $0.15-$0.20 per gallon, and enable the E85 blend to come closer to competitive pricing. For 16 billion gallons of cellulosic ethanol, that savings could be as much as $3.2 billion. Competitive pricing is key for this or any strategy to promote E85. E85 (with 74-percent ethanol) contains about 78 percent of the energy of E10, the normal competitive fuel. So if the retail price of E10 is $2.80, the retail price of E85 could be no more than $2.18 to be competitive with E10. When ethanol is up against the blend wall as at present, its price can be substantially below gasoline as it is priced essentially breakeven with corn. In July 2010, wholesale prices were about $2.10 for gasoline and $1.70 for ethanol. It is possible, but unlikely, that E85 could become competitive under these conditions. In August 2010, the price of corn increased substantially due to world market conditions; consequently, ethanol price increased as well such that, by the end of the month, ethanol and gasoline were close to each other in price. In November 2010, gasoline was about $2.15 and ethanol about $2.50. Under these conditions, it would be extremely difficult to market E85.
If E85 penetrates the market substantially, then the blend wall is effectively surpassed. In that case, RFS2 becomes binding. With a binding RFS2, the mandate is demanding more ethanol than the market would otherwise produce (Figure N-4). The price, PRFS, is higher
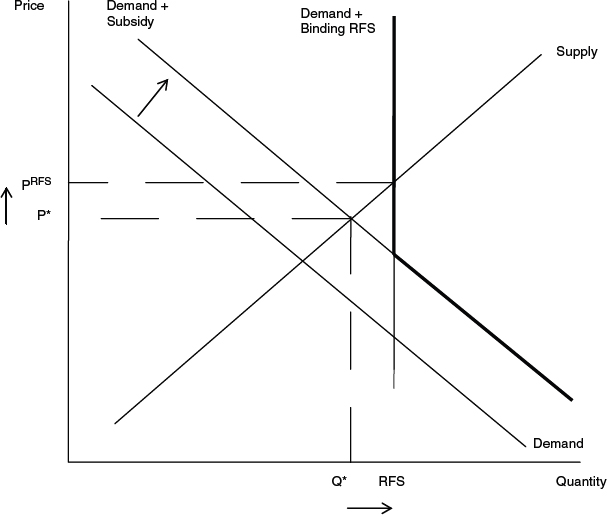
FIGURE N-4 Ethanol pricing with a binding RFS2.
NOTE: PRFS = price at RFS; P* = market price with subsidy; Q* = quantity with subsidy.
than the market plus subsidy price. In other words, there is an economic rent attached to the binding mandate. It is unlikely in this situation that E85 could be competitive with E10 in the market place even with lower transportation and distribution costs in the Midwest. Over time companies could use cross-subsidization to lower the price of E85 and increase that of E10, but that strategy requires that the flex-vehicle fleet and E85 dispensers be in place, which takes years to occur.
Scaling up FFV production and service station dispensing facilities to saturate the Midwest market will be a large task. In fact, there are not enough cars in the Midwest to satisfy the E85 demand even if all cars were FFVs. Also, some have argued that because E85 customers would spend much more time refueling than E10 customers (more frequent trips to the pump), customers might demand an even larger price discount for E85.
The analyses demonstrate that ethanol is not likely to be the only biofuel in the U.S. market. The blend wall becomes a near impenetrable barrier to meeting RFS2. If the thermochemical production processes become viable, then RFS2 can be met with a combination of ethanol from corn and sugarcane, and hydrocarbon fuels from cellulose.
REFERENCES
Corts, K.S. 2010. Building out alternative fuel retail infrastructure: Government fleet spillovers in E85. Journal of Environmental Economics and Management 59:219-234.
Moriarty, K., C. Johnson, T. Sears, and P. Bergeron. 2009. E85 Dispenser Study. Golden, CO: National Renewable Energy Laboratory.
Tyner, W.E., and D. Viteri. 2010. Implications of blending limits on the U.S. ethanol and biofuels markets. Biofuels 1(2):251-253.
Tyner, W.E., F. Dooley, C. Hurt, and J. Quear. 2008. Ethanol pricing issues for 2008. Industrial Fuels and Power February: pp.50-57.


