
Student Achievement Under PERAA: First Impressions
To ask how well the schools are doing under the Public Education Reform Amendment Act (PERAA) is to ask countless specific—and often complicated—questions, which is why a thorough, 5-year evaluation is called for in the law. That evaluation may be even more important than originally envisioned because—even in the short time that this committee has been developing the evaluation plan—there has been complete turnover in the primary leadership positions for education in the District. There is a new mayor, deputy mayor, chancellor, and interim state superintendent of schools. Yet, 3 years after PERAA was enacted and after many significant changes have been implemented, it is not unreasonable to consider what has happened, what we call first impressions.
In this and the next chapter, we present our first impressions on several goals of the legislation: this chapter considers student achievement data. Chapter 6 looks at the other aspects of the system that also must be measured: the quality of district staff, the quality of classroom teaching and learning, service to vulnerable children and youth, family and community engagement, and operations.
For the purposes of this first phase of the evaluation effort, the committee was able to collect only preliminary information about student achievement and the five primary areas of district responsibility we discuss in Chapter 6. We stress that these first impressions are useful only as a basis for further inquiry and not as reliable evidence about the effectiveness of the changes under PERAA or how best to fine-tune programs and strategies in the future. Those tasks require an ongoing program of evaluation and research, which we offer in Chapter 7.
STUDENT ACHIEVEMENT AND TEST DATA
The most readily available first impressions of student achievement are provided by test scores. There is a long history of relying on student test data as a measure of the effectiveness of public education, and it is tempting to simply rely on those readily available data for judgments about student achievement and about causes and effects. However, student test scores alone provide useful but limited information about the causes of improvements or variability in student performance.
The results of achievement tests provide only estimates about students’ skills and knowledge in selected areas—usually, what they know and can do in mathematics and reading and sometimes other subjects. Aggregate year-to-year comparisons of test scores in the District’s schools are confounded by changes in student populations that result from student moves in and out of the city and between DC Public Schools (DCPS) and charter schools, dropout and reentry, and also from variations in testing practices that may exclude or include particular groups of students.1 For these and other reasons, therefore, it is important to remember that the consensus of measurement and testing experts has long been to use test scores cautiously.
For this discussion, it is perhaps most important to underscore that most tests are not designed to support inferences about related questions, such as how well students were taught, what effects their teachers had on their learning, why students in some schools or classrooms succeed while those in similar schools and classrooms do not, whether conditions in the schools have improved as a result of a policy change, or what policy makers should do to solidify gains or reverse declines. Answering those sorts of questions requires other kinds of evidence besides test scores. Looking at test scores should be only a first step—not an end point—in considering questions about student achievement, or even more broadly, about student learning.
Nevertheless, changes in student test scores since 2007 provide one set of impressions regarding progress in DC schools. We offer here an overview of publicly available data from both the District of Columbia Comprehensive Assessment System (DC CAS) and the U.S. Department of Education’s National Assessment of Educational Progress (NAEP). We first discuss these data sources, then look at the trend data, and end the chapter with a discussion of how to interpret the data. But we note again that a systematic and comprehensive analysis of achievement data for DC was beyond the scope of this report; the readily available information provides only a useful first
_______________
1Test scores also come with measurement issues that have to be considered if they are to provide an accurate picture of even those areas they do measure (Koretz, 2008; National Research Council, 1999; Office of Technology Assessment, 1992).
look and hints about issues related to student achievement that will need to be addressed in the long-term evaluation.
The District’s assessment system, the DC CAS, assesses students in grades 3 through 8 in reading and mathematics and in selected grades in science and composition.2 The assessment system, which has been in place since 2006, is designed to measure individual students’ progress toward meeting the District of Columbia’s standards3 and is used to meet federal requirements under the Elementary and Secondary Education Act, as amended by the No Child Left Behind (NCLB) Act (District of Columbia Public Schools, 2010a).4 DC CAS scores are used to determine if a given school is making sufficient progress under NCLB, and the media and the public look to them for an indication of how well district schools are doing.
DC CAS results are reported using four performance levels: advanced, proficient, basic, and below basic. Box 5-1 provides an example of the performance descriptions used in DC CAS.
The NAEP, known popularly as the Nation’s Report Card, is an assessment administered by the U.S. Department of Education and overseen by the autonomous National Assessment Governing Board that provides independent data about what students know and can do in mathematics, reading, and other subjects. NAEP is valuable in part because it is not a high-stakes test—scores for individual students or schools are not reported, and there are no consequences to students, teachers, or schools associated with NAEP scores. Results are reported for states, selected urban districts, and the nation, and all students are measured against common performance expectations; consequently, the results can be used to make comparisons among jurisdictions.5 Changes to the assessment are infrequent and come with careful studies of comparability, so NAEP is also used to track student
_______________
2Information about DC-CAS can be found at: http://www.dc.gov/DCPS/In+the+Classroom/How+Students+Are+Assessed/Assessments/DC+Comprehensive+Assessment+System-Alternate +Assessment+Portfolio+(DC+CAS-Alt) [accessed October 2010].
3Information about the academic standards can be found at: http://osse.dc.gov/seo/cwp/view,A,1274,Q,561249,seoNav,%7C31193%7C.asp. According to the 2011 DC CAS guide (Office of the State Superintendent of Education, 2010b), the assessments in reading and mathematics are aligned to both the District of Columbia standards and to the Common Core Standards, a set of standards that the majority of states have recently adopted to ensure greater consistency in public education from state to state (http://www.corestandards.org/ [accessed December 2010]).
4States must meet the requirements of the No Child Left Behind Act in order to receive federal financial assistance to support the education of poor children.
5The comparisons are subject to some caveats related to such issues as inclusion rates for students with disabilities and English language learners.
BOX 5-1
DC CAS Performance Descriptions for 3rd Grade Reading
The DC CAS is a standards-based assessment. Based on performance, each student is classified as performing at one of four performance levels: below basic, basic, proficient, and advanced. The descriptions below are examples of performance descriptions for each level.
Below Basic
Students are able to use vocabulary skills, such as identifying literal or common meanings of words and phrases, sometimes using context clues. Students are able to read some 3rd grade informational and literary texts and can identify a main idea, make some meaning of text features and graphics, form questions, locate text details, and identify simple relationships (e.g., cause/effect) in texts.
Basic
Students are able to use vocabulary skills, such as identifying words with prefixes and suffixes, and distinguishing between literal and nonliteral meanings of some common words and phrases. Students are able to read some 3rd grade informational and literary texts and can identify main points and some supporting facts, locate stated facts and specific information in graphics, form questions, identify lessons in a text, make simple connections within and between texts, describe and compare characters, and make simple interpretations.
Proficient
Students are able to use vocabulary skills, such as identifying affixes and root words and using context clues to interpret nonliteral words and meanings of unknown words. Students are able to read 3rd grade informational and literary texts and can distinguish between stated and implied facts and cause/effect relationships, determine and synthesize steps in a process, connect procedures to real-life situations, explain key ideas in stories, explain relationships among characters, identify subtle personality traits of characters, and connect story details to prior knowledge.
Advanced
Students are able to use vocabulary skills, such as identifying the figurative meanings or nonliteral meanings of some words and phrases in a moderately complex text. Students are able to read 3rd grade informational and literary texts and summarize the information or story with supporting details, apply text information to graphics, identify and explain relationships of facts and cause/effect relationships, use text features to make predictions, distinguish between fact and fiction, identify a speaker in a poem or narrator in a story, explain key ideas with supporting details, use context to interpret simple figurative language, and determine simple patterns in poetry.
SOURCE: Office of the State Superintendent of Education (2010a, p. 1).
performance over time. For example, the NAEP mathematics assessment scores go back to 1992, and those for reading to 1990.
DC has participated in NAEP as a “state” since the early 1990s, and the scores for grades 4 and 8 reflect the performance of all District public schools, including all public charter schools. When NAEP began the Trial Urban District Assessment (TUDA) in 2002, the District was included in this assessment as well, one of only five such districts. In 2009, 18 districts participated. Until 2009, the scores for the District were the same for both the state and district assessments. Beginning in 2009 most charter schools were excluded from the District’s TUDA results, but they remained in the state score calculation. The charter schools that are excluded from DCPS’s adequate yearly progress (AYP) report under NCLB were also excluded from the NAEP TUDA. This look at the data presents both state and TUDA scores together. The state scores include all DC schools and therefore serve as the basis for comparison. All NAEP data in this section refer to the state DC scores unless otherwise noted. The TUDA scores are presented in graphics for completeness, but are not discussed and should be evaluated cautiously, particularly in the context of comparisons between 2007 and 2009 because of the change in charter school exclusion in 2009.
These two assessments provide different ways of measuring student progress. DC CAS provides evidence of the progress of individual students and groups (such as 3rd graders in a school or in the district) toward mastering specific objectives in the DC standards. NAEP provides a picture of what students at each grade in the District as a whole know and can do in terms of nationwide definitions of achievement in each subject.
The percentage of tested students who performed at or above the proficient level (proficiency rate) in all grades in the District on the DC CAS increased from 2006 to 2010. Figure 5-1 shows the upward trend prior to PERAA’s passage in 2007. After 2007, the trend in both reading and mathematics increased more steeply for 2 years, then flattened out, and then declined slightly in the 2009-2010 school year.
Figure 5-2 shows the percentages of students (by grade and subject) performing at each of the four proficiency levels on DC CAS and state NAEP for 2007 and 2009. These data show that, in general, the percentages of students in both the below basic and basic categories decreased for both assessments, while the percentages of students performing at both the proficient and advanced levels increased. That is, the distribution of students shifted to higher performance levels from 2007 to 2009. Thus, the NAEP scores appear to confirm the improvement shown on the DC CAS scores. However, the percentages of students performing at the proficient
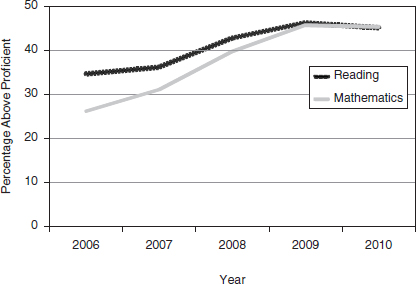
FIGURE 5-1 Percentage of District students at or above the proficient level on the DC CAS in reading and mathematics, 2006-2010.
SOURCE: Adapted from http://www.nclb.osse.dc.gov/index.asp [accessed December 2010].
level or above on NAEP is significantly smaller than the percentage who perform at those levels on DC CAS—a finding that suggests that DC CAS is a less challenging assessment than NAEP (we discuss this issue further below).
The average (scaled) score on NAEP shows a similar positive trend. The 2009 NAEP scores for DC as a state (see Figure 5-3) in grade 4 for both reading and mathematics were statistically significantly higher than they had been in all previous years (2003, 2005, and 2007). This was also true for grade 8 mathematics. In grade 8 reading, the DC state scores in 2009 were also significantly higher than those for 2003 and 2005, but not than those for 2007. That is, grade 8 reading was the only assessment in which the District did not show a significant gain from 2007 to 2009.
In comparison with states, the District’s scores were notable. In grade 4 reading, only two other states improved since 2007; in mathematics, only four other states showed significant improvement at both grades 4 and 8. Only three states, Kentucky, Rhode Island, and Vermont, showed improvement in three of the four assessments, and no state improved in all four. However, in comparison with other urban districts, the District’s scores were similar: many others also showed consistently significant gains.
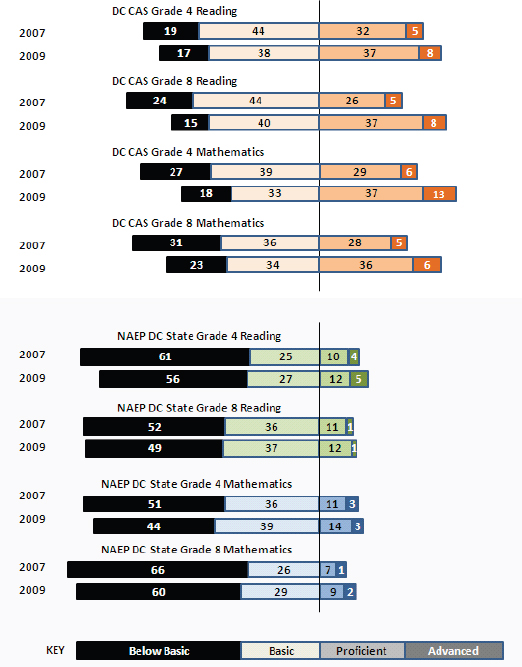
FIGURE 5-2 Proficiency levels of District students from DC CAS and NAEP for 2007 and 2009 in reading and mathematics.
SOURCES: National Center for Education Statistics, NAEP Data Explorer, see http://nces.ed.gov/nationsreportcard/naepdata/ [accessed September 2010]; DC CAS, see http://www.nclb.osse.dc.gov/index.asp [accessed March 2011].
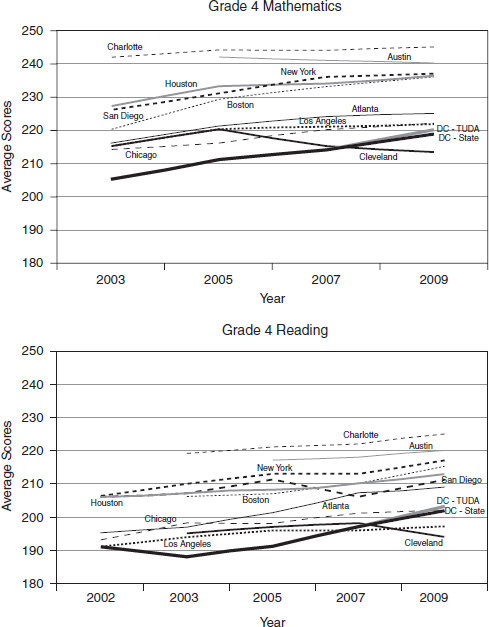
FIGURE 5-3 NAEP TUDA average scores for 10 urban districts and DC, as well as DC state NAEP, for mathematics and reading, grades 4 and 8, 2002-2009.
NOTES: State and TUDA scores are presented together for completeness. State scores include all DC schools and thus are the focus of this analysis. TUDA scores should be evaluated cautiously particularly when comparing 2007 to 2009 because most charter schools were excluded in 2009 (but included in 2007—see text).
SOURCE: National Center for Education Statistics, NAEP Data Explorer, see http://nces.ed.gov/nationsreportcard/naepdata/ [accessed September 2010].
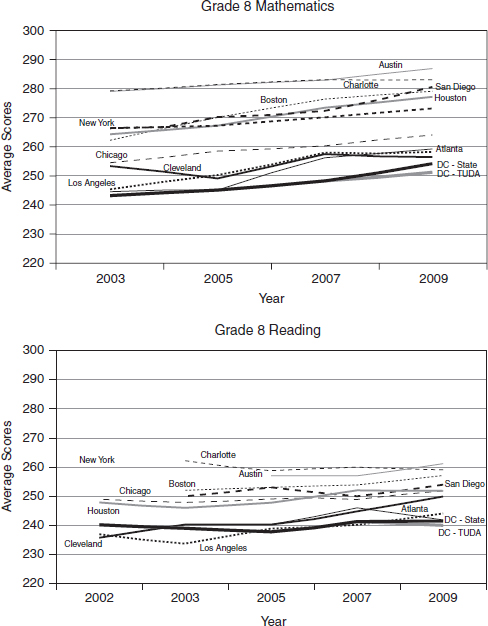
Figure 5-3 also shows trends for other school districts assessed by NAEP in mathematics and reading.6 Two points are worth noting: the District’s average scores are low compared with those of most of the other 10 school districts in both the 2007 and 2009 TUDA (including Boston, Chicago, and New York), but DC and its peer districts are improving at similar rates. Most districts showed gains from 2007 to 2009: see Figure 5-4.7,8
It is important to note, however, that scores that are averaged across large numbers of students can obscure which students are improving and by how much. It may be that only a small group of students is making gains while others are not improving or may even be doing worse than previously. For example, the highest achievers may be showing gains while the lowest achievers are not, or vice versa. The committee was limited by time and resources in the number of disaggregations we could carry out for this report, but a few examples demonstrate the importance of looking beyond average scores.
It appears that students at every level in the District are gaining ground. As Figure 5-5 shows, for example, in DC state NAEP grade 4 reading, students in the lowest, middle, and highest groups all made gains, with the lowest scoring students gaining at a faster rate than the others. We note, too, that black, Hispanic and white 4th graders on average scored higher on the DC CAS mathematics in 2010 than in 2007, while English language learners and students with disabilities also showed some improvements relative to their peers: see Figure 5-6.
The NAEP data show different results. For grade 4 reading, there was no significant change in the performance of white 4th grade students in the District from 2005 to 2009, while scores for both black and Hispanic 4th graders showed a significant gain for 2009: see Figure 5-7. For grade 8 reading, the NAEP data show large achievement gaps when scores are broken out by the educational attainment of students’ mothers: see Figure 5-8. These data show improvements for those students whose mothers did not finish high school.
_______________
6Although 18 urban districts participated in the 2009 mathematics and reading assessments, only 10 districts other than DC also participated in assessments in previous years, so it is only possible to examine changes over time for those 10.
7These data findings come from the test of differences in gains performed through NAEP Data Explorer, see http://nces.ed.gov/nationsreportcard/naepdata/ [accessed September 2010].
8Although the DC state scores are the focus of this analysis because they reflect all public schools, the TUDA scores are also presented in Figure 5-3. It should be noted that if the non-DCPS charter schools had been excluded in 2007 as they were in 2009 (i.e., if NAEP had used comparable samples in both years), the District would have also shown a statistically significant increase from 244 in 2007 to 251 in 2009 in grade 8 mathematics, rather than the non-significant change from 248 to 251: see “comparability of samples” at http://nationsreportcard.gov/math_2009/about_math.asp [accessed December 2010].
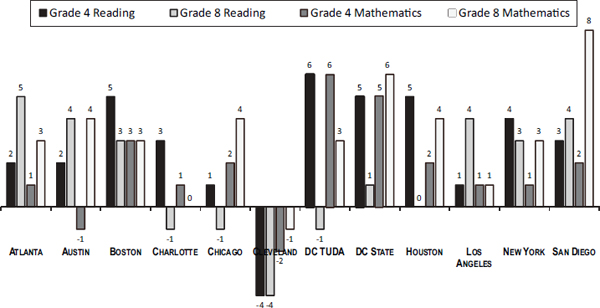
FIGURE 5-4 Changes in NAEP scores for selected urban districts, 2007-2009. Numbers indicate the amount of the increase or decrease in the average scaled score.
NOTES: State and TUDA scores are presented together for completeness. State scores include all DC schools and thus are the focus of this analysis. TUDA scores should be evaluated cautiously particularly when comparing 2007 to 2009 because most charter schools were excluded in 2009 (but included in 2007—see text).
SOURCE: National Center for Education Statistics, NAEP Data Explorer, see http://nces.ed.gov/nationsreportcard/naepdata/ [accessed September 2010].
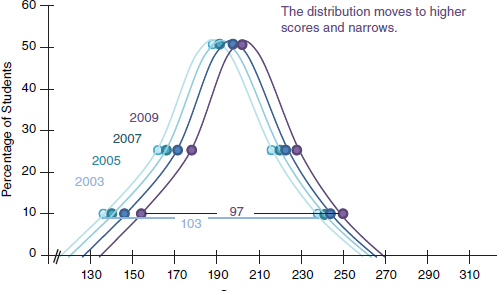
FIGURE 5-5 Changes from 2003 to 2009 in grade 4 reading score distributions on DC state NAEP.
SOURCE: National Center for Education Statistics, NAEP Data Explorer, see http://nces.ed.gov/nationsreportcard/naepdata/ [accessed September 2010].
NAEP also collects background data on students, teachers, and schools that cover general and content-specific questions (i.e., related to specific tested subjects) to provide context for the testing data. In general, these data also show improvements for DC students. For example, data collected with the grade 8 reading assessment show that the number of students reporting that they were absent more than 10 days in the month prior to testing was significantly smaller in 2009 than in 2007.9 This finding is important because there is evidence that absenteeism by both students and teachers has a negative effect on student achievement (Allensworth and Easton, 2007; Miller et al., 2007).
Another notable finding from the background data is that the percentage of schools reporting the smallest percentage of teachers absent (0-2 percent) on an average day increased from 68 percent in 2007 to 85 percent in 2009, a significant decline: see Figure 5-9. These data can be crossed with the scaled scores: in 2009 the average score for students in the schools with low absenteeism (0-2 percent) was 246, while the average score in the schools with high absenteeism (6-10 percent) was
_______________
9NAEP Data Explorer analysis, see http://nces.ed.gov/nationsreportcard/naepdata/ [accessed September 2010].
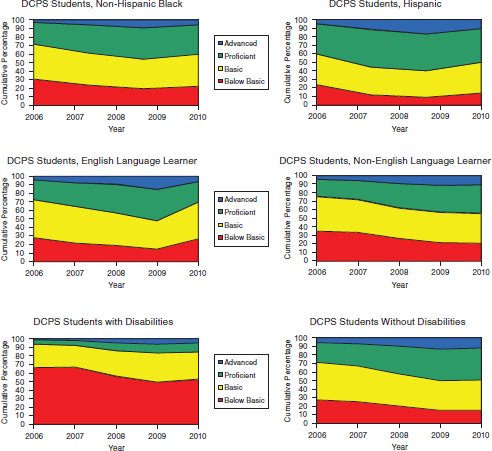
FIGURE 5-6 DC CAS proficiency levels for grade 4 mathematics by ethnicity, English language learner, and disability status, 2006-2010.
SOURCE: Compiled from http://www.nclb.osse.dc.gov/index.asp [accessed December 2010].
significantly lower, at 234.10 It is important to note, however, that the fact that teacher absenteeism is correlated with achievement does not mean that the absenteeism causes the low achievement. There are many other factors, such as school safety, that affect both teacher absenteeism and student achievement. This is just one example of the many limitations of these data and the related qualifications that must be considered when interpreting them.
_______________
10There were insufficient data for the other categories of absentee rates to produce comparable estimates.
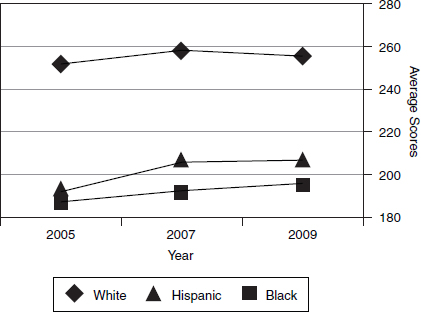
FIGURE 5-7 DC state NAEP grade 4 reading average scores by race/ethnicity, 2005-2009.
SOURCE: National Center for Education Statistics, NAEP Data Explorer, see http://nces.ed.gov/nationsreportcard/naepdata/ [accessed September 2010].
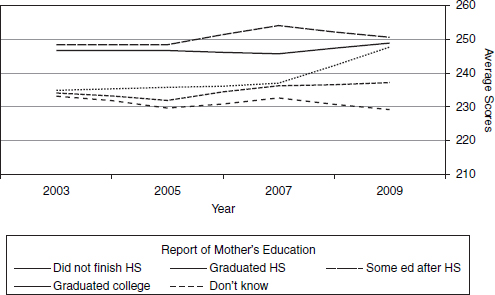
FIGURE 5-8 DC state NAEP grade 8 reading average scores by self-reported mother’s education, 2003-2009.
SOURCE: National Center for Education Statistics, NAEP Data Explorer, see http://nces.ed.gov/nationsreportcard/naepdata/ [accessed September 2010].
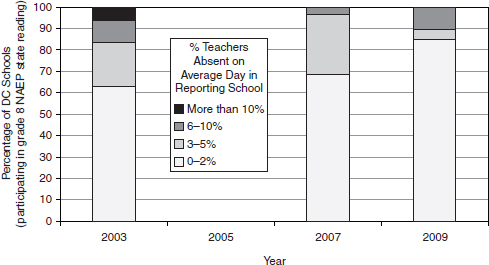
FIGURE 5-9 DC school reports of rates of teacher absenteeism, NAEP grade 8 reading, 2003-2009.
NOTE: Data are from background information on the NAEP state grade 8 reading test.
SOURCE: National Center for Education Statistics, NAEP Data Explorer, see http://nces.ed.gov/nationsreportcard/naepdata/ [accessed September 2010].
ISSUES FOR INTERPRETING TEST SCORES
Several issues must be taken into account before making inferences from results of achievement tests. There is a large technical literature on these issues; we review here a few key points of particular relevance to this report on DCPS.
Evidence Needed for Conclusions of Causation
The preliminary analysis we have provided suggests that the District’s implementation of PERAA might have, overall, had a positive effect on student achievement (with some leveling off in the last year). However, these test score data are only correlated with the changes brought about by PERAA and cannot on their own support the idea that PERAA caused the scores to improve. For example, the DC CAS scores that rose during the period in question might have risen without PERAA or they might have risen more rapidly without PERAA. Alternatively, some other change that occurred at the same time might have caused the increase.
The DC CAS was introduced in 2006, and there is some evidence that when a new test is introduced scores first rise significantly and then level off
(see, e.g., Linn, 2000). One hypothesis as to the reason for this pattern is that as teachers and students gradually become accustomed to the new test format and new expectations, student performance improves, but that once the test is familiar, performance stays flat (Koretz et al., 1991). Additional evidence would be needed to show whether this phenomenon might explain the observed changes in DC. In short, the DC CAS scores did rise, but there is insufficient evidence to establish the reason for the improvement.
In the case of the District, the fact that NAEP shows increases similar to those seen on the DC CAS suggests that the new-test phenomenon may not be the primary explanation; however, other changes that occurred in the same period could be responsible. Demographic shifts—changes in the composition of the student population that occur when students leave or enter the system (which will also change the groups of students being compared from year to year) are another potential source of change in test scores. Since the tests compared cohorts of students, scores will be affected if the populations are not similar. For example, if more higher-scoring 4th graders move into (or opt not to leave) the district’s public schools from one year to the next, average scores would likely rise—but that rise would not reflect improved learning. Such changes could occur because of in- or out-migration from the city or transfers between public and charter schools. If there are only small differences in the composition of students being tested across years, the effect would be slight. However, if, substantially more or fewer students in one year came from families of low socioeconomic status than in the next year, test results might show substantial changes that have nothing to do with the quality of instruction in schools or improved student learning. This is a serious issue in DC, which has a highly mobile student population, where many students move into and out of the charter school system, and which has a history in which the most disadvantaged residents have sometimes been forced by changing political and economic forces to move within the city or into neighboring jurisdictions.
This issue is not just theoretical. The composition of students in tested grades in the District of Columbia’s public schools, has changed markedly since 2007 (see Table 5-1).11 The number of students in all tested grades in DCPS has dropped by almost 21 percent, while the number of tested students in the charters has increased.12 However this decrease within the DCPS has not been consistent across demographic groups; in contrast the subgroup composition of students attending public charter schools in the district has remained relatively stable over this same time period—see Table 5-1.
_______________
11Table 5-1 was revised after the prepublication report was released; data are now presented separately for DCPS and charter schools (previously the combined data were presented).
12Discussion in this paragraph relies on data about students enrolled in the tested grades of 3-8 and 10 only and not to all students. See Table 5-1.
For example, the enrollment of students who were not economically disadvantaged fell considerably in DCPS between 2007 and 2010 while the enrollment of economically disadvantaged students also declined but not at the same rate. This means that economically disadvantaged students now make up a larger proportion of the total population of DCPS students—an increase of 8.2 percentage points; economically disadvantaged students were 62.2 percent of the DCPS tested population in 2007 and 70.4 percent in 2010. A similar pattern can be found for black students whose overall numbers fell in DCPS while those of whites and Hispanics increased slightly resulting in a shift in the overall demographic composition of the DCPS student body. The effects of families leaving the district or returning to the district are not generally factored in to summary proficiency statistics, yet these patterns could significantly bias the summary statistics (including cohort averages) either up or down. As we discussed in Chapter 3, the District has witnessed changes in movement between DCPS and charter schools and in the composition of particular neighborhoods (as well as tensions regarding school closures and school improvements) that are likely to affect local school student populations; consequently, this issue should be carefully considered when interpreting changes in student achievement data.
Dropout rates raise similar concerns. As students drop out of schools, their test scores are no longer included in their schools’ data. Thus, those schools’ average test scores may improve if significant numbers of low-achieving students leave, even if the remaining students’ scores have not gone up and the school has not actually improved. This is an important consideration in assessing DC’s test scores because a recent report from the National Center for Education Statistics found that the rate of students who enter 9th grade and later graduate from a DC school has steadily declined, from 68 percent in the 2001-2002 school year to only 56 percent in the 2007-2008 school year. The validity of data on dropout rates is, in itself, an issue of serious concern in interpreting achievement data (see, e.g., National Research Council and National Academy of Education, 2011).
For all of these reasons, reports of test score gains are complete and valid only when they include analysis of the demography of the student population—including examinations of the distribution of students by geographic area (e.g., ward) and movement into and out of charter schools, private schools, and suburban school districts. One means of factoring out the effects of population changes is to track individual students in the system over time to determine whether their performance is on an upward trajectory, that is, to follow actual cohorts of students across time. Doing so makes it possible to see the performance of the students who remain in the system without any distortion that could come from changes in demographic composition. Thus, it is important to complement the average scaled scores and demographic analyses with assessments of individual student growth over time.
TABLE 5-1 Changes in Demographic Subgroups Enrolled in Tested Grades for DCPS and Charter Schools, 2007-2010
| DCPS | |||||||||||
| Year | Econ Dis | Non Econ Dis | Black | Hispanic | Whitea | LEP | Non-LEP | SPED | Non-SPED | Total | |
| 2007 | subgroup% | 62.2 | 37.8 | 83.5 | 9.5 | 5.3 | 8.2 | 91.8 | 21.8 | 78.2 | |
| # | 16,283 | 9,916 | 21,881 | 2,487 | 1,376 | 2,185 | 24,422b | 5,707 | 20,492 | 26,199 | |
| 2008 | % | 64.2 | 35.8 | 83.7 | 10.1 | 5.7 | 8.4 | 91.6 | 19.7 | 80.3 | |
| # | 15,125 | 8,440b | 19,463 | 2,353 | 1,331 | 1,993 | 21,872b | 4,638 | 18,927b | 23,259 | |
| 2009 | % | 68.5 | 31.5 | 80.0 | 11.2 | 6.9 | 11.6 | 88.4 | 20.8 | 79.2 | |
| # | 14,631 | 6,738 | 17,091 | 2,389 | 1,473 | 2,470 | 18,899 | 4,446 | 16,923 | 21,369 | |
| 2010 | % | 70.4 | 29.6 | 78.1 | 12.1 | 7.8 | 8.0 | 92.0 | 21.0 | 79.0 | |
| # | 14,587 | 6,140 | 16,181 | 2,518 | 1,610 | 1,663 | 19,064 | 4,352 | 16,375 | 20,727 | |
| Percentage Point | |||||||||||
| Change in Subgroup Composition (2010%-2007%) | 8.2 | –8.2 | –5.5 | 2.6 | 2.5 | –0.2 | 0.2 | –0.8 | 0.8 | ||
| Percentage Change in Number Enrolled (2010#-2007#/2007#) | –10.4 | –38.1 | –26.0 | 1.2 | 17.0 | –23.9 | –21.9 | –23.7 | –20.1 | –20.9 | |
| Public Charter Schools in DC | |||||||||||
| Year | Econ Dis | Non Econ Dis | Black | Hispanic | Whitea | LEP | Non-LEP | SPED | Non-SPED | Total | |
| 2007 | subgroup% | 66.3 | 33.7 | 90.4 | 6.6 | 2.2 | 4.3 | 95.7 | 12.8 | 87.2 | |
| # | 5,971 | 3,037 | 8,140 | 599 | 194 | 390 | 8,690b | 1,155 | 7,853 | 9,008 | |
| 2008 | % | 70.0 | 30.0 | 86.9 | 6.9 | 2.4 | 5.2 | 94.8 | 13.7 | 86.3 | |
| # | 6,718 | 2,876 | 8,608 | 687 | 241 | 501 | 9,184 | 1,310 | 8,284 | 9,900 | |
| 2009 | % | 72.0 | 28.0 | 89.6 | 7.6 | 2.2 | 6.0 | 94.0 | 13.4 | 86.6 | |
| # | 8,174 | 3,183 | 10,173 | 859 | 251 | 677 | 10,680 | 1,519 | 9,838 | 11,357 | |
| 2010 | % | 68.3 | 31.7 | 88.7 | 8.2 | 2.5 | 4.7 | 95.3 | 12.5 | 87.5 | |
| # | 7,962 | 3,698 | 10,339 | 952 | 297 | 550 | 11,110 | 1,452 | 10,208 | 11,660 | |
| Percentage Point | |||||||||||
| Change in Subgroup Composition (2010%-2007%) | 2.0 | –2.0 | –1.7 | 1.5 | 0.4 | 0.4 | –0.4 | –0.4 | 0.4 | ||
| Percentage Change in Number Enrolled (2010#-2007#/2007#) | 33.3 | 21.8 | 27.0 | 58.9 | 53.1 | 41.0 | 27.8 | 25.7 | 30.0 | 29.4 | |
NOTES: Tested grades are 3-8 and 10. Econ Dis = economically disadvantaged, LEP = limited English proficient, SPED = special education.
aPercentages (across black, Hispanic, white) do not sum to 100 because two subgroups (with very low numbers) are not shown.
bThe total across these two subgroups is greater than the total number of students reported for that year (see “Total” column at far right). Data are presented as they appear on the OSSE website; we were unable to determine the reason for the discrepancy. For these cases, percentages were calculated based on the sum across subgroups (not the total number from the far right column).
SOURCE: Compiled from http://www.nclb.osse.dc.gov/index.asp [accessed April 2011].
Looking Beyond Proficiency Rates
The primary data point reported for DC CAS (as for many assessment programs) is the proficiency rate, the percentage of students who perform at or above the proficient level. However, using proficiency rates has more significant limitations than using measures that more accurately reflect the spread of scores, such as averages. One limitation is that states have widely varying definitions of proficiency in core subjects. For example, a study for the U.S. Department of Education (Bandeira de Mello et al., 2009) found that the difference between the most and least challenging state standards for proficient performance in reading and mathematics was as large as the difference between the basic and proficient performance levels on NAEP. This study did not include the District because data were not available, but it is possible to compare the percentage of students at or above proficient on NAEP to that of DC CAS during the same year: see Figure 5-2, above. The reasons for the differences in the tests may be that the DC CAS is more closely aligned to the District’s—not NAEP’s—standards and therefore measures different things. It is also possible that the District, like many other states, has a lower bar for proficiency than does NAEP.
Another limitation to consider about data on the percentage of students performing at or above the proficient level is that this figure provides no information about students who are performing significantly above or below that level. Thus, this measure cannot reveal change that occurs at all other points on the scale—such as students who move from below basic to basic or from proficient to advanced. If a school or the district as a whole has focused on helping the students who are performing just below the proficiency cutoff point to cross that cutoff (sometimes called bubble kids), other students might receive less attention (Booher-Jennings, 2005; Neal and Schanzenbach, 2007).
Another and perhaps most important limitation is that the percent proficient statistic does not account for the weight (relative numbers of students) around the proficiency cut scores, and the fact that a slightly different choice in cut score may even reverse trends (Ho, 2008). Using proficiency scores to assess gains and gaps leads to “unrepresentative depictions of large-scale test score trends, gaps, and gap trends” and “incorrect or incomplete inferences about distributional change” (Ho, 2008, p. 1). Because of this limitation, analysts recommend statistics or summaries that accurately reflect the performance of all students, such as the average scaled scores and the distribution of these scores (Ho, 2008).
Although average scores provide a measure of whole group performance, the average may mask important subgroup differences. For example, it is possible for the overall average to be increasing while some subgroup scores are decreasing. Alternatively, the average may not show a change, even though some subgroups’ scores are significantly increasing. Thus, disaggregating results is essential to understanding of score trends.
A thorough evaluation of test scores in the District would examine how achievement has been changing across a number of student groups, considering:
- grade level,
- subject (and, in some cases, strands),
- types of schools (e.g., charter or traditional),
- student achievement levels (e.g., 10th, 25th, 50th, 75th, 90th percentiles),
- geography (e.g., in the District, ward),
- ethnicity,
- income level, and
- special populations, such as students with disabilities and English language learners.
We also note that policies that change the standards for classifying English language learners have potentially significant effects on the characteristics of the whole population, and, therefore, on average performance. Students who move into the proficient category, for example, are often automatically reclassified as non-English language learners (even though they may not have attained complete fluency) and, thus, are no longer counted in the subgroup. In this situation, overall scores would appear to decrease simply because the composition of the tested group changed.
Disaggregating data is complicated for DC because the city’s black population is large in comparison with that of many other school districts. Significant demographic differences within the city, including differences in levels of income and education, may therefore be obscured in analyses of achievement by racial group. DC’s unique population demographics make the black-white achievement gap less informative than comparisons within the demographic groups in the District and surrounding areas.
Although there is little argument about the importance of striving to eliminate long-standing achievement gaps, it would be misleading to focus on such aggregate gaps within the District population as was done, for example, in the 2008-2009 progress report of the DC Public Schools (District of Columbia Public Schools, 2009). The District’s black population
is very diverse, and includes both a concentration of very highly educated and successful black residents and many who are poorly educated and economically insecure. Socioeconomic differences are especially large between the northwest and southeast areas of the city, whose populations are dominated, respectively, by well-off whites and poor blacks. For example, recently released data from the American Community Survey—aggregated from 2005 to 2009—show that in northwest Washington more than 80 percent of adults have at least a bachelor’s degree and more than 50 percent have at least a master’s degree, while in southeast Washington fewer than 10 percent have a bachelor’s degree. And in most areas of northwest Washington, the median household income is well over $100,000 per year, while in southeast Washington, the median household income is well under $50,000 (U.S. Census Bureau, 2010).
It is highly misleading to compare academic achievement between populations of such different social and economic standing. Even in the absence of improved measures of individual students’ socioeconomic status (discussed below), when the new common core standards and common assessments become available, it should at least be possible to compare academic performance levels of white, black, and Hispanic students in the District with those in other, comparable student populations. In the meantime, naïve aggregate comparison of test scores among race-ethnic groups in the District should be interpreted critically and cautiously. Thus, analysts need to carefully consider student backgrounds when comparing average scores, for example, by disaggregating by socioeconomic background.
One way that is sometimes proposed to capture socioeconomic differences is to use eligibility for the National School Lunch Program (which provides free or reduced-price lunch for income-eligible students), but research suggests that this is not in fact a valid proxy (Harwell and Lebeau, 2010). Students are eligible for the lunch program if their family incomes fall below 125 percent of the official federal poverty guideline (for free lunch) or between 125 percent and 175 percent of the poverty line (for reduced-price lunch). However, the program serves only those students who apply, and not all who are eligible apply. The percentages of students identified as low-income using the NAEP lunch program are lower than the percentages identified by Census Bureau data (Booher-Jennings, 2005). Another difficulty with using the lunch program data as a measure comes from changes in policies regarding eligibility. During the past decade, the program has been offered to the entire populations of schools that meet certain criteria, as well as to individual students in any school. Thus, in some cases individual students who do not meet the criteria actually participate in the program. Moreover, the federal definition of the poverty threshold has risen significantly less than the standard of living since the 1960s, so the official poverty designation has come to refer to a relatively more deprived segment of the
population over time (see National Research Council, 1995). Because of these variations, eligibility for free or reduced-price lunch has limited value as a measure of socioeconomic status. Further research is needed to establish an improved measure of socioeconomic status that will capture differences in the District.
We reiterate that DC NAEP results should be disaggregated by socioeconomic status, as well as by race and ethnicity, to support meaningful inferences about student learning. Multiple methods should be used to track income level, such as parental education and home ownership status, as reported by parents or other responsible adults.
The percentage of students tested (of all students enrolled) for DC CAS and the inclusion rates of English language learners and students with disabilities for NAEP are also factors that can affect population scores while masking subgroup scores. For example, if there were a significant decrease in the percentage of students tested, it could significantly affect test scores because the students most likely to be excluded are low-performing ones. For NAEP, state or district policies may differ on the inclusion or exclusion of students with disabilities or English language learners. If larger numbers of these students are excluded in one district or state in comparison with another, the test’s results for that state or district may be inflated. For the District, the percentage of students with disabilities or who are English language learners and were excluded from the NAEP assessments dropped from 2007 to 2009: in mathematics, the exclusion rate declined from 6 to 4 percent in grade 4 and from 10 to 6 percent in grade 8; in reading, the exclusion rate dropped from 14 to 11 percent in grade 4 and from 13 to 12 percent in grade 8. This decrease in the percentage of excluded students provides additional evidence that the assessment gains for District students are real in every NAEP assessment.
Even individual student-level data will have significant limitations. Tracking students who leave the city is a challenge for the District, which has high rates of mobility to and from neighboring jurisdictions. It is also not generally possible to compare student performance across districts unless they use the same assessments (or ones that have significant overlap; see National Research Council, 2010b, for a discussion of cross-state comparisons). Since the DC CAS is only administered to students in public schools in the District, it is not possible to assess whether students in DC are “catching up” over time with students outside of the system: one can only track the relative movement of DC students in comparison with one another.
The DC State Board of Education voted in 2010 to adopt the common core standards, a set of standards in English language arts and mathematics
that have been developed cooperatively by the states and have been adopted by 40 other states.13 Since these standards are different from the current standards used for the DC CAS, a new set of assessments will be needed to replace the DC CAS. The District currently plans to adopt a new common assessment system that will align with the common core standards; such an assessment system is being developed by a multistate consortium.14 Once the new assessment system is operational, it will be possible to compare the progress of DC students with those in other jurisdictions, and thus to acquire additional evidence regarding changes in student performance since the passage of PERAA.
However, switching assessments also has disadvantages. If the DC CAS is not retained in some form for trend purposes, the District will no longer be able to compare current performance with that of the years prior to the implementation of a new assessment. It is possible to do a braided study (in which questions from the old test are nested within the new test) or to use the old test in a sample of schools for a few years to provide some information on trends. Since, as we noted above, performance typically falls in the first year after a new test is introduced and then rapidly improves as teachers and students become familiar with the new format and new standards, it will be important to take that into account in drawing conclusions about the results from a new test (see Koretz et al., 1991).
A second issue we note is that assessment scores are part of DCPS’s teacher performance management system. There is considerable debate over pay-for-performance and the reliability of value-added measures; we note here only that attaching direct consequences to student test scores may provide an added incentive for teachers to focus on tested content, at the expense of other important educational goals, or even to cheat by offering students help or information they are not intended to have (see Jacob and Levitt, 2003; Lazear, 2006; National Research Council, 2010a). Comparing overall and disaggregated student performance on DC CAS and NAEP can help to provide a check on the integrity of results.
Allensworth, E.M., and Easton, J.Q. (2007). What Matters for Staying On-Track and Graduating in Chicago Public High Schools: A Close Look at Course Grades, Failures, and Attendance in the Freshman Year, Research Report. Chicago: Consortium on Chicago School Research at the University of Chicago.
_______________
13For details, see http://www.corestandards.org/in-the-states [accessed January 2010].
14For the DC government press release announcing the State Board’s adoption, see http://newsroom.dc.gov/show.aspx/agency/seo/section/2/release/20261 [accessed March 2011].
Bandeira de Mello, V., Blankenship, C., and McLaughlin, D. (2009). Mapping State Proficiency Standards onto NAEP Scales: 20052007 (Research and Development Report, NCES 2010-456). Washington, DC: National Center for Education Statistics.
Booher-Jennings, J. (2005). Below the bubble: “Educational triage” and the Texas accountability system. American Educational Research Journal, 42(2), 231-268.
District of Columbia Public Schools. (2009). Progress: Second Year of Reform. Washington, DC: Author. Available: http://www.dc.gov/DCPS/Files/downloads/ABOUT%20DCPS/Strategic%20Documents/Progress%20Report%20-%202008-2009/DCPS-AnnualReport-7-21-2010-Full.pdf [accessed March 2011].
District of Columbia Public Schools. (2010). Learning Standards for Grades PreK8. Available: http://dcps.dc.gov/DCPS/In+the+Classroom/What+Students+Are+Learning/Learning+Standards+for+Grades+Pre-K-8 [accessed October 2010].
Harwell, M., and LeBeau, B. (2010). Student eligibility for a free lunch as an SES measure in education research. Educational Researcher, 39(2), 120-131.
Ho, A.D. (2008). The problem with “proficiency”: Limitations of statistics and policy under No Child Left Behind. Educational Researcher, 37(6), 351-360.
Jacob, B.A., and Levitt, S.D. (2003). Catching cheating teachers: The results of an unusual experiment in implementing theory. In W.G. Gale and J. Rothenberg Pack (Eds.), Brookings-Wharton Papers on Urban Affairs 2003 (pp. 185-209). Washington, DC: Brookings Institution Press.
Koretz, D.M. (2008). Measuring Up: What Educational Testing Really Tells Us. Cambridge, MA: Harvard University Press.
Koretz, D.M., Linn, R.L., Dunbar, S.B., and Shepard, L.A. (1991). The Effects of High-Stakes Testing on Achievement: Preliminary Findings About Generalization Across Tests. Paper presented at the Annual Meetings of the American Educational Research Association (April 3-7) and the National Council on Measurement in Education (April 4-6), Chicago, IL.
Lazear, E.P. (2006). Speeding, terrorism, and teaching to the test. The Quarterly Journal of Economics, 121(3), 1029-1061. Available: http://www.mitpressjournals.org/doi/abs/10.1162/qjec.121.3.1029?journalCode=qjec [accessed March 2011].
Linn, R.L. (2000). Assessments and accountability. Educational Researcher, 29(2), 4-16.
Miller, R.T., Murnane, R.J., and Willett, J.B. (2007). Do Teacher Absences Impact Student Achievement? Longitudinal Evidence from One Urban School District. (NBER Working Paper No. 13356). Cambridge, MA: National Bureau of Economic Research. Available: http://www.nber.org/papers/w13356 [accessed March 2011].
National Research Council. (1995). Measuring Poverty: A New Approach. C.F. Citro and R.T. Michael (Eds.). Panel on Poverty and Family Assistance: Concepts, Information Needs, and Measurement Methods. Committee on National Statistics. Commission on Behavioral and Social Sciences and Education. Washington, DC: National Academy Press.
National Research Council. (1999). High Stakes: Testing for Tracking, Promotion, and Graduation. J.P. Heubert and R.M. Hauser (Eds.). Committee on Appropriate Test Use. Board on Testing and Assessment. Commission on Behavioral and Social Sciences and Education. Washington, DC: National Academy Press.
National Research Council. (2010a). Getting Value Out of Value-Added: Report of a Workshop. H. Braun, N. Chudowsky, and J. Koenig (Eds.). Committee on Value-Added Methodology for Instructional Improvement, Program Evaluation, and Accountability. Center for Education. Division of Behavioral and Social Sciences and Education. Washington, DC: The National Academies Press.
National Research Council. (2010b). State Assessment Systems: Exploring Best Practices and Innovations, Summary of Two Workshops. A. Beatty, Rapporteur. Committee on Best Practices for State Assessment Systems: Improving Assessment While Revisiting Standards. Center for Education. Division of Behavioral and Social Sciences and Education. Washington, DC: The National Academies Press.
National Research Council and National Academy of Education. (2011). High School Dropout, Graduation, and Completion Rates: Better Data, Better Measures, Better Decisions. R.M. Hauser and J.A. Koenig (Eds.). Committee for Improved Measurement of High School Dropout and Completion Rates: Expert Guidance on Next Steps for Research and Policy Workshop. Center for Education. Division of Behavioral and Social Sciences and Education. Washington, DC: The National Academies Press.
Neal, D., and Schanzenbach, D.W. (2007). Left Behind by Design: Proficiency Counts and Test-Based Accountability. (NBER Working Paper No. 13293). Cambridge, MA: National Bureau of Economic Research. Available: http://www.nber.org/papers/w13293.pdf [accessed March 2011].
Office of Technology Assessment. (1992). Testing in American Schools: Asking the Right Questions. Summary. Washington, DC: U.S. Government Printing Office. Available: http://govinfo.library.unt.edu/ota/Ota_1/DATA/1992/9236.PDF [accessed March 2011].
Office of the State Superintendent of Education. (2010a). DCCAS Grade 3 Performance Level Descriptors. Washington, DC: Author. Available: http://osse.dc.gov/seo/frames.asp?doc=/seo/lib/seo/Grade_3_Performance_Level_Description.pdf [accessed November 2010].
Office of the State Superintendent of Education. (2010b). District of Columbia Comprehensive Assessment System: Resource Guide 2011. Washington, DC: Author. Available: http://osse.dc.gov/seo/frames.asp?doc=/seo/lib/seo/assessment_and_accountability/2011_dc_cas_resource_guide.pdf [accessed November 2010].
U.S. Census Bureau. (2010). 20052009 American Community Survey Five-Year Estimates. Available: http://factfinder.census.gov/servlet/DatasetMainPageServlet?_program=ACS&_submenuId=&_lang=en&_ds_name=ACS_2009_5YR_G00_&ts= [accessed March 2011].


