
Appendix A
Past, Present, and Planned Sensors
Past Sensors
Coastal Zone Color Scanner (CZCS)
| Sensor/Satellite | Agency | Mission Duration | Swath | Resolution | Bands | Spectral Coverage (nm) |
| CZCS | NASA (USA) | 1978-1986 | 1,556 km | 825 m | 6 | 433-12,500 |
Sensor Description:
The CZCS was the first satellite sensor devoted to ocean color imaging. Out of six spectral bands, four were used primarily for ocean color. These four bands were centered at 443, 520, 550, and 670 nm with a 20-nm bandwidth. The mission goal was to test whether satellite remote sensing could be used to identify and quantify suspended and dissolved material in the surface ocean. The sensor successfully demonstrated that ocean color could be used to quantify chlorophyll and sediment concentrations in the ocean. It provided the justification for SeaWiFS and MODIS.
Calibration:
The instrument was calibrated pre-launch. The on-orbit calibration was to have been accomplished by a built-in incandescent light source. The light source was redundant in case of failure and was calibrated using the instrument itself. The light from the lamp was used only to verify instrument stability with time. The calibration revealed the degradation of the sensitivity in the visible bands (Evans and Gordon, 1994). The vicarious calibration was conducted using post-launch validation cruises and the chlorophyll time-series from Bermuda.
Data Availability:
CZCS data are freely accessible.
Applications:
CZCS data were used to demonstrate the feasibility of ocean color remote sensing and its application to measuring global phytoplankton biomass and productivity. Because of the limited power, it could operate only a few hours per day.
Sea-Viewing Wide Field-of-View Sensor (SeaWiFS)
| Sensor/Satellite | Agency | Mission Duration | Swath | Resolution | Bands | Spectral Coverage (nm) |
| SeaWiFS | NASA (USA) | 1997-2010 | 2,806 km | 1,100 m | 8 | 402-885 |
Sensor Description:
The SeaWiFS mission was launched by the Orbital Sciences Corporation in 1997. It was a medium-spectral resolution imaging spectroradiometer operating in the visible to near-infrared spectral range, aboard the polar sun-synchronous OrbView-2 (OV-2) satellite. The sensor collected data in eight spectral bands (see Chapter 4; Table 4.5) from 402 to 885 nm. The instrument tilted ±20 degrees to minimize sun glint.
Calibration:
SeaWiFS mission used MOBY water-leaving radiances for the vicarious calibration and near-monthly lunar looks to track spectral band degradation over time. The mission included an extensive calibration/validation program using global in situ measurements for product validation.
Data Availability:
Data can be freely and openly accessed.1 Global data are freely distributed at Level 1 (TOA total radiances in eight bands), Level 2 (geophysical products such as the spectral marine reflectances and the chlorophyll concentration), and Level 3 (global gridded products).
Applications:
The NASA Ocean Color Group distributes the following products, which are used for a large array of applications described in Chapter 2:
Radiances at 412, 443, 490, 555, 670 nm; aerosol optical thickness at 865 nm; epsilon of aerosol correction at 765 and 865 nm; OC4 Chlorophyll a concentration; diffuse attenuation coefficient at 490 nm; Angstrom coefficient, 510-865 nm; Photosynthetically Active Radiation from the sun 400-700 nm; Normalized Difference Vegetation Index; Land Reflectance and a SeaWiFS Biosphere product.
GLI
| Sensor/Satellite | Agency | Launch Date | Swath (km) | Resolution (m) | Bands | Spectral Coverage (nm) |
| GLI/ADEOS II | NASDA (Japan) | 2002-2003 | 1,600 | 250/1,000 | 36 | 375-12,500 |
Sensor Description:
The Global Imager (GLI) was launched in 2002 aboard ADEOS II, which also carried POLDER-2 [Polarization and Directionality of the Earth’s Reflectances]. GLI is designed to provide frequent global observations of reflected radiance of the ocean, clouds, and land. The sensor has a multi-spectral observation capability with 36 bands and ground resolution of 1 km. Some channels have a resolution of 250 m.
Calibration:
Vicarious calibration was performed. Results of vicarious calibration workshop are available online.2
Data Availability:
Data products are available online.3
Applications:
Ocean color, water-leaving radiances and aerosols.
____________________________
1 See http://oceancolor.gsfc.nasa.gov/.
2 See http://suzaku.eorc.jaxa.jp/GLI/cal/index.html; accessed October 25, 2010.
3 See http://www.eorc.jaxa.jp.
Current Sensors in Polar Orbit
Moderate Resolution Imaging Spectroradiometer (MODIS) on TERRA and AQUA
| Sensor/Satellite | Agency | Launch Date | Swath | Resolution | Ocean Color Bands | Spectral Coverage (nm) |
| MODIS (Terra) | NASA (USA) | 1999 | 2,330 | 250/500/1,000 | 9 | 405-14,385 |
| MODIS (Aqua) | NASA (USA) | 2002 | 2,330 | 250/500/1,000 | 9 | 405-14,385 |
Sensor Description:
MODIS is a key instrument aboard the Terra (EOS AM) and Aqua (EOS PM) satellites designed for land, atmosphere, and ocean observations. Terra’s orbit around Earth is timed so that it passes from north to south across the equator in the morning, while Aqua passes south to north over the equator in the afternoon. MODIS-Terra and MODIS-Aqua are viewing the entire Earth’s surface every one to two days, acquiring data in 36 spectral bands, or groups of wavelengths.
Calibration:
MODIS is calibrated using a combination of solar and lunar viewing to track spectral calibration and temporal degradation as well as vicarious calibration using in situ observations of water-leaving radiance.
More recently, SeaWiFS imagery also had to be used to address sensor degradation issues.4
Data Availability:
All data and products (Levels 0-4) are freely available online5 via network download. Products: Normalized water-leaving radiance at 412, 443, 488, 531, 551, and 667 nm; aerosol optical thickness at 869 nm; epsilon of aerosol correction at 748 and 869 nm; diffuse attenuation coefficient at 490 nm; Angstrom coefficient, 531-869 nm; and sea surface temperature.
Applications:
MODIS serves a large array of applications including process and climate research and many resource managment applications.
MERIS Instrument, on Board the ENVISAT Platform
| Sensor/Satellite | Agency | Launch Date | Swath | Resolution | Bands | Spectral Coverage (nm) |
| MERIS | ESA (Europe) | 2002 | 1,150 | 300/1,200 | 15 | 412-900 |
Sensor Description:
MERIS is an ESA-led mission (Rast and Bézy, 1995; Rast et al., 1999). It is a medium resolution imaging spectroradiometer operating in the visible to near-infrared spectral range, aboard the sun-synchronous ENVISAT platform. It is set up with 15 spectral bands from 412 to 900 nm. MERIS is a “push-broom” spectrometer, with linear CCD arrays providing spatial sampling in the across-track direction, while the satellite’s motion provides scanning in the along-track direction. The MERIS field of view is 68°5 around nadir, which gives a swath width of 1,150 km covered by five identical optical modules (cameras) arranged in a fan shape configuration. The spatial resolution at nadir is 300 m (full resolution products), and is degraded to 1.2 km by a 4 × 4 pixel averaging (reduced-resolution products). Global coverage is obtained in three days (irrespective of clouds and sun glint).
Stability Monitoring:
Radiometric calibration uses two onboard solar diffusers. Spectralon is a very good reflectant with very well-characterized reflectance characteristics. Spectralon is subject to reflectance change over time after cumulative exposure to solar radiance, in particular to ultraviolet exposure. Because frequent solar views are required to monitor the sensor stability, the degradation of the Spectralon also must be monitored. Therefore, the first diffuser is used every two weeks for routine calibration, and the second one is used
____________________________
4 See http://www.opticsinfobase.org/abstract.cfm?uri=ao-44-26-5524.
every three months and therefore tracks possible degradation of the first one. An erbium-doped diffuser is used for spectral calibration. MERIS was launched in May 2002 for an initial and nominal five-year mission, which has been extended so that operations should continue through 2013.
Data Availability:
Open access. Global data are freely distributed at Level 1 (TOA total radiances in 15 bands), Level 2 (geophysical products such as the spectral marine reflectances and the chlorophyll concentration), and Level 3 (global gridded products).
Applications:
MERIS radiometric capabilities were set up in the 1990s to meet predefined requirements for ocean color remote sensing (e.g., Gordon, 1987, 1988, 1990, 1997; Antoine and Morel, 1999). The onboard devices have proven very efficient in maintaining a high radiometric accuracy and stability.
With respect to coastal applications, the current MERIS instrument has considerable advantages over SeaWiFS, MODIS, and VIIRS, given its comparatively high spatial resolution and many more spectral bands. No U.S. instrument will have MERIS capabilities for the foreseeable future.
The higher spatial resolution of MERIS resolves coastal features such as plumes and fronts that are not evident in the coarser resolution of the NASA sensors. The higher spectral resolution of MERIS enables more sophisticated algorithms for complex coastal waters. The Naval Research Laboratory at Stennis Space Center is currently using full resolution MERIS imagery to support assimilation of satellite-derived optics into ocean models that provide forecasts on time scales of 24-48 hours. NOAA is now acquiring MERIS high spatial resolution imagery in near-real time (ca. 12 hours) for U.S. coastal waters. NOAA’s Center for Coastal Monitoring and Assessment (CCMA) is using MERIS imagery to assess and forecast coastal and marine ecosystem conditions, including for harmful algal bloom (HAB) forecasts. During summer 2010, CCMA had operational programs to detect cyanobacteria and other HAB organisms in Lake Erie, Chesapeake Bay, and Florida coastal waters. According to NOAA’s Dr. Richard Stumpf, the MERIS “red bands” (centered at 620, 665, 680, and 709 nm) are particularly useful for CCMA HAB forecasts. There also is high potential for using these red bands as an alternative approach for retrieving chlorophyll in coastal waters. Algorithms based on these four bands are substantially unaffected by atmospheric correction errors. This is particularly important given the complexity of the atmospheres over the coastal ocean and inland waters.
COCTS-CZI
| Sensor/Satellite | Agency | Launch Date | Swath | Resolution | Bands | Spectral Coverage (nm) |
| COCTS-CZI/HY-1B | CNSA (China) | 2007 | 1,400/500 | 250/1100 | 10/4 | 402-12,500/433-885 |
With the exception of the general specifications in the table above, the committee did not obtain additional information on the status or performance of the Chinese Ocean Colour and Temperature Scanner/Coastal Zone Imager (COCTS-CZI).
OCM-2
| Sensor/Satellite | Agency | Launch Date | Swath | Resolution | Bands | Spectral Coverage (nm) |
| OCM-2/Oceansat-2 | ISRO (India) | 2009 | 1,420 | 360/4,000 | 9 | 400-900 |
Sensor Description:
OCM-2 was successfully launched in 2009 on board ISRO’s OCEANSAT-2 spacecraft. OCM-2 has the same design and specifications as OCM with the exception of a shift in spectral bands 6 and 7 (Chauhan and Navalgund, 2009). The original 670 nm band (band 6) has shifted to 620 nm; the 765 nm band (band 7) has shifted to 740 nm to avoid oxygen absorption. These improvements are expected to provide greater accuracy of the normalized water-leaving radiance in the shorter wavelengths due to improved atmospheric corrections. The instrument was designed to provide continuity with the OCM instrument.
The OCM-2 sensor has a swath of 1,420 km and similar bands to OCM, with two changes: The 765 nm channel has been moved to 740 nm to avoid O2 absorption, and the 670 nm channel has been replaced by a 620-nm channel for better quantification of suspended sediments. Oceansat-2 has two modes of operation: Local Area Coverage (LAC) with 360-
m real time transmission, and Global Area Coverage (GAC) with 4-km onboard recording and playback. GAC data coverage is between ± 75o latitude covering the full globe in eight days. The OCM-2 instrument is currently providing excellent datasets. The instrument has a tilting mechanism and the tilt is changed twice per year depending on seasonality, providing minimum sun glint over Indian waters.
Calibration:
OCM-2 includes a solar and lunar calibration (lunar look once every six months) to assess sensor degradation.6 A permanent cal/val site has been set up in the Lakashadweep Sea, and data from an optical buoy are being used for vicarious calibration of OCM-2 data. Extensive ship campaigns will also be organized for validation of geophysical data products. The NRSA Data Center (NDC) will carry out dissemination of 4-km GAC data products on the Internet after the cal/val phase of the mission. A Letter of Intent with NASA/NOAA for OCEANSAT-2 data sharing was signed last year.
Data Availability:
Open access7 users will be provided with Level 1-B basic radiance products (atmospherically corrected), which can be displayed using SeaDAS. Level 2 products will consist of chlorophyll-a concentration, Total Suspended Matter (TSM), diffuse attenuation coefficients (Kd-490 nm), and Aerosol Optical Depth (AOD) at 865 nm and Level 3 (weekly and monthly averages generated on trial basis). Level 1 and 2 data are available at a nominal cost directly from the National Remote Sensing Centre (NRSC).
Level 3 products will consist of weekly, monthly, and yearly binned products (4 km). An OC-4-type algorithm has been developed for OCM-2 using bio-optical archived data collected in the Arabian Sea as well as data from NOMAD.
Current Sensors in Geostationary Orbit
Korean COMS-1 GOCI
| Sensor/Satellite | Agency | Launch Date | Swath | Resolution | Bands | Spectral Coverage (nm) |
| GOCI/COMS | KARI/KORDI (S. Korea) | 2010 | 2,500 | 500 | 8 | 400-865 |
The Korea Aerospace Research Institute (KARI) developed and launched a GEO ocean color imager (GOCI) on June 26, 2010, that is spectrally similar to the Sea-viewing Wide Field-of-view Sensor (SeaWiFS). GOCI offers 360-m nadir ground sample distance (GSD; close to the CWI 300 m requirement) with sensor-provided pointing knowledge of 10 mrad, corresponding to 360-m nadir pointing uncertainty (Faure et al., 2007). While the system (Figure A.1) is located for Asian seaboard imaging and therefore does not provide western Contiguous United States (CONUS) coastal imagery, it should allow sub-diurnal GEO coastal marine data-efficacy verification.
KARI’s Communication and Ocean Monitoring Satellite (COMS) on which GOCI is mounted provides telecommunications as well as GOCI data from a relatively small (2,300 kg) GEO spacecraft. This is less than the mass of larger (3,200 kg) commercial GEO communications satellites, yet carries the GOCI instrument that has 78-kg mass, 100-W power, 1.4 × 0.8 × 0.8 m dimensions (x, y, z; z = nadir), with data rate dependent on custom-selected GOCI integration time per spectral band (Faure et al., 2007).
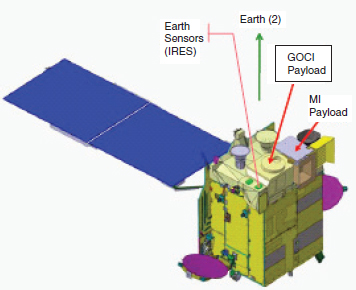
FIGURE A.1 South Korean COMS-1 satellite with geostationary ocean color imager (GOCI) and the Asian seaboard viewing area.
SOURCE: Faure et al., 2007; used with permission from Astrium.
____________________________
6 See http://www.ioccg.org/sensors/Navalgund_OCM-2.pdf; accessed October 22, 2010.
7http://www.ioccg.org/sensors/Navalgund_OCM-2.pdf; accessed October 22, 2010.
TABLE A.1 GOCI Spectral Capability.
| Central Wavelength (nm) | SeaWIFS (bandwidth, nm) | GOCT (bandwidth, nm) | Primary Use |
| 412 | 1(20) | 1(20) | Yellow substance and turbidity |
| 443 | 2(20) | 2(20) | Chlorophyll absorption maximum |
| 490 | 3(20) | 3(20) | Chlorophyll and other pigments absorption, K(490) |
| 510 | 4(20) | Chlorophyll absorption | |
| 555 | 5(20) | 4(20) | Suspended sediment |
| 660 | 5(20) | Fluorescence base 1, chlorophyll, suspended sediment | |
| 670 | 6(20) | Atmospheric correction | |
| 680 | 6(10) | Fluorescence signal, atmospheric correction | |
| 745 | 7(20) | Atmospheric correction, fluorescence base 2 | |
| 765 | 7(40) | Atmospheric correction, aerosol radiance | |
| 865 | 8(40) | 8(40) | Aerosol optical thickness, vegetation, water vapor reference over the ocean |
The GOCI spectral capability (Table A.1) is modest, with a filter wheel to select one of eight SeaWiFS-like spectral bands at a time. Nevertheless, the GOCI provides a case study of the benefits of GEO vs. LEO ocean color sensing via comparison of GOCI MODIS/SeaWiFS ocean color data. The committee believes it likely that NASA will conclude that even GOCI-like data, if located over CONUS, would provide coastal data to partially close the existing ocean color data gap. Therefore, were there a low-cost means (compared to the estimated cost of a GOES-R satellite, for example) to place such a system in GEO, perhaps NOAA and NASA would consider it.
Future Sensors in Polar Orbit
VIIRS on NPP and JPSS 1 & 2
| Sensor/Satellite | Agency | Launch Date | Swath | Resolution | Bands | Spectral Coverage (nm) |
| VIIRS/NPP | NOAA (USA) | 2011 | 3,000 | 370/740 | 22 | 402-11,800 |
| VIIRS/JPSS 1&2 | NOAA (USA) | After 2015 | 3,000 | 370/740 | 22 | 402-11,800 |
Sensor Description:
The Visible Infrared Imager Radiometer Suite (VIIRS) is a multi-spectral scanning radiometer scheduled to launch in 2011. VIIRS was designed to provide global observations of land, ocean, and atmosphere parameters at high temporal resolution (~ daily). It consists of a multi-spectral scanning radiometer (with 22 bands between 400 and 1,200 nm) with a swath width of 3,000 km.
Calibration:
A single solar diffuser and four lunar calibration looks per year if no orbital maneuvers are permitted.
Initial calibration will utilize matches with MODIS-Aqua. If resources can be mobilized to fund MOBY, MOBY water-leaving radiances will be incorporated as part of the vicarious calibration. The calibration for VIIRS on JPSS is likely to model the calibration of VIIRS on NPP, although the details regarding lunar maneuvers and a MOBY-like approach to vicarious calibration has to be determined.
Data Availability:
NOAA CLASS facility; open availability.
Applications:
Water-leaving radiance and chlorophyll.
OLCI Instrument on the Sentinel-3 platform
ESA is currently developing three satellite systems that form part of the Space Component of the European GMES (Global Monitoring for Environment and Security) program. The Sentinel-3, one of these missions, carries the wide-swath, medium resolution (300 m at nadir) visible and near-infrared “Ocean Land Colour Instrument” (OLCI) spectroradiometer.
The Sentinel-3 mission is meant to be operational, so it has stringent revisit, coverage, and mission life cycle requirements (>15 years) that require the deployment of several satellites for each mission.
The first Sentinel-3 should be launched in 2013 (Sentinel 3A), and the second one (3B) in 2017. The OLCI is mostly based on the MERIS heritage but with 21 spectral channels instead of 15 and a fixed 12-degree across-track tilt that aims to minimize sun glint (1,300-km swath). One satellite can obtain global coverage within four days; two satellites can do so within two days.
The same principles previously used for MERIS radiometric and spectral calibration are used for Sentinel-3/OLCI, ensuring a high level of radiometric accuracy and stability.
The product suite includes all products already provided by MERIS plus some advanced products, such as inherent optical properties.
The Sentinel-3 data policy is dictated by the GMES data policy, i.e., free and open access to all data. The OLCI operational ground segment should be operated by EUMETSAT. Other entities will operate the decentralized “thematic” ground segment.
S-GLI
| Sensor/Satellite | Agency | Launch Date | Swath | Resolution | Bands | Spectral Coverage (nm) |
| S-GLI/GCOM-C | JAXA (Japan) | 2014 | 1,150-1,400 | 250/1,000 | 19 | 375-12,500 |
Sensor Description:
The Second-Generation Global Imager (S-GLI) will be flown as part of the Global Change Observation Mission for Climate research (GCOM-C) mission. This sensor is a follow-on to the GLI, a multi-spectral radiometer with 19 wavebands ranging from 375 to 12,500 nm. The 250-m spatial resolution aims at improving coastal ocean and aerosol observations.
Calibration:
Onboard calibrations will include a solar diffuser, internal lamp, lunar look by pitch maneuvers (for visible channels) and lunar through deep space window (for short wave channels), and dark current.8
The target for data accuracy of SGLI products is at the same level for GLI products (Murakami et al., 2006).
Data Availability:
Data products expected to be available online.9
Applications:
The S-GLI observations aim to improve our understanding of climate change mechanisms through long-term monitoring of aerosols, ocean color, derived phytoplankton and clouds, as well as vegetation and temperatures.
____________________________
8 See http://www.ioccg.org/sensors/SGLI_mission_design_201002.pdf; accessed October 25, 2010.
9 See http://www.eorc.jaxa.jp.
COCTS-CZI
| Sensor/Satellite | Agency | Launch Date | Swath | Resolution | Bands | Spectral Coverage (nm) |
| COCTS-CZI/HY-1C/D | CNSA (China) | 2014 | 2,900/1,000 | 250/1,100 | 10/10 | 402-12,500/433-885 |
| COCTS-CZI/HY-1E/F | CNSA (China) | 2017 | 2,900/1,000 | 250/1,100 | 10/4 | 402-12,500/433-885 |
With the exception of the general specifications in the table above, the committee did not obtain additional information on the status or performance of the Chinese Ocean Colour and Temperature Scanner/Coastal Zone Imager (COCTS-CZI).
PACE and ACE
| Sensor/Satellite | Agency | Launch Date | Swath | Resolution | Bands | Spectral Coverage (nm) |
| PACE | NASA (USA) | >2019 | 116.6 degree | 1 km | 26 spectral bands (5-nm resolution 350-775 nm) | 350-2,135 nm |
Sensor Description:
The Pre-Aerosol-Clouds-Ecosystem (PACE) and Aerosol-Cloud-Ecosystems (ACE) mission aim to advance research in ocean biology and biogeochemical cycles.
Calibration:
The need for direct lunar calibration, a vicarious calibration site, and global data for product validation are listed among the mission requirements.
Data Availability:
The data likely will be freely and openly available.
Applications:
The products derived from these sensors will be applied to research on the carbon cycle, marine ecosystem, phytoplankton physiology, near-shore and estuarine processes, and on physical-biological interactions.


