
1
Introduction
The Chesapeake Bay is North America’s largest and most biologically diverse estuary, home to thousands of species of plants and animals (CBP, 2000) as well as an important commercial and recreational resource. The Chesapeake Bay serves as a key economic driver in the mid-Atlantic region, and the Chesapeake Bay Foundation (2010) valued its worth at over one trillion dollars to the watershed’s economy. The Bay’s ecosystem has been affected by human influences since early settlements, but these influences became known and more pronounced during the 20th century. Today, almost 17 million people live within the Bay’s 64,000 square mile (166,000 square kilometer) watershed in six states—Delaware, Maryland, New York, Pennsylvania, Virginia, and West Virginia—as well as the District of Columbia (Figure 1-1; CBP, 2010a). Excess amounts of nitrogen, phosphorus, and sediment from human activities and land development, including agriculture, urban and suburban runoff, wastewater discharge, and air pollution, are sent to the Bay (CBP, 2010a). These pollutants and other chemical and physical alterations have disrupted the ecosystem, causing degraded habitats and harmful algal blooms that impact the survival of fish, shellfish, and other aquatic life.
The Chesapeake Bay was among the first of the major U.S. estuaries where concerted efforts were made to understand the causes and consequences of changing ecosystem conditions. During the mid-1970s, a young U.S. Environmental Protection Agency (EPA) led the first comprehensive and detailed attempt to understand the Bay’s condition and what would be necessary to restore it to its former condition. That 7-year research effort culminated in the report, Chesapeake Bay: A Framework for Action (EPA,
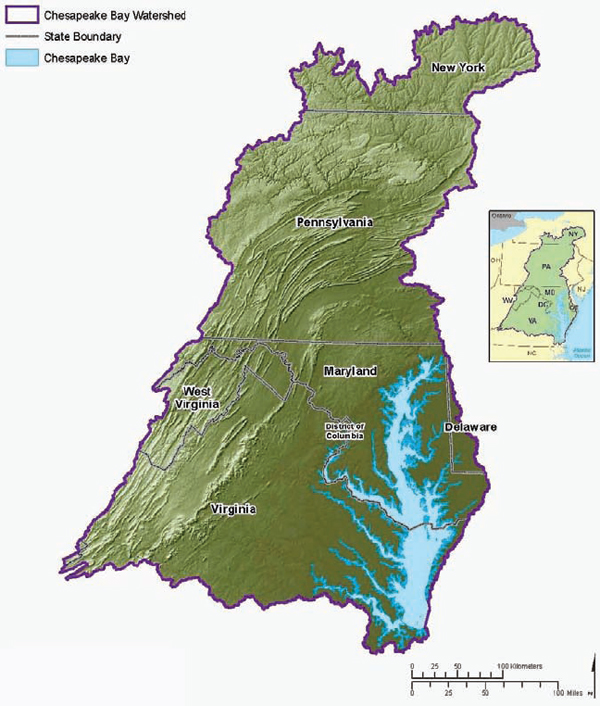
FIGURE 1-1 Chesapeake Bay Watershed.
SOURCE: CBP (2008). Available at http://www.chesapeakebay.net/maps.aspx?menuitem=16825.
1983a,b), which described the condition of the Bay’s ecosystem, its change over time, and scientific evaluations of the Bay’s functions in relation to its condition. The report established a framework for action to address some of the Bay’s most significant problems. Expert panels assembled by the EPA recommended immediate attention to the cultural eutrophication caused
by nutrient enrichment, which had caused a long-term decline in the Bay’s health (EPA, 1983a,b).
In 1983, the Chesapeake Bay Program (CBP) was established, based on a cooperative partnership among the EPA, the state of Maryland, the commonwealths of Pennsylvania and Virginia, and the District of Columbia, to address the extent, complexity, and sources of pollutants entering the Bay (EPA, 1983a). By 2002, the states of Delaware, New York, and West Virginia committed to the CBP’s water quality goals by signing a Memorandum of Understanding (CBP, 2002).
A key component of the restoration program focuses on improving the water quality in the Bay and its tidal tributaries. Water quality is evaluated according to three parameters that are linked to one or more of the Bay’s habitats and faunal communities: dissolved oxygen, water clarity, and chlorophyll a. Criteria for these three water quality parameters serve as the basis for the current goals, spurring efforts to reduce nutrient and sediment loads. Excess nitrogen and phosphorus loads fuel the growth of algal blooms, which increase chlorophyll concentrations, reduce clarity, and contribute to hypoxia (or low dissolved oxygen levels). Hypoxia, in turn, impacts water quality and habitat, especially underwater grasses and associated aquatic life (reviewed in NRC, 2000). In addition to these direct responses to nutrient enrichment, indirect responses and nonlinear feedback mechanisms, such as increased turbidity associated with the decline of filter-feeding bivalves and underwater grasses, may play an important role in the Bay’s degradation (Kemp et al., 2005). Other stressors such as chemical contaminants from air pollution, climate change, habitat destruction, and over-harvesting of fish and shellfish also stress the Bay and its living resources at great environmental, economic, and social costs to the populations that rely on a healthy ecosystem (CBP, 2010a).
In this introductory chapter, the sources and impacts of nitrogen, phosphorus, and sediment pollution in the Bay watershed are reviewed. A brief history of the CBP’s efforts is presented to provide context for the major current initiatives, including the total maximum daily load (TMDL) and the two-year milestone strategy. Finally, the committee’s task and approach are discussed.
NITROGEN, PHOSPHORUS, AND SEDIMENT
IN THE CHESAPEAKE BAY WATERSHED
Since colonization by Europeans almost 400 years ago, the Chesapeake Bay and its watershed have undergone significant human-induced changes, such as deforestation and urban development. The watershed is still dominated by wooded and open space (69 percent of the watershed), but agricultural and developed land uses (22 and 7 percent, respectively) are
significant and increasing (EPA, 2010a). Sedimentation from agricultural expansion and land-use conversions, runoff of fertilizers and animal wastes, and atmospheric deposition of nitrogen from fossil fuel combustion and agriculture have contributed to observed changes to the Bay (Brush, 2009; Cooper and Brush, 1991). By the mid-1980s, the Bay was receiving 7 times more nitrogen and 16 times more phosphorus than when English colonists arrived (Boynton et al., 1995).
This section briefly describes the specific sources of nitrogen, phosphorus, and sediments to the Bay and its watershed. These sources are internal (e.g., biological processes in soils, sediments, and the water column) and external (e.g., commodity imports, atmospheric deposition). On the whole for the Bay and its watershed, anthropogenic sources of both phosphorus and nitrogen are several-fold larger than natural sources (Boynton et al., 1995; reviewed in Rabalais et al., 2009).
Annual loads of nutrients and sediment vary widely with climatic conditions, with wet years leading to much higher loads (see Figure 1-2). Because this variability can create challenges for calculating source contributions, the pollutant source data presented in this section are largely based on model output. The data were produced by the CBP Phase 4.3 Watershed Model or the CBP Airshed Model (Box 1-1) and were presented in the Bay Barometer (CBP, 2010a). Recent watershed model updates provided new estimates, but the committee was unable to disassociate Phase 5.3 Watershed Model source load data to account for the specific contributions of atmospheric sources.1 The Phase 4.3 Watershed Model data presented in this section represent loading averages based on simulations over 14 years of hydrologic record using land use, best management practices (BMPs), and point-source controls reflecting 2007 conditions.
Nitrogen
Imported fertilizer and commodities (e.g., grain), primarily from other regions in the United States, and atmospheric deposition are important external sources of nitrogen to the Bay watershed. Atmospheric deposition of oxidized reactive nitrogen (NOy; the sum of nitric oxide [NO] and nitrogen dioxide [NO2] [collectively termed NOx] + all other oxidized nitrogen
_____________________
1 In many CBP reports, atmospheric deposition is frequently lumped into the source sector on which the nitrogen is deposited (i.e., nitrogen deposition on forested lands is considered a forest source). Thus, atmospheric deposition is reported as a much smaller fraction than the plots included in this chapter (e.g., Figure 1-3), which consider the original sources of the nutrients. Plots showing the actual sources were not available from the CBP Watershed Model Phase 5.3; therefore, these source data reflect model output from the earlier model, Phase 4.3. Comparison data to the latest model version are provided in subsequent footnotes.
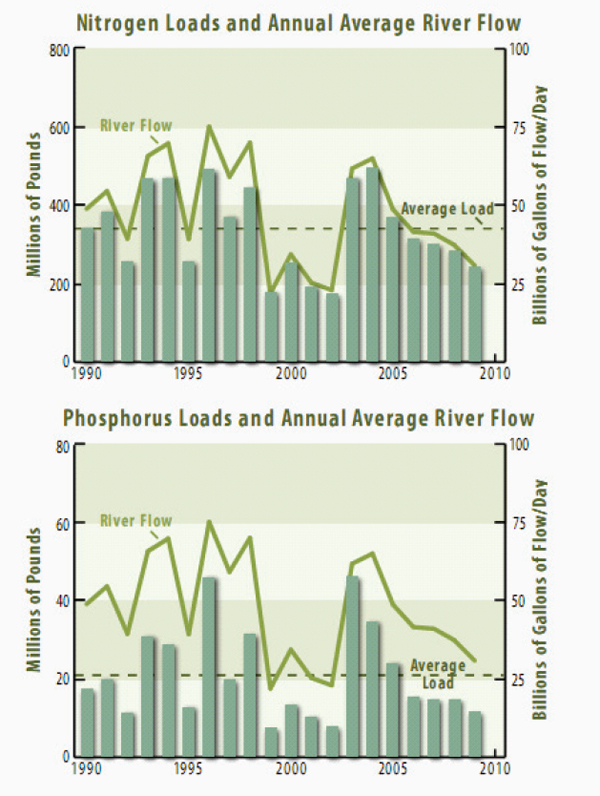
FIGURE 1-2 Nitrogen and phosphorus loading (millions of pounds) delivered to the Chesapeake Bay and total river flow (billions of gallons), 1990-2009. These loading estimates are based on direct measurements (i.e., monitoring in tributary rivers and point source discharges) supplemented by model estimates for ungaged portions of the watershed. The red lines indicate the 10-year average load targets for nitrogen and phosphorus (175 million pounds and 12.8 million pounds, respectively) established in EPA (2003).
SOURCE: CBP (2010a).
BOX 1-1
Chesapeake Bay Models
The CBP relies upon models to forecast the effects of changing nitrogen, phosphorus, and sediment management in the Chesapeake Bay. The models also form the basis of the current total maximum daily load (TMDL) allocations. The models are of two types: (1) models that simulate the physical, chemical, and biological processes in the airshed (Chesapeake Bay Airshed Model), watershed (Chesapeake Bay Watershed Model), and estuary (Chesapeake Bay Water Quality and Sediment Transport Model [or Bay Model]) and (2) models that convert land-use practices and implementation of best management practices (BMPs) into predictions of nutrient and sediment loads under average hydrologic conditions (the Land Use Change Model and Scenario Builder).
The Bay Airshed Model combines a wet deposition regression model with a continental-scale air quality model called the Community Multiscale Air Quality (CMAQ) Model. The Airshed Model provides the quantity of nutrients deposited via rainfall and dry deposition to the watershed and the Bay’s surface.
The Watershed Model is based on the Hydrologic Simulation Program-Fortran (HSPF) model. It receives the atmospheric and other nutrient inputs and stimulates the quantity of nutrients and sediment discharged to the tributaries and main stem Bay. It is a lumped-parameter model, which means that it is not able to represent spatial locations of specific land use categories in each of the many small watersheds in the overall Chesapeake Bay basin. Further, HSPF does not mathematically characterize the time dependency (lag) of the farm plot scale response to agricultural BMPs, nor does it consider lag times introduced by groundwater flow. In other words, an assumption in the HSPF model is that nutrient reductions due to BMP implementation are instantaneous load reductions as a simple fraction of the pre-BMP load.
The Bay Model combines a three-dimensional curvilinear hydrodynamic model (CH3D) with an eutrophication model (CE-QUAL-ICM) and computes the concentrations of nutrients and suspended sediment that result from the Watershed Model inputs, the quantity of phytoplankton that grow and decay, and the resulting water clarity and dissolved oxygen (DO) concentrations. In addition, the quantities of submerged aquatic vegetation (SAV) and water column (zooplankton) and benthic (deposit and filter feeding) organisms are also computed as well as specific simulations of oyster and menhaden populations. Modeled estimates of
DO, chlorophyll, and light attenuation are used to determine if Bay water quality standards for DO, chlorophyll a, and water clarity have been violated. The models of the watershed and estuary have been continuously developed and refined over a 25-year period (Table 1-1) (Linker et al., 2000, 2002, 2008).
The Land Use Change Model and Scenario Builder are used to construct input scenarios for the Watershed Model to analyze current loads and forecast future loads under various land-use conditions. The Land Use Change Model provides annual time series of land use in the watershed and forecasts the land-use changes expected through 2030. Scenario Builder converts the numerous BMPs, which have various pollution reduction efficiencies depending on type and location in the watershed, to a common currency of nitrogen and phosphorus load that will be generated by a given land use and estimates the area of soil available to be eroded. Loads are input to the Watershed Model to generate modeled estimates of loads delivered to the Bay (EPA, 2010a). The linkages between these models are illustrated in Figure 1-3.
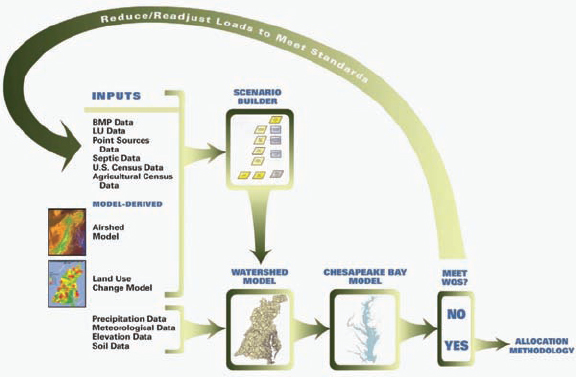
FIGURE 1-3 Key models used in the Chesapeake Bay Program.
SOURCE: EPA (2010a).
|
TABLE 1-1 Historical Development of the Watershed and Bay Models |
||||||
| Model Revisions | Watershed Model Characteristics | Bay Model Characteristics | Notable Advances | Period of Simulation | Management Decisions Supported | |
| Phase 1 (1985) | Based on HSPF. Contained 5 land uses, 64 segments | Steady state | First coupling of watershed, hydrodynamic, and water quality models | 4-month summer simulation only of 3 years (1965, 1984, and 1985) | General goal of 40% of controllable loads (CBP, 1987 | |
| Phase 2 (1992) | Expanded agriculture simulation detail | Dynamic 4,000 grid cell model | First integrated sediment flux model; first inclusion of atmospheric deposition. | 4 continuous years (1984-1987), hourly time step | Nutrient load reductions to achieve CBP (1987) goals | |
| Phase 4.3 (2003) | 9 land uses, 94 watershed segments | Dynamic 13,000 grid cell model | Integrated simulation of land and soil contaminant runoff processes; SAV, benthic deposit, and filter feeders models | 14 continuous years (1985-1994), hourly time step | Expanded nutrient allocations | |
| Phase 5.3 (2010) | 25 land uses (time variable), 899 watershed segments | Dynamic 57,000 grid cell model | Enhanced segmentation, land uses, and mechanistic detail | 21 continuous years (1985-2005) | TMDL | |
| SOURCE: EPA (2010b); L. Linker, EPA, personal communication, 2011. | ||||||
BOX 1-2
Forms of Atmospheric Nitrogen
Total oxidized reactive nitrogen, NOy
NOy = NO + NO2 + NO3 + HNO3 + N2O5 + HONO
+ organic nitrates + particulate nitrates
Nitrogen oxides, NOx
NOx = NO + NO2
Reduced inorganic nitrogen, NHx
NHx = NH3 + NH4
Unreactive nitrogen: N2
compounds except N2O) primarily results from combustion sources (see Box 1-2).
Atmospheric deposition of reduced inorganic nitrogen (NHx; ammonia [NH3] + aerosol ammonium [NH4]; Box 1-2) primarily results from agricultural sources, such as manure. Sources internal to the watershed are primarily natural biological nitrogen fixation (e.g., soils) and cultivation-induced nitrogen fixation (e.g., soybeans).2 For the Bay itself, the primary internal source is biological nitrogen fixation. Nitrogen that originates from sources internal and external to the watershed is delivered to the Bay waters by atmospheric deposition, direct discharges from wastewater treatment plants and stormwater systems, and groundwater and riverine inputs.
Once introduced into the watershed, the fate of nitrogen is dependent upon its source. A large fraction of the nitrogen from municipal and industrial wastewater point sources and urban runoff, which can be categorized either as a nonpoint source or regulated point source,3 is rapidly trans-
_____________________
2 Nitrogen fixation is a natural process by which unreactive nitrogen (N2) in the atmosphere is converted to biologically available ammonia by enzymatic reduction.
3 The Clean Water Act (CWA) defines a point source of water pollution as “any discernible, confined and discrete conveyance, including but not limited to any pipe, ditch, channel, tunnel, conduit, well, discrete fissure, container, rolling stock, concentrated animal feeding operation, or vessel or other floating craft, from which pollutants are or may be discharged.” Federal regulations require that all point sources meet discharge limitations provided for in National Pollutant Discharge Elimination System (NPDES) permits. More recently, stormwater runoff in urban areas meeting certain population density criteria or land use conditions has been defined as a regulated point source requiring an NPDES permit. Some urban and agricultural sources that are categorized as point sources under the CWA may be indistinguishable from unregulated nonpoint sources, both in terms of character and the management practices that may be effective in their control. The only difference is often size and whether a NPDES permit has been issued. To avoid confusion in this report, especially for readers who may
ported to the Bay. Of the nitrogen introduced into agricultural systems, most is used in the system and then lost to the atmosphere, discharged into an aquatic system, or stored in the soil. Less than 50 percent is actually incorporated into feed or food (Smil, 1999; Cassman et al., 2002). If nitrogen infiltrates into groundwater (e.g., from a septic system leach field or agricultural fertilizers), then it potentially could be stored for significant lengths of time (i.e., years to decades) before it is discharged to surface waters (Phillips and Lindsey, 2003; Lindsay et al., 2003; see Box 1-3).
Reactive nitrogen is lost from the watershed system by denitrification within the watershed and its waters and by export. Denitrification converts nitrate primarily to nitrogen gas (N2), with smaller amounts of N2O and NO produced. N2 formation represents a conversion of reactive nitrogen to an unreactive nitrogen form and thus removes the nitrogen from interaction with the earth systems’ processes for millions of years. N2O and NO formation, however, represent the conversion of one type of reactive nitrogen to other types of reactive nitrogen, each with their own environmental impacts. The amount of NO formed by denitrification is small compared to the NO formed from fossil fuel combustion within the watershed. In contrast, denitrification forms the primary source of N2O, a potent greenhouse gas, within the Bay and its watershed (Galloway et al., 2004, 2008). Overall, how much denitrification occurs in the Bay watershed remains the largest uncertainty of the nitrogen cycle.
Nitrogen is exported out of the watershed through three pathways: (1) atmospheric advection of the nitrogen emitted to the watershed’s atmosphere, (2) hydrologic transport of nitrogen to the coastal ocean in the waters leaving the Bay, and (3) shipment from the watershed of nitrogen-containing commodities that are produced in the Bay (e.g., shellfish, fish) or its watershed (e.g., food, feed).
Estimates of Nitrogen Source Loads to the Bay
Approximately 400 million pounds (181 million kg) of nitrogen compounds emitted to the atmosphere are deposited on the Bay’s watershed each year, with approximately 68 percent coming from NOy and 32 percent from NHx (R. Dennis, EPA, personal communication, 2011). Sources of atmospheric nitrogen are described in Box 1-4. Most of the deposited nitrogen is retained by forests or other vegetation and in other biological
________________________________________________
not be as familiar with federal regulatory programs, the terms “point” and “nonpoint” will be appropriately qualified as to origin, i.e., “municipal” and/or “industrial” point sources,” “urban” and/or “agricultural” point or nonpoint sources. In many cases, it is expeditious to aggregate urban and agricultural point sources and nonpoint sources, in which case the terms “urban runoff” and “agricultural runoff” are used to incorporate the two but do not include discharges from municipal or industrial wastewater treatment facilities.
processes before it reaches the Bay. Of all the atmospheric nitrogen that is deposited on the watershed annually, the Watershed Model estimates that approximately 75 million pounds (34 million kg) actually reach the Bay’s tidal waters, largely washed off impervious surfaces. Another 19 million pounds (8.6 million kg) are deposited directly on the Bay’s tidal waters, for a total of approximately 94 million pounds (43 million kg) or 33 percent of the total nitrogen load to the Bay (CBP, 2010a; Figure 1-4). Of the nitrogen that enters the watershed, that which is not quickly discharged to the Bay or denitrified to N2 is stored in the watershed in groundwater and can potentially be released to the Bay in the future (also called legacy nitrogen; see Box 1-3).
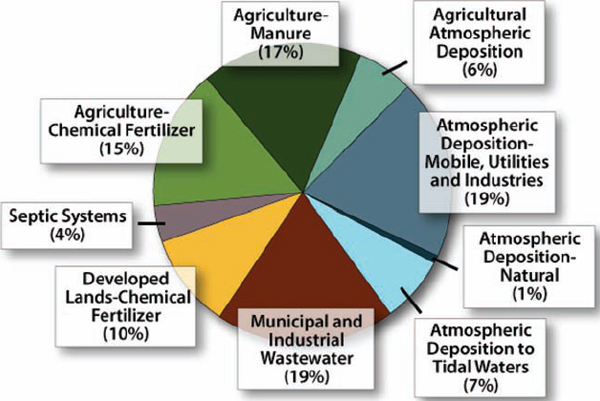
Figure 1-4 Sources of nitrogen to Chesapeake Bay.
NOTES: Based on model simulations using the Watershed Model Phase 4.3 and the Airshed Model, considering land use and pollution control measures in place as of 2007. The data reflects the average output when simulated over 14 years of hydrologic record and does not include loads from the ocean or tidal shoreline erosion. Atmospheric deposition loads are categorized by the source of the atmospheric nitrogen, except for the deposition directly to tidal waters, which includes all sources. For example, agricultural atmospheric deposition includes the atmospheric deposition that emanates from agricultural lands. Wastewater loads are based on measured discharges.
SOURCE: CBP (2010a).
BOX 1-3
Legacy Pollutants
Most nitrogen loads are contributed from large watershed areas and tend to be related to nitrogen applications used for land management (Heathwaite et al., 2000; Dale et al., 2010). Lag times between land-based BMP implementation and realization of nutrient reductions in the Bay are caused by the transport of nitrogen already present in groundwater. The lag time generally increases with stream order1 or watershed size. Lindsay et al. (2003) estimated that groundwater residence times in the Chesapeake Bay range from zero to more than 50 years, with a median age of 10 years, depending upon the flowpath (Figure 1-5). Thus, the potential response times between land-based BMP implementation and significant resulting decreases in nutrient discharge from larger watersheds can vary widely based on watershed size, depth of water flowpaths, and relative contribution of groundwater to stream flow, which vary with physiographic provinces of the Bay Watershed. For instance, groundwater in the Coastal Plain contributes a larger proportion (>70 percent) of stream flow than does groundwater in the Appalachian Plateau and Mountain Provinces; therefore, nitrogen reductions from land-base BMPs in the Coastal Plain could be substantially masked for
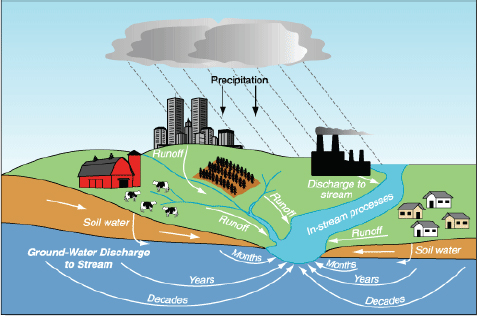
FIGURE 1-5 Age of groundwater draining to Chesapeake Bay.
SOURCE: Phillips and Lindsey (2003).
many years by the contributions of legacy groundwater nitrogen. Once delivered to the Bay, organic nitrogen in sediments can also create a lag time in water quality response, although organic nitrogen will be mineralized relatively quickly (with a half-life of a few years), after which legacy sediment nitrogen will not have a significant impact (Figure 1-6
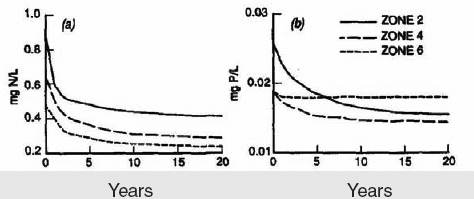
FIGURE 1-6 Modeled response of Bay water quality to an abrupt 50 percent reduction in all loadings to the Bay for Zone 2 (200-250 km from the mouth of the bay), Zone 4 (100-150 km), and Zone 6 (0-50km). (a) Surface total nitrogen, (b) Surface total phosphorus. These model runs do not consider the legacy effect of groundwater travel times on nitrogen concentrations, which can also be significant. Additionally, these simulations do not consider the effects of legacy phosphorus in watershed soils on loadings.
SOURCE: Cerco (1995).
Phosphorus from nonpoint and point sources can accumulate in soils and sediments, where it can remain sequestered and biologically inactive. Stored phosphorus in soil and sediments is referred to as legacy phosphorus. Phosphorus in Delmarva Peninsula soils has increased to levels nearly one order of magnitude greater than what is required for crop growth because of application of poultry litter (Buda et al., 2010). Accumulated phosphorus in the soil can remain for decades after phosphorus additions have ceased (Cox et al., 1981; Sharpley et al., 2009). Legacy phosphorus in stream and Bay sediments can be a source to the overlying water for a number of years after remedial actions have lowered the nutrient discharges. Legacy phosphorus can also be unpredictably released when hydrologic forces erode soils or resuspend sediments. These contributions often mask reductions in phosphorus
loads from BMP implementation. Watershed system structure can affect legacy phosphorus release rates with a slow release of phosphorus stored in soils and fluvial sediments and more rapid release along surface flowpaths where erosive and resuspension forces are stronger. Once sediments are delivered to the Bay, model estimates suggest that stored phosphorus can be a significant source for 5 to 10 years depending on the conditions in the overlying water and that overall response to an abrupt loading reduction reaches equilibrium after approximately 10 years (Figure 1-6; Cerco, 1995).
There are also legacy sediments in the Bay—sediments that have been deposited over many years. These solids compact over time and become less available for resuspension. Eventually they are buried by freshly deposited solids. To the extent that these processes take time, and that the legacy sediments participate in the quantity of solids that resuspend and settle, thereby contributing to the reduction in light penetration, there would also be a lag time associated with the response in bay water clarity to reductions in suspended solids delivered to the Bay.
______________________________________
1 Stream order defines the size of a stream. First-order streams, also called headwater streams, are the smallest and generally form on steep slopes in the upper reaches of a watershed. As streams converge, they increase in size and order. In other words, as streams and watersheds get bigger, the path of rainwater through soils and geologic formations becomes more tortuous and, thus, longer (Gburek and Folmar, 1999; Lindsay et al., 2003).
Monitoring data supplemented with modeling in ungaged stream reaches showed an average annual nitrogen load of 338 million pounds (153 million kg) between 1990 and 2009 (see Figure 1-2). Phase 4.3 Watershed Model simulations using BMPs and point-source loading based on 2007 conditions estimated hat an average of 281 million pounds (127 million kg) of nitrogen were delivered annually to the Bay’s tidal waters from all sources.4 According to model estimates, the largest contributing sectors were atmospheric deposition from mobile and industrial sources (19 percent), municipal wastewater treatment plants and industrial facilities (19 percent), excess animal waste from agricultural areas (17 percent), and excess fertilizer from agricultural areas (15 percent) (Figure 1-4). Other
_____________________
4 For comparison, the CBP Watershed Model Phase 5.3 calculates that an average of 246 million pounds of nitrogen per year was delivered to the Bay based on 2009 land use scenarios when simulated over 21 years of hydrologic record (S. Ravi, CBPO, personal communication, 2011).
BOX 1-4
Sources of Atmospheric Nitrogen in the
Chesapeake Bay Watershed
In 2002, poultry (including all poultry-related sources such as bedding or poultry houses, with the exception of manure), manure from all animals, and chemical fertilizer application were the major sources of reduced inorganic nitrogen (NHx) deposited to the Bay watershed (Table 1-2). This deposition was from emission sources both within and outside of the watershed. By extrapolating model data from 2002, it was estimated that about 50 percent of the NHx deposition resulted from emissions within the watershed, and about 50 percent resulted from emissions outside of the watershed, mostly from outside the airshed.
In 2002, mobile sources and power plants were the major sources of oxidized reactive nitrogen (NOy) deposited to the watershed (Table 1-3). This deposition was from emission sources both within and outside of the watershed. By extrapolating model data from 1990 (Paerl et al., 2002), it was estimated that 38 percent of the NOy deposition resulted from NOx emissions within the watershed, and 62 percent resulted from NOx emissions outside of the watershed, mostly within the airshed (Dennis, 1997; Paerl et al., 2002).
|
TABLE 1-2 Percentage of Total Reduced Nitrogen (NHx) Deposition to the Chesapeake Bay Watershed and to the Chesapeake Bay by Source/Sector |
||
|
Source/Sectors |
Percent of Atm. |
Percent of Atm. |
| Poultry | 22.0 | 22.5 |
| Dairy | 9.5 | 4.3 |
| Beef | 6.1 | 4.0 |
| Swine | 6.8 | 10.7 |
| Other animals | 2.2 | 1.7 |
| Manure | 21.1 | 16.6 |
| Chemical fertilizer | 14.4 | 16.1 |
| On road mobile sources | 9.8 | 14.2 |
| Other non-agriculture | 5.4 | 7.4 |
| Canada | 2.7 | 2.6 |
|
Total |
100.0 |
100.1 |
|
TABLE 1-3 Percentage of Total Oxidized Reactive Nitrogen (NOy) Deposition to the Chesapeake Bay Watershed and to the Chesapeake Bay by Source/Sector |
||
|
Source/Sectors |
Percent of Atm. |
Percent of Atm. |
| Power plants (EGUs) | 25.5 | 23.0 |
| Mobile sources (on road) | 34.7 | 35.1 |
| Industry | 9.3 | 8.9 |
| Off road; Construction; Marine | 8.7 | 9.6 |
| Residential and commercial | 13.5 | 17.0 |
| Other | 8.2 | 6.5 |
|
Total |
99.9 |
100.1 |
SOURCE: R. Dennis, EPA, personal communication, 2011.
significant sources include runoff from chemical fertilizers applied to urban/suburban lands, atmospheric nitrogen pollution derived from agricultural lands, and septic systems.
Phosphorus
Phosphorus occurs naturally in the soils and sediments of the Chesapeake Bay and its watershed, released slowly from mineral weathering and from decomposition of vegetation, with limited injection from the atmosphere. However, with growth in the human population and per-capita resource use, phosphorus has been introduced into the Bay watershed through the import of phosphorus fertilizer and of phosphorus-containing commodities, especially food and feed. According to CBP estimates, about 97 percent of the phosphorus now entering the watershed is from anthropogenic sources (CBP, 2010a; Figure 1-7).
Once introduced into the watershed for agriculture, phosphorus is either incorporated into agricultural products or lost to the environment during the food and feed production process. Unlike nitrogen, which can be converted to unreactive N2 by denitrification, the only way to remove phosphorus from the system is through discharges to the coastal ocean or by export of phosphorus-containing commodities. With those two excep-
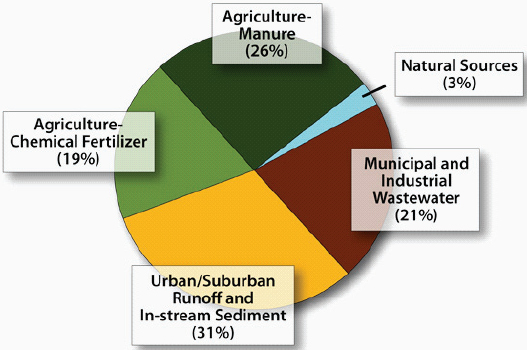
FIGURE 1-7 Sources of phosphorus to the Chesapeake Bay.
NOTES: Based on model simulations using the Watershed Model Phase 4.3, considering land use and pollution control measures in place as of 2007. The data reflects the average output when simulated over 14 years of hydrologic record. It does not include loads from the ocean or tidal shoreline erosion. Wastewater loads are based on measured discharges.
SOURCE: CBP (2010a).
tions, essentially all of the phosphorus introduced into the Bay watershed stays there. Because more phosphorus currently goes in than goes out, phosphorus is accumulating in the soils and sediments of the watershed and has the potential to be released to the Bay in the future (also called legacy phosphorus; see Box 1-3).
Estimates of Phosphorus Source Loads to the Bay
Between 1990 and 2009, the average annual phosphorus load based on direct measurements was estimated to be 21.0 million pounds (9.5 million kg) (Figure 1-2). Based on a 2007 source-loading scenario simulated over 14 years of hydrologic record using Watershed Model Version 4.3, an average of 18.2 million pounds per year (8.3 million kg/year) of phospho-
rus was estimated to be delivered to the Bay’s tidal waters (Figure 1-7).5 The largest contributing sectors included urban/suburban runoff (including in-stream sediment) (31 percent), excess animal waste from agricultural areas (26 percent), municipal wastewater treatment plants and industrial discharge (21 percent), and excess fertilizer from agricultural areas (19 percent).
Sediments
Sediment delivery to coastal waters by rivers and streams is a natural process created by the weathering of rocks and soil, but agricultural and urban/suburban activities have accelerated erosion and are now major contributors to sediment loads to the Bay (Figure 1-8). The average annual sediment load between 1990 and 2009 was estimated from direct measurements to be 8.0 billion pounds (3.6 billion kg) (CBP, 2010a). Based on a 2007 source-loading scenario simulated over 14 years of hydrologic record using Watershed Model Phase 4.3, an average of 9.6 billion pounds per year (4.4 billion kg) of sediment was estimated to be delivered to the Bay’s tidal waters (CBP, 2010a).6 Agricultural areas contribute approximately 60 percent of the total sediment load to the Bay, while “natural sources” (as classified by the CBP), such as forests, contribute 21 percent. Natural sources may include anthropogenic disturbances such as roads. Approximately 19 percent originates from urban and suburban runoff and sediment in stream channels from deposits that occurred during the conversion of forested areas to developed lands. Large reservoirs of sediment also exist behind dams in the watershed, such as the Conowingo Dam on the Susquehanna River. These dams currently trap a large quantity of sediment mobilized in the watershed, but sediment loads would increase substantially if, in the future, large dams are allowed to reach sediment storage capacity (Langland and Cronin, 2003).
Effects of Excess Nutrient and Sediment Loads to Coastal Waters
As with many estuaries throughout the world, one of the primary water quality challenges facing the Chesapeake Bay is cultural eutrophication—a
_____________________
5 For comparison, the CBP Watershed Model Phase 5.3 calculates that an average of 16.5 million pounds per year (7.5 million kg/yr) of phosphorus was delivered to the Bay based on 2009 land use scenarios when simulated over 21 years of hydrologic record (S. Ravi, CBPO, personal communication, 2011).
6 For comparison, the CBP Watershed Model Phase 5.3 calculates that an average of 8.0 billion pounds per year (3.6 billion kg/yr) of sediment was delivered to the Bay based on 2009 land use scenarios when simulated over 21 years of hydrologic record (S. Ravi, CBPO, personal communication, 2011).
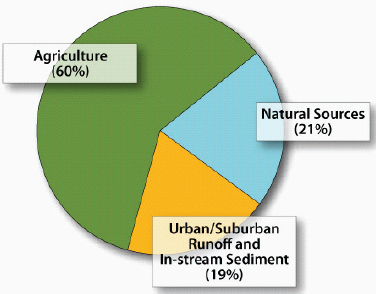
FIGURE 1-8 Sources of sediment to the Chesapeake Bay.
NOTES: The percentages are the currently available estimates and are based on model simulations using the Watershed Model Phase 4.3, considering land use and pollution control measures in place as of 2007. The data reflects the average output when simulated over 14 years of hydrologic record. Does not include loads from the ocean or tidal shoreline erosion.
SOURCE: CBP (2010a).
process by which human activities in the watershed and airshed lead to increased nutrient influxes to the water body, producing excess levels of nutrients that stimulate undesirable blooms of phytoplankton and macroalgae (Boesch et al., 2001; Cloern, 2001; Kemp et al., 2005; Bricker et al., 2007). Such blooms harm estuarine ecosystems in several ways. They reduce water clarity and block sunlight, reducing the size, quality, and viability of underwater grasses (also known as submerged aquatic vegetation [SAV]) and other aquatic habitats. Several bloom-forming phytoplankton species also produce toxins that can negatively affect the structure and function of aquatic food webs (Anderson et al., 2002) and pose health threats to wildlife and humans (Havens, 2008).
As phytoplankton and macroalgae die and decompose, dissolved oxygen is removed from the water column and bottom sediments. When the Bay is more strongly stratified in the summer, its bottom waters are not adequately replenished with dissolved oxygen to offset the effects of microbial decay under nutrient-enriched conditions. Because an adequate supply
of dissolved oxygen is essential to the survival of aquatic organisms, such reductions can have substantial impacts on the local fauna. Fish and other highly mobile organisms can often disperse from areas with reduced dissolved oxygen levels, but they and the less mobile benthic infauna or early life stages of fish and shellfish can be physiologically stressed or killed by lengthy exposures to reduced dissolved oxygen that reaches hypoxic (< 2.0 mg/L) or anoxic (0 mg/L) levels (Gray et al., 2002).
Although phytoplankton and macroalgae require about 20 different nutrients and minerals to survive and reproduce (Reynolds, 2006), the macro-nutrients nitrogen and phosphorus tend to be the most important factors driving the eutrophication process in surface water bodies (NRC, 2000). In pristine environments the availability of nitrogen and/or phosphorus is usually low enough to limit algal growth rates. By adding large amounts of biologically available nitrogen or phosphorus to surface waters, human activities can reduce or eliminate these nutrient limitations and stimulate bloom development.
Nutrient loadings from nonpoint and point sources have resulted in hypoxic conditions in many of the world’s vital water bodies (Rabalais et al., 2009). Diaz and Rosenberg (1995, 2008) note that no other environmental variable of such high ecological importance to global estuarine ecosystems has been altered so drastically in such a short period of time. In the Chesapeake Bay, data show that average volumes of hypoxic waters at mid-summer almost doubled from the time period 1950-1985 (an average of 4.5 km3) to recent years, 1986-2007 (an average of more than 8 km3) (Hagy et al., 2004; Rabalais et al., 2009). Such low levels of oxygen can lead to exclusion of fish and other biota from the water column (Courtant and Benson, 1990), and loss of prey biomass as a result of hypoxia can have extensive effects on fisheries (Diaz and Rosenberg, 2008).
Excess amounts of sediment in the water can prevent the attainment of water clarity criteria. Similar to the effects of excess planktonic algae, clay and silt particles suspended in the water column block sunlight from reaching underwater grasses, resulting in reduced extent of these productive aquatic meadows. Reduced extent or elimination of underwater grasses can affect juvenile fish, blue crabs, and other aquatic life needing the vegetation for shelter to survive. Nutrients and chemical contaminants can bind with sediments, allowing the pollutants to spread throughout the Bay and its local waterways. In addition, oysters and other bottom-dwelling species can lose necessary hard substrates for setting or be smothered when excess sediment settles to the bottom.
Based on these collective impacts, the Bay jurisdictions (i.e., the six states and the District of Columbia) have been charged with implementing restoration activities to reduce pollutant loadings to levels believed necessary to improve the health of the Chesapeake Bay ecosystem.
HISTORY OF CHESAPEAKE BAY PROGRAM
RESTORATION EFFORTS: 1983-2008
Since its inception in 1983, the CBP has worked to understand and address the causes and effects of excess nitrogen, phosphorus, and sediment loadings to the Bay. Critical elements of the evolution of the CBP are outlined below and include: (1) developing measurable restoration and protection goals for the Bay’s living resources and habitats, and identifying nitrogen, phosphorus, and sediment loading reduction goals necessary to obtain and sustain living resource goals; (2) adopting agreements among participating states and federal agencies to meet load reduction goals; (3) implementing efforts to meet agreements; and (4) measuring and reporting of results to date.
Development of Measurable Restoration and Protection Goals
The CBP is recognized internationally as having developed rigorous, research-based, natural resource goals and the numeric water quality and sediment targets needed to support those goals. The CBP has developed measurable goals for critical natural resources in the Bay, including underwater grasses, oysters, benthic organisms, and several fish species (Table 1-4). Although the CBP has developed many resource goals, this report will focus on those related to water quality targets and nutrient and sediment loadings.
Extensive research and monitoring have resulted in defined water quality targets to meet and maintain the natural resource goals. These goals have been revised and refined as additional information and data become available but are generally based on regulatory standards (e.g., dissolved oxygen criteria to meet the designated use), modeled cause-and-effect relationships (e.g., chlorophyll a concentration goals to meet water clarity goals), or historic values (e.g., underwater grass acreages representing the documented acreage found from the 1930s to present).
In 2003, the CBP established nitrogen and phosphorus cap loads for each major river basin and jurisdiction based on CBP model projections of attainment of dissolved oxygen water quality criteria. The CBP set long-term (10-year) average nitrogen and phosphorus load targets for the Bay at 175 and 12.8 million pounds (79 and 5.8 million kg) per year, respectively. The attainment of these cap loads was expected to eliminate summer hypoxia in the Bay’s deeper waters and excessive algal blooms throughout the bay (EPA, 2003). The following section discusses these goals in more detail and also highlights agreements between the CBP partners.
|
TABLE 1-4. Chesapeake Bay Water Quality and Bay Resource Goals and Status as of 2009 |
||||||
| Indicator | Metric | Goal | 2008-2009 Status | |||
|
Bay Ambient Water Quality |
||||||
| Dissolved oxygen concentration | Varies by fish or shellfish species, season, and location in the Bay. Generally, higher levels of oxygen are needed in shallow waters during the spring, when aquatic animals spawn. | 100% of the Bay and its tidal tributaries to meet applicable standards for dissolved oxygen | 12% of the Bay and its tidal tributaries met standards for dissolved oxygen in 2007-2009 | |||
| Water clarity | Adequate light to support underwater grasses during the growing season. Varies by location and depth. | 100% of the Bay to meet guidelines for water clarity | 26% of the Bay’s tidal waters met or exceeded guidelines in 2009 | |||
| Chlorophyll-a concentration | Varies by location and depth, and linked to water clarity goal | 100% of the Bay’s tidal waters to be below certain threshold concentrations of chlorophyll a that are acceptable to underwater grasses | 29% of the Bay’s tidal waters met or exceeded guidelines in 2009 | |||
| Bay Resources | ||||||
| Bay bottom habitat | Index of Biotic Integrity (IBI) is used to rate the health of bottom habitats on a scale of 1 (low) to 5 (high) | All IBI scores for Bay bottom habitat to be at least 3 | 56% of the Bay bottom habitats had an IBI score of at least 3 in 2009 | |||
| Underwater grasses | Acres of underwater grasses | 185,000 acres (74,900 hectares [ha]) of underwater grasses in the Bay by 2010, which represents the documented acreage found from the 1930s to present | 85,899 acres (34,800 ha) in 2009, 46% of the Bay-wide goal | |||||
| Phytoplankton | IBI is used to rate the health of phytoplankton on a scale of 1 (low) to 5 (high) | All IBI scores for phytoplankton health to be at least 3 | 54% of the Bay’s waters met the phytoplankton goal in 2009 | |||||
| Oysters | Oyster biomass | Achieve at least a 10-fold increase in native oysters in the Bay by 2010, based on 1994 levels, which would equal 31.6 billion grams of oyster biomass | 10% of goal achieved in 2008 | |||||
| Blue crab | Number of blue crabs in the bay | 200 million blue crabs that are at least 1 year old in the Bay | 112% of goal achieved in 2009 | |||||
| Striped bass | Female spawning stock biomass | Spawning stock biomass equal to the averages from 1960-1971, which is 82.7 million pounds (37.5 million kg) of the females | 148% of goal achieved in 2008 | |||||
| American shad | Spawning stock biomass in major river systems | 2 million fish in the Susquehanna River stock each year | 27% of goal achieved in 2009 | |||||
| Menhaden | Percentage of cast and seine net hauls in which juvenile menhaden are caught | No goal defined, used to track trends | 22% positive hauls in 2009 | |||||
| SOURCE: CBP (2010a). | ||||||||
Adoption of Agreements among Participating Jurisdictions and
Government Agencies to Meet Load Reduction Goals (1983-2008)
In 1983, the governors of Maryland, Virginia, and Pennsylvania; the mayor of the District of Columbia; the EPA; and the chair of the Chesapeake Bay Commission, later named the Chesapeake Executive Council, signed the Chesapeake Bay Agreement, a pledge aimed at restoring the Bay and its ecosystem (EPA, 1983a). In 1987, the Executive Council signed a follow-up agreement to “reduce and control point and nonpoint sources of pollution to attain the water quality conditions necessary to support the living resources of the bay” and “plan for and manage the adverse environmental effects of human population growth and land development in the Chesapeake Bay watershed.” In this agreement, the Executive Council set a specific goal of reducing the amount of nitrogen and phosphorus entering the Bay’s main stem by at least 40 percent by the year 2000. The 40 percent nutrient reduction goal was to be measured against 1985 point and nonpoint source loads in an average rainfall year (CBP, 1987). The CBP interpreted the goal to mean a 40 percent reduction in “controllable” nutrients, which did not include atmospheric deposition and the contributions of non-signatory states (Ernst, 2003).
The 1987 agreement was amended in 1992 to include a tributary-specific focus aimed at rehabilitating the majority of fish spawning grounds and essential habitat, which are located in the tributaries (CBP, 1992). In 1993, the CBP committed to develop jurisdiction-specific tributary strategies to achieve the water quality requirements necessary to restore living resources in both the Bay’s main stem and its tributaries and to attain the 40 percent nutrient reduction goal. The amendment also highlighted the difficulty of achieving the goals set by the Executive Council, noting that “achieving a 40 percent nutrient reduction goal, in at least some cases, challenges the limits of current point and nonpoint source control technologies” (CBP, 1992). The CBP admitted that mustering the political will to reduce nutrient loading and control population growth and urban sprawl across the watershed was a huge challenge.
By 2000, it was clear that the promised 40 percent reduction of the controllable loads of nitrogen and phosphorus had not been attained. However, during the years since the 1987 agreement, the landscape of water pollution management under the Clean Water Act (CWA) had shifted toward more quantitative assessments of water quality impairments and more quantitative management action. Under Section 303(d) of the CWA, states and tribes are required to identify and maintain lists of water bodies that do not meet adopted water quality standards (defined as nonattainment) and to assign priorities for the development of TMDLs. The TMDLs would identify the maximum amount of each pollutant from point and nonpoint
sources that the water bodies could receive and still comply with water quality standards, including a margin of safety. Therefore, the states with jurisdiction over Bay segments that were not attaining dissolved oxygen and other numeric standards and criteria could be required to develop TMDLs to control pollutant loads consistent with their water quality standards.
The 2000 Chesapeake Bay Agreement provided an alternative to development of a TMDL, consistent with EPA regulations that allowed under TMDL priority “Category 4b” that a TMDL is not needed if other pollution control requirements are expected to result in the attainment of an applicable water quality standard in a reasonable period of time. The 2000 Agreement, signed again by the CBP partners, not yet including New York, West Virginia, or Delaware, acknowledged the difficulty of the management tasks facing them, including the management of nutrients. In the preamble, a concession to this difficulty stated,
While the individual and collective accomplishments of our efforts have been significant, even greater effort will be required to address the enormous challenges that lie ahead. Increased population and development within the watershed have created ever-greater challenges for us in the Bay’s restoration. These challenges are further complicated by the dynamic nature of the Bay and the ever-changing global ecosystem with which it interacts.
In the 2000 agreement, the CBP partners recommitted to achieving the 40 percent nutrient reduction goal set in 1987 until specific nitrogen and phosphorus cap loads for each major river basin and jurisdiction could be developed. The Bay partners also committed to correcting the Bay’s nutrient-and sediment-related problems by 2010. The 2000 Agreement also reiterated the goal of improving water quality in the Bay and its tributaries “so that these waters may be removed from the impaired waters list prior to the time when regulatory mechanisms under Section 303(d) of the Clean Water Act would be applied” (CBP, 2000).
The nitrogen and phosphorus cap loads were determined in 2003 (EPA, 2003), as discussed in the previous section, and the CBP jurisdictions developed new tributary-specific strategies to achieve the cap loads. The Chesapeake Bay Tributary Strategies, released during 2004-2006, outlined partner-specific implementation activities within each tributary necessary to remove the Bay and tributaries from the impaired waters list (summarized in EPA, 2010a). In 2007, the CBP re-evaluated the nutrient and sediment cap loads and found that sufficient progress had not been made toward improving water quality (CBP, 2007a). These findings led to the development of the two-year milestone strategy, the federal Chesapeake Bay TMDL, and watershed implementation plans, described later in this chapter.
Implementation Efforts to Meet Agreements (1987-2008)
Between 1987 and 2008, the CBP, in coordination with its federal, state, and local partners, developed and implemented a set of management strategies aimed at reducing the amount of nutrients entering the Bay. Overall, the 2009 Bay Barometer stated that the CBP partnership has implemented 64 percent of the needed actions to reduce pollution, restore habitats, manage fisheries, protect watersheds, and foster stewardship (CBP, 2010a).
Nutrient and sediment management strategies can be divided into four main categories: activities to preserve and restore natural lands, activities to control pollution from agricultural lands, activities to control pollution in urban and suburban areas, and activities to control atmospheric pollution. Progress made in each of these categories is detailed below.
Activities to Preserve and Restore Natural Lands
Because of growing population and land development within the Bay watershed, the CBP focused on land preservation and protection in the thousands of small watersheds within the Bay region. Managing the effects of growth was especially critical because of the vast amount of land that drains into the relatively shallow Bay and the consequences of development and other uses of that land. The CBP strategy relied on three approaches: planting and reforesting streamside buffers, developing plans to better manage existing conditions and new development, and preserving lands and open space (CBP, 2010a).
In 2000, the CBP set a goal of restoring 2,010 miles of streamside forest buffers by 2010 (CBP, 2000), which was achieved 8 years ahead of schedule in 2002 (CBP, 2006). In 2003, the CBP expanded its goal, committing to restore 10,000 miles of riparian forest buffers by 2010 (CBP, 2006). As of August 2008, approximately 6,172 miles of forest buffers had been restored in Maryland, Pennsylvania, and the District of Columbia (CBP, 2010a). In addition, the 2007 Forest Conservation Initiative committed the CBP to accelerating forest restoration and conservation beyond 2010; the CBP agreed to restore 900 miles of forest buffer per year until 70 percent of all streambanks in the watershed have been buffered (CBP, 2007b).
The CBP also set a goal to develop and implement watershed management plans for two-thirds of the total watershed acreage in Maryland, Pennsylvania, Virginia, and the District of Columbia, or 22.7 million acres (9.2 million ha), by 2010. By the end of 2007, the cumulative number of acres in the watershed with plans was 13 million acres (5.3 million ha), putting the CBP at 57 percent of its goal with 3 years remaining (CBP, 2010a).7
_____________________
7 See also http://www.chesapeakebay.net/watershedmanagementplans.aspx
The CBP has permanently preserved more than 7 million acres (2.8 million ha) in the states of Maryland, Pennsylvania, Virginia, and the District of Columbia, representing more than 20 percent of the land area in the Chesapeake Bay watershed (CBP, 2010a). In December 2007, the CBP set a goal to preserve an additional 695,000 acres (281,000 ha) of land by 2020 (CBP, 2007b).
Activities to Control Pollution from Agricultural Lands
The process undertaken by the CBP to reduce the amount of pollution entering the watershed has focused on implementing nutrient reduction practices on agricultural lands, which comprise about 22 percent of the land within the watershed (EPA, 2010a). The relative cost-effectiveness of agricultural nutrient reduction strategies led the CBP to target agricultural best management practices (BMPs) for more than half of the remaining nutrient reductions needed to meet restoration goals (CBP, 2010b).
Agricultural land uses, because of their reliance on nutrient-containing fertilizers and manures, constitute a significant portion of the nonpoint sources of nutrient loads to the Bay (Figures 1-4, 1-7, and 1-8). Agricultural land uses have a long history of BMPs aimed at conserving and protecting the soils on which agricultural commodities are produced and the water resources upon which the production of those commodities rely. These BMPs include activities such as the development and implementation of farm-specific nutrient management plans, the establishment and maintenance of vegetated buffers between agricultural fields and surface water bodies such as rivers, lakes, and streams, and implementation of conservation tillage programs. Many agricultural BMPs are non-structural and need to be practiced every year.
The U.S. Department of Agriculture (USDA) Natural Resources Conservation Service (NRCS) primarily develops the technical standards for these agricultural BMPs and provides some technical and financial assistance to farmers who wish to implement them. The USDA Farm Service Agency (FSA) administers additional funding to support conservation programs. From 2007 to 2010, funding from the NRCS and the FSA for the Environmental Quality Incentives Program (EQIP), the Wetlands Reserve Program (WRP), the Conservation Reserve Program (CRP), and the Wildlife Habitat Improvement Program (WHIP) in the Bay watershed totaled approximately $327 million (J. Winters, EPA, personal communication, 2010), which suggests that BMPs were established on significant agricultural acreage within the six Bay states. Five of the Bay states (Delaware, Maryland, Pennsylvania, Virginia, and West Virginia) have also authorized state-funded agricultural BMP cost-share programs. Despite significant investments in agricultural nutrient and sediment control practices, limited peer reviewed
studies are available to rigorously document the water quality improvements from these practices at a watershed scale (see also Chapter 2).
Activities to Control Pollution in Urban and Suburban Areas
Structural BMPs designed to reduce nutrient loading from the watershed’s urban and suburban areas have seen mixed success, in part because of the need to offset the effects of new growth. The CBP has had significant success in decreasing the amount of nutrients discharged from municipal and industrial wastewater treatment plants (WWTPs). More stringent permitting requirements, put in place in 2005, required the installation of a new generation of nutrient removal technology to further reduce nitrogen and phosphorus discharge. WWTP upgrades have accounted for a large portion of the estimated nutrient reductions in the watershed. As of 2009, 78 percent of the CBP’s wastewater nitrogen reduction goals and 99 percent of its wastewater phosphorus reduction goals have been met (CBP, 2010a). Although the amount of nutrients discharged from WWTPs accounted for a large portion of the estimated nutrient reductions in the watershed, the watershed population continues to grow and with it so does the amount of wastewater to be treated (CBP, 2007a).
The CBP has had less success in addressing and limiting stormwater discharge from urban and suburban developed lands. The rapid rate of population growth and related residential and commercial development combined with the high cost and relatively low nutrient removal efficiencies of land-based BMPs have left the urban/suburban stormwater sector as the only one in the Bay watershed with still-increasing pollutant loads in the year 2009. Thus, “progress” can be deemed negative. Model estimates suggest that from 1985 to 2009, nitrogen loads from urban/suburban sectors (not including wastewater discharges) increased by 3 percent, phosphorus by 7 percent, and sediment by 4 percent (EPA, 2010a).
Many strategies have been proposed to promote infiltration and reduce the nutrient and sediment loads in urban and suburban areas, including low impact development (LID), alternative stormwater management techniques (e.g., narrower streets, use of pervious materials for driveways, rain gardens, sunken medians), higher density development with less reliance upon septic systems, and greater open space conservation (Boesch and Greer, 2003; NRC, 2008). BMP technologies for developed land are typically structural approaches applied to multiple point locations or across the landscape to remove dilute pollution distributed over many small source or catchment areas. This treatment is much less efficient than treatment of concentrated municipal and industrial discharges and, as a result, is usually much more costly per pound of pollutant removed. However, most urban BMPs are expected to perform for many years without major maintenance
costs. Stormwater management practices are most effective when included in planning for new development. LID retrofits can also be introduced into existing developed areas, although land costs and availability and BMP installation present significant challenges. Unlike agricultural practices, urban BMPs are often required under state regulations or local permits and are rarely cost-shared. As with agricultural practices, limited information exists to reliably document the performance and long-term cost-effectiveness of urban BMPs, particularly at a watershed scale.
Activities to Control Atmospheric Pollution
The atmosphere is a significant source of nitrogen to the Bay and its watershed because of the deposition of oxidized reactive nitrogen (NOy) and reduced nitrogen (NHx) resulting from NOx and NH3 emissions in the Bay’s airshed. The airshed for NOy and NHx is significantly larger than the watershed and extends west to the Ohio Valley and south to South Carolina (Figure 1-9).
The CBP has benefited from the designation of NO2 as a regulated criteria pollutant by the EPA in 1970 and has therefore been a target for NOx emission decreases for more than forty years. These actions have led to reductions in the deposition of nitrogen oxides to the Chesapeake Bay and its watershed based on national air pollution control efforts. More specifically, the Clean Air Act of 1970 and the Clean Air Act Amendments of 1990 have resulted in significant decreases in the emissions of NOx in the United States. For example, in 1985, NOx emissions were 16 billion pounds nitrogen per year (N/yr; 7.1 teragrams [Tg] N/yr). By 2008, they had decreased to 9.9 billion pounds N/yr (4.5 Tg N/yr), even though the U.S. population had increased by approximately 30 percent during the same period. As a consequence, the per capita NOx emissions in 2008 were 16.5 tons (15 metric tons) N/yr, in contrast to 33 tons (30 metric tons) N/yr in 1985.
This decrease in national NOx emissions has resulted in a decrease in NOy deposition to the Bay and its watershed (Figure 1-10). An equivalent program for ammonia has not been implemented because the EPA has not listed ammonia as a criteria pollutant. As a consequence, NHx deposition increased between 1994 and 2009, as illustrated in Figure 1-11. As of 2009, the CBP had met less than 10 percent of its total air deposition reduction implementation goal (CBP, 2010a).
Results to Date
The CBP monitors changes in nitrogen, phosphorus, and sediment concentrations and loadings to the Bay and observed changes in the Bay’s
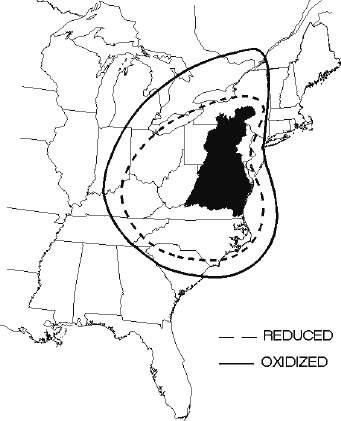
FIGURE 1-9 Chesapeake Bay watershed (shaded area) and reduced and oxidized nitrogen airshed.
SOURCE: EPA (2010a).
water quality and living resources and annually reports them in the Bay Barometer (CBP, 2009a, 2010a). The data are derived from the CBP’s monitoring program to support assessment and evaluation of progress toward achieving Bay recovery. These data are also supplemented with modeling results to clarify trends amidst hydrologic variability.
Nutrient and Sediment Loading
From 1990 to 2009, the average annual nitrogen load reaching the Bay was estimated (based largely on direct measurements) to be 338 million pounds (153 million kg), which is 163 million pounds (74 million kg) higher than the 10-year average load target established in 2003 (Figure 1-2; EPA, 2003). The 1990-2009 average annual phosphorus load (also based on direct measurements) was estimated to be 21.0 million pounds (9.5 million kg), which is 8.2 million pounds (3.7 million kg) higher than the 10-year average load target (Figure 1-2). The 1990-2009 average annual sediment load was estimated from direct measurements to be 8.0 billion
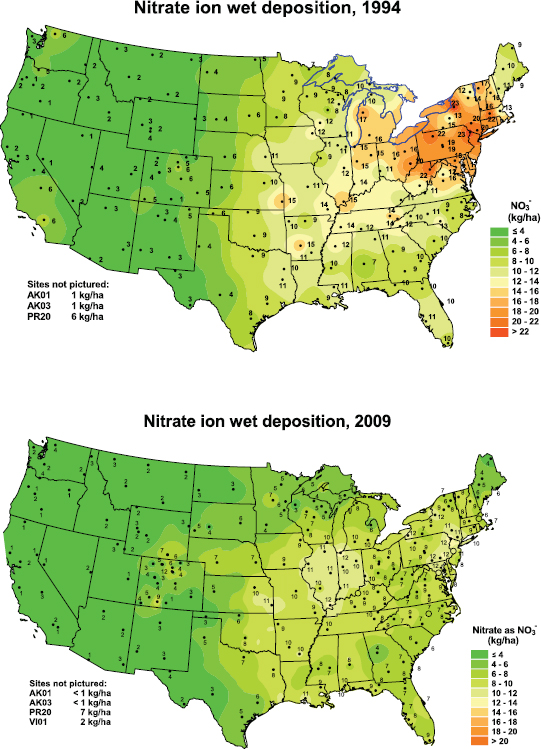
FIGURE 1-10 Nitrate ion wet deposition, 1994 and 2009.
SOURCE: National Atmospheric Deposition Program/National Trend Network. Available at http://nadp.uiuc.edu, accessed December 2010.
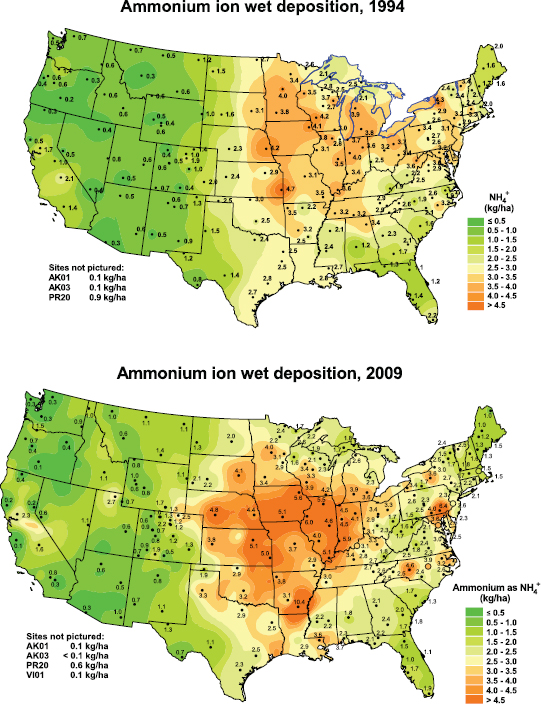
FIGURE 1-11 Ammonium ion wet deposition, 1994 and 2009.
SOURCE: National Atmospheric Deposition Program/National Trend Network. Available at http://nadp.uiuc.edu, accessed December 2010.
pounds (3.6 billion kg) (CBP, 2010a), or 1.55 billion pounds (700 million kg) higher than the TMDL (EPA, 2010a).8 River flow strongly influences the nitrogen, phosphorus, and sediment loads to the Bay, sometimes confounding trends (CBP, 2010a).
Hirsch et al. (2010) presented trend analyses for nitrogen and phosphorus based on 31 years of monitoring data in the 9 large tributaries to the Chesapeake Bay. Surface water concentrations were analyzed using weighted regressions to flow-normalize flux measurements. Over the period of record, greater than 1 percent per year decreases in phosphorus and nitrogen (nitrate plus nitrite) flux were observed for the Patuxent River site (see Figure 1-12a), which is located downstream from wastewater treatment plants that were upgraded starting in the late 1980s. Since 2000, four sites (Patuxent, Potomac, Pamunkey, and Appomatox) showed greater than 1 percent per year decreases in nitrogen flux and only one site (Potomac) showed a similar decrease in phosphorus. Since 2000, greater than 1 percent increases per year in nitrogen and phosphorus flux were observed in two sites (James, Choptank) and five sites (James, Choptank, Susquehanna, Rappahannock, Pamunkey), respectively. Hirsch et al. (2010) analyzed the Choptank River trends in detail and observed that the steeper increase over time in low-flow stream concentrations (see Figure 1-12b) suggest that much of the increase in nitrogen results from increasing nitrate and nitrite in groundwater.
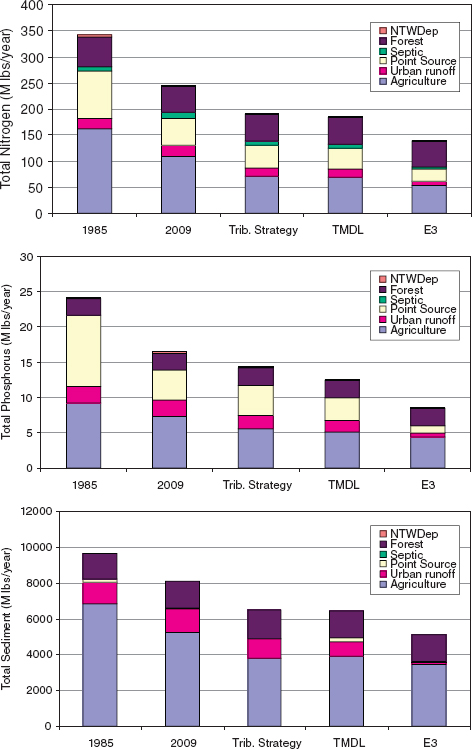
Average nutrient and sediment loads to the Chesapeake Bay from the Phase 5.3 Watershed Model (Figure 1-13 a,b,c; Appendix A) show appreciable reductions between 1985 and 2009 when the land use scenarios for each year are modeled over 21 years of climate and hydrologic data, thereby controlling key parameters that affect nutrient and sediment loads. However, the model simulations show that significant reductions are still needed to meet the CBP goals. According to the model, BMPs implemented between 1985 and 2009 accomplished 62 percent of the nitrogen goal, 66 percent of the phosphorus goal, and 49 percent of the sediment goal, based on the TMDL.
Condition of the Bay’s Resources
Despite expenditures of about $15 billion for restoration activities, reports of record-sized hypoxia zones in 2003 and 2005 raised public concerns about whether progress was really being made in the Chesapeake Bay (Boesch et al., 2007). The Bay Barometer (CBP, 2010a) reported: “Although there were improvements in some areas of the Bay’s health in
_____________________
8 The CBP did not set sediment-specific load targets in 2003 because of an incomplete understanding of sediment sources and their impacts to the Bay (EPA, 2003).
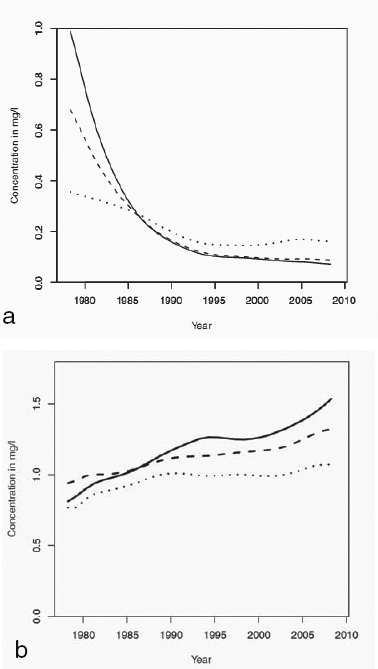
FIGURE 1-12 a) Estimated concentration of total phosphorus on May 1 each year on the Patuxent River near Bowie, Maryland, evaluated for discharge values of 180 cubic feet per second (cfs; or 5 m3/sec; solid), 320 cfs (9 m3/sec; dashed), and 1100 cfs (30 m3/sec; dotted) based on weighted regressions of monitoring data. b) Estimated concentration of dissolved nitrate plus nitrite on April 1 of each year in the Choptank River near Greensboro, Maryland, evaluated for discharge values of 53 cfs (1.5 m3/sec; solid line), 250 cfs (7 m3/sec; dashed line), and 490 cfs (14 m3/sec; dotted line).
SOURCE: Hirsch et al. (2010).
2009, the ecosystem remains in poor condition.” The overall health of the Bay averaged 45 percent based on goals for water quality, habitats and lower food web, and fish and shellfish abundance, which represents a 6 percentage point improvement from 2008. Only 12 percent of the Bay and its tidal tributaries met applicable water quality criteria for dissolved oxygen between 2007-2009, a decrease of 5 percentage points from 2006-2008. An estimated 26 percent of tidal waters met or exceeded guidelines for water clarity, a 12 percentage point increase from 2008. Finally, underwater grasses covered 9,000 more acres (3,600 ha) of the Bay’s shallows for a total of 85,900 acres (34,800 ha), which equals 46 percent of the Bay-wide goal (CBP, 2010a; Table 1-2).
Some improvements were noted. The index for the health of the Bay’s bottom-dwelling species reached a record high of 56 percent of the goal, improving by approximately 15 percentage points Bay-wide. The adult blue crab population increased to 223 million in 2009, its highest level since 1993 (CBP, 2010a). The 2010 Bay-Wide Blue Crab Winter Dredge Survey indicated that blue crab populations continued to increase to an estimated 658 million, the highest population since 1997, as a result of recent multi-jurisdiction restrictions on harvests of female crab (MD DNR, 2010a).
In addition, there have been measured improvements in some subsections of the Bay and tidal rivers. Ruhl and Rybicki (2010) reported that, although efforts to restore the Bay are often viewed as failing, reduced in-situ nutrients, wastewater treatment effluent nitrogen, and total suspended solids were significantly correlated to increased abundance and diversity of underwater grasses in the Potomac River. Based on aerial observations of the Potomac River area over an 18-year period, Ruhl and Rybicki (2010) concluded that estimates of underwater grasses in the Potomac River recently approximate the historical extent.
In the Upper Patuxent River, improvements in wastewater treatment plants in the late 1980s and 1990s led to reductions of phosphorus and then nitrogen loads to the freshwater section of the river (Boynton et al., 2008; see Figure 1-12). In 1993, freshwater underwater grasses were first reported in the mainstem Upper Patuxent River and rapidly became established in the fringing shoals of the river (Orth et al., 2010).
Overall, despite concerted efforts by the Bay jurisdictions and numerous federal agencies, some improvements in localized measures of ecosystem health, and model estimates that total nitrogen and phosphorus loadings have been reduced since 1985 by about 29 percent and 32 percent, respectively, the CBP remains far from its goals. The Bay continues to have poor water quality, degraded habitats, and low populations of many species of fish and shellfish (CBP, 2010a; EPA, 2010a).
RECENT INITIATIVES (2008-2010)
Recognition that the CBP would again fail to meet its goals set in the 2000 Agreement (CBP, 2000), combined with a highly critical review by the Government Accountability Office (GAO, 2005), led to a renewed focus on accountability and tracking of progress in the restoration process. In its 2005 report, GAO stated:
The Bay Program does not have a comprehensive, coordinated implementation strategy to better enable it to achieve the goals outlined in Chesapeake 2000. Although the program has adopted ten key commitments to focus partners’ efforts and developed plans to achieve them, some of these plans are inconsistent with each other or are perceived as unachievable by program partners.
In addition, the GAO questioned the effectiveness and credibility of the CBP’s annual progress reports, which had not clearly distinguished monitoring results from model projections. To address these concerns, the CBP developed the Chesapeake Action Plan (CAP), which was intended to enhance coordination and engagement among CBP partners, increase the CBP’s transparency, and heighten the CBP’s accountability (CBP, 2008).
The Obama administration injected new energy into Bay restoration efforts. On May 12, 2009, President Obama released an executive order directing the federal government to lead restoration efforts and the EPA
FIGURE 1-13 Average annual (a) total nitrogen loading, (b) total phosphorus loading, and (c) total sediment loading (in million lbs/yr) delivered to Chesapeake Bay as estimated in five scenarios of the Phase 5.3 Watershed Model (see Table 1-1).
SOURCE: S. Ravi, CBPO, personal communication, 2011.
NOTES: The scenarios are modeled using the same hydrologic conditions (1985-2005) and changing land use, point source, and BMP conditions. The scenarios include 1985 baseline conditions, 2009 progress, the tributary strategy (TS) goals based on the cap loads set in 2003, total maximum daily load (TMDL), and maximum feasible reduction (E3) scenarios. The E3 scenario is a “what if” scenario of watershed conditions with theoretical maximum levels of managed controls on load sources (“everything, by everyone, everywhere”), with no cost and few physical limitations to implementing BMPs for point and nonpoint sources. Source sectors include agriculture, urban runoff, point sources (including wastewater), septic systems, forested lands, and non-tidal waters atmospheric deposition (NTW Dep). Note that in these bar graphs, atmospheric deposition is considered separately only when it falls directly on non-tidal waters; otherwise, the source is attributed to the land-use type on which the deposition falls. The data are also provided in Appendix A.
to coordinate efforts with several federal agencies, in collaboration with state governments, to reduce pollutants flowing into the Bay (Executive Order 13508). In response, by November 2009, federal CBP partners had completed reports that outlined a new state and federal accountability framework and actions to reduce pollution and improve compliance (DOD, 2009; DOI, 2009; DOI and DOC, 2009a,b,c; EPA, 2009; USDA, 2009).
Chesapeake Bay Total Maximum Daily Load (TMDL)
A TMDL, or total maximum daily load, is defined as the maximum allowable load of a pollutant that a water body can receive while still meeting its water quality standard. Under President Obama’s executive order, the EPA Administrator was charged with developing a management plan to address the negative consequences of nutrient and sediment loading into the Chesapeake Bay. Under the lead of EPA Region III, a multistate TMDL analysis was conducted. The Bay jurisdictions produced watershed implementation plans (WIPs) in support of the TMDL. The EPA established the final TMDL in December 2010.
The EPA established the Chesapeake Bay TMDL in response to a number of existing authorities, including the CWA, several judicial consent decrees, a settlement agreement resolving litigation brought by the Chesapeake Bay Foundation, the 2000 Agreement, and Executive Order 13508. The TMDL’s executive summary identifies the effort as “…a ‘pollution diet’ that will compel sweeping actions to restore the Chesapeake Bay and its vast network of streams, creeks and rivers” (EPA, 2010a). Further, the TMDL addresses three pollutants—nitrogen, phosphorus, and sediment—related to dissolved oxygen and water clarity standards necessary to restore the Bay ecosystem. The TMDL articulates the following expectation: “The TMDL is designed to ensure that all pollution control measures to fully restore the Bay and its tidal rivers are in place by 2025, with 60 percent of the actions completed by 2017” (EPA, 2010a).
The TMDL stipulates Bay watershed load limits of 185.9 million pounds (85.3 million kg) of nitrogen, 12.5 million pounds (5.67 million kg) of phosphorus, and 6.45 billion pounds (2.93 billion kg) of sediment per year based on average hydrologic conditions during the 1985-2005 period. These loads represent a 24 percent reduction in nitrogen and phosphorus and a 20 percent reduction in sediment from the model-simulated loads based on 2009 land use conditions (EPA, 2010a). These loads are allocated among the seven Bay jurisdictions. The overall TMDL nutrient and sediment reduction goals reflect relatively small modifications to the cap load goals set in 2003 (EPA, 2003). The TMDL supports the CBP’s goal of removing the Bay from the EPA’s list of impaired waters.
The Bay TMDL covers a larger area than any other U.S. TMDL.
Although EPA lists over 4,700 nutrient TMDLs nationwide that have been established since October 1995, relatively few address estuaries.9 However, the Chesapeake Bay TMDL is within the range of reductions (by percentage) for several other estuaries, including the nutrient TMDL for New York and Connecticut’s Long Island Sound (58.5 percent reduction in nitrogen discharges from the adjusted 1990 baseline load; NYS DEC and CT DEP, 2000), the Caloosahatchee Estuary in Florida (23 percent reduction in total nitrogen loading; Bailey et al., 2009) and Newport Bay in California (50 percent reduction from current nutrient and sediment loadings; EPA, 2002).
Watershed implementation plans (WIPs), developed by the seven Bay jurisdictions, define how and when they will meet their nitrogen, phosphorus, and sediment load allocations. The EPA will evaluate WIP implementation and the Bay jurisdictions’ progress toward meeting their two-year milestones (described in the next section). If implementation progress is insufficient, the EPA can take appropriate “backstop measures” to ensure compliance with the TMDL. Backstop measures can include targeted enforcement actions on regulated sources, expansion of requirements to obtain discharge permits for currently unregulated sources, or additional reductions from federally permitted sources of pollution (e.g., wastewater treatment plants, large animal operations, municipal stormwater systems) (EPA, 2010a).
The Bay jurisdictions will submit draft Phase II WIPs that provide local area nutrient allocations on a smaller scale by December 2011. Phase II WIPs are expected to include roles for local governments and municipalities, especially for managing nutrient loading from urban and suburban areas (EPA, 2010a).
Two-Year Milestones
To accelerate progress and increase accountability in the Bay restoration, the CBP introduced a two-year milestone strategy for nutrient load reductions in May 2009. In the past, Bay recovery goals involved decadal increments and did not identify specific strategies for achieving the necessary pollution reductions. The prior decadal goals were characterized as “ladder[s] without rungs” (CBP, 2009b). In addition, elected officials were not held accountable for attaining the goals because the timeframes for achieving them often extended beyond their terms of office. As a result, progress was sluggish, and major goals were not met (CBP, 2009b). The two-year milestone program introduced a revised strategy aimed at reducing overall pollution in the Bay by focusing on short-term, incremental implementation goals. The CBP envisioned that through a series of two-
_____________________
year milestone periods with routine assessments of the pace of progress, by 2025 the Bay jurisdictions could implement all of the nutrient and sediment control practices needed for a restored Bay, although actual Bay water quality response and recovery likely will lag behind the 2025 implementation target.
The two-year milestone strategy required each Bay jurisdiction to commit to an initial suite of actions in the first milestone period to be completed by December 31, 2011. The jurisdictions identified specific actions, including application of land-based BMPs and wastewater treatment facility upgrades, anticipated to keep them on track to meet the long-term implementation goals by 2025. Each Bay jurisdiction also identified contingency actions that could be taken if some of the primary nutrient reduction practices could not be implemented in this timeframe. The CBP aims ultimately to reduce nitrogen and phosphorus loading in the watershed by 15.8 million pounds (7.2 million kg) and 1.1 million pounds (500 thousand kg), respectively, by actions completed during the first milestone (CBP, 2009b). If all proposed actions are implemented, the first milestone actions are anticipated to ultimately provide about 21 percent of the nitrogen load reduction and 22 percent of the phosphorus load reduction needed to meet the Tributary Strategy cap loads (Table 1-5). See Box 1-5 for a Bay-wide summary of the first milestone actions. Reductions for nitrogen and phosphorus in the first milestone period are shown by sector in Figure 1-14.
No sediment milestone was set for the first milestone period (2009-2011) because of uncertainties in the overall sediment target at the time, although sediment milestones are expected to be added for the next two-year milestone (2012-2013). Many of the two-year milestone measures to control nutrient loading, however, will also significantly reduce sediment loading.
The Bay jurisdictions are currently developing strategies for the second milestone period. Through tracking and accounting mechanisms (see Chapter 2), the CBP will assess each Bay jurisdiction’s implementation progress toward the two-year milestones. Given lags between land-based BMP implementation and nutrient and sediment reduction in the Bay (see Box 1-3), the CBP primarily assesses progress toward the two-year milestone goals by tracking implementation of practices rather than monitoring nutrient loads in streams.
Integrating Two-Year Milestones, Watershed Implementation
Plans, and the TMDL for Chesapeake Bay
Although the two-year milestones were originally conceived as steps toward meeting the cap load goals, they are now being used as measures of incremental progress toward meeting the TMDL WIP goals for 2017
|
TABLE 1-5 Estimated Contribution of the First Milestone Toward Reductions to Meet Tributary Strategy Cap Loads |
|||||
| Model-estimated Average Load based on 2008 Progress Run (million pounds per year) | Tributary Strategy Cap to Meet Water Quality Standards (million pounds per year) | Reduction Required by 2025 (million pounds per year) | 2009-2011 Estimated Milestone Reduction (million pounds per year) | Percentage of Load Reduction to meet Tributary Strategy Cap Loads Targeted in First Milestone | |
| Nitrogen | 258.5 | 183.1 | 75.4 | 15.8 | 21.0 |
| Phosphorus | 17.8 | 12.8 | 5.0 | 1.1 | 22.1 |
| Sediment | 9,500 | 8,293 | 1,207 | NA | NA |
NOTES: All load estimates, including the Tributary Strategy cap loads, were developed based on Phase 4.3 of the Chesapeake Bay Watershed Model. The TMDL (EPA, 2010a) was developed using Phase 5.3, and therefore, for consistency, the overarching goals are presented in terms of the Tributary Strategy goals. The original milestone commitments would need to be simulated using the Phase 5.3 Watershed Model to calculate the percentage of the TMDL to be accomplished by the first milestone.
SOURCES: CBP (2009b); K. Antos, CBPO, personal communication, 2011.
BOX 1-5
Best Management Practices to Be Implemented in
First Milestone Period (2009-2011) across the
Chesapeake Bay Watershed
The following best management practices represent the sum of total activities to be implemented under the first milestone period in the Chesapeake Bay watershed.
| Agriculture | |
|
Nutrient Management |
1,082,251 acres |
|
Conservation Tillage |
306,991 acres |
|
Cover Crops |
652,152 acres/year |
|
Pasture Grazing BMPs |
168,800 acres |
|
Streamside Forest Buffers |
39,110 acres |
|
Streamside Grass Buffers |
14,910 acres |
|
Forest Harvesting Practices |
125 acres |
|
Wetland Restoration |
3,809 acres |
|
Land Retirement |
81,676 acres |
|
Tree Planting |
27,965 acres |
|
Carbon Sequestration/Alternative Crops |
25,740 acres |
|
Conservation Plans/SCWQP |
584,648 acres |
|
Animal Waste Management Systems |
1,016 systems |
|
Mortality Composters |
22 systems |
|
Water Control Structures |
25,000 acres |
|
Horse Pasture Management |
300 acres |
|
Non-Urban Stream Restoration |
232,088 feet |
|
Poultry Phytase |
19,626 fewer pounds P |
and 2025. The milestones are intended to improve accountability and allow for adjustments if needed. These issues are discussed in more detail in Chapter 3.
A summary of how the two-year milestone strategy is incorporated into the existing Bay restoration goals and TMDL accountability framework is depicted in Figure 1-15. In the two-year milestones, Bay jurisdictions identify practices to be implemented during every 2 year period until 2025. WIPs present cumulative practice implementation goals for 2017 (Phase 1) and 2025 (Phase 2). The TMDL defines the total load reductions (nitrogen, phosphorus, and sediment) necessary to meet water quality criteria. The ultimate goal is to meet the ecological endpoints associated with a fully restored Bay (extent of underwater grasses, fisheries abundance, and diver-
|
Manure Transport |
131,503 net tons |
|
Dairy Precision Feeding and/or |
291,203 pounds N |
|
Forage Management |
51,264 pounds P |
|
Heavy Use Poultry Area Concrete Pads |
400 farms |
|
Livestock and Poultry Waste Structures |
198 structures |
|
Dairy and Poultry Manure Incorporation Technology |
5,000 acres |
| Wastewater | |
|
1,887,350 pounds nitrogen reduced |
|
|
201,500 pounds phosphorus reduced |
|
| Urban/Suburban | |
|
Urban Stormwater Management |
148,740 acres |
|
Tree Planting |
30 acres |
|
Urban Stream Restoration |
18,656 feet |
|
Erosion and Sediment Control |
62,731 acres |
|
Nutrient Management |
133,000 acres |
|
Wetland Restoration |
350 acres |
|
Abandoned Mine Reclamation |
2,219 acres |
|
Dirt and Gravel Road Erosion |
124,913 feet |
|
Septic Improvements |
27,125 systems |
| Air | |
|
Heavy Truck Anti-Idling Rule |
9.78M hours reduced |
|
NOx Reductions |
56,000 tons |
|
Maryland Healthy Air Act |
305,882 fewer pounds N/year |
SOURCE: CBP (2009b).
sity and other natural resource goals), as defined by the CBP (see Table 1-2). The EPA will review progress toward these two-year milestones, in the context of the TMDL, and will evaluate whether sufficient actions are being planned and undertaken to achieve the necessary pollution reductions (EPA, 2010a).
STATEMENT OF COMMITTEE TASK AND REPORT OVERVIEW
In 2009, the NRC’s Committee on the Evaluation of Chesapeake Bay Program Implementation for Nutrient Reduction to Improve Water Quality was formed to undertake an evaluation of the CBP’s nutrient reduction program and to respond to the GAO (2005) recommendation for indepen-
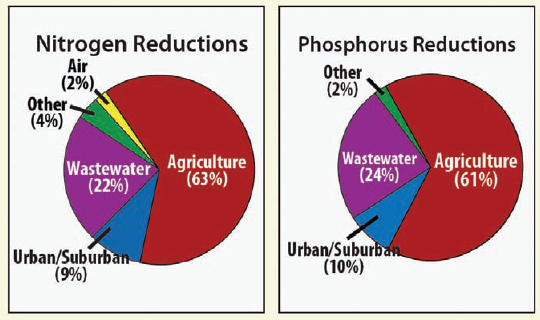
FIGURE 1-14 Percentage of nutrient reductions planned in the first milestone period from agriculture, wastewater, urban/suburban, air, and other sectors.
SOURCE: CBP (2009b).
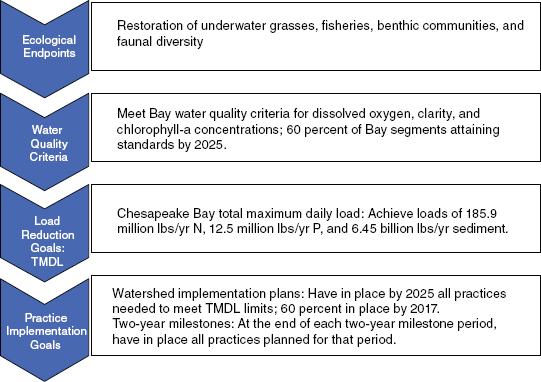
FIGURE 1-15 Integration of the goals and strategies used in the CBP, including two-year milestones and the TMDL accountability framework.
dent review to enhance the credibility and objectivity of its reports. This study was sponsored by the EPA, with additional funding support from the states of Virginia, Maryland, Pennsylvania, and the District of Columbia. The committee was specifically tasked to address the following questions, broken down into two themes:
Evaluation Theme I: Tracking and Accountability
1. Does tracking for implementation of nutrient and sediment point and nonpoint source pollution (including air) best management practices appear to be reliable, accurate, and consistent?
2. What tracking and accounting efforts and systems appear to be working, and not working, within each state (i.e., the six states in the watershed and DC), including federal program implementation and funding? How can the system be strategically improved to address the gaps?
3. How do these gaps and inconsistencies appear to impact reported program results?
Evaluation Theme II: Milestones
4. Is the two-year milestone strategy, and its level of implementation, likely to result in achieving the CBP nutrient and sediment reduction goals for this milestone period?
5. Have each of the states (i.e., the six states in the watershed and DC) and the federal agencies developed appropriate adaptive management strategies to ensure that CBP nutrient and sediment reduction goals will be met?
6. What improvements can be made to the development, implementation, and accounting of the strategies to ensure achieving the goals?
It is important to note, as discussed further in Chapter 2, that the committee charge (particularly Task 4) focuses on implementation of strategies during the two-year milestone period, rather than on actual water quality improvement during this period. Realistically, interannual variability and delayed responses preclude the determination of conclusive relationships between action and water quality improvement for such a short increment of time. Additionally, because there are no milestones for sediment during the first reporting period, which the committee was tasked to analyze, the committee places greater emphasis on issues affecting nutrient loads, although sediment issues are included throughout and have been more recently quantified in the 2010 TMDL.
Although most of the tasks are narrowly focused, the committee took a broad view in its interpretation of Task 6 on what improvements can be made to the development, implementation, and accounting of the strategies
to ensure achieving the goals. The committee considered “the goals” to include the long-term nutrient and sediment reduction goals and subsequent recovery of the Bay ecosystem, not just the first two-year milestone goals. In addition, the committee considered both practices and policies that could improve the likelihood of achieving the goals, because the feasibility of implementing specific practices is often affected by broader policy decisions.
The committee’s conclusions and recommendations are based on a review of relevant technical literature, briefings, and discussions at its four meetings and the experience and knowledge of the committee members in their fields of expertise. Following this brief introduction, the statement of task is addressed in four subsequent chapters of this report:
• In Chapter 2, the committee assesses the tracking and accounting for BMPs and infrastructure upgrades for nutrient and sediment control and identifies key issues facing the Bay jurisdictions and the CBP (Tasks 1, 2, and 3). The committee also identifies ways to improve tracking and accounting procedures.
• In Chapter 3, the committee evaluates the two-year milestone strategy and, based on the information presented, discusses the likelihood of achieving the nutrient reduction goals for the first milestone period (Task 4).
• In Chapter 4, the committee assesses the CBP’s adaptive management approaches (Task 5), and identifies the challenges to and opportunities for using adaptive management to meet nutrient and sediment reduction goals.
• In Chapter 5, the committee describes overarching issues affecting achievement of the nutrient reduction goals (Task 6), and discusses improvements that, if implemented, could enhance the likelihood of achieving the program goals.


