
Appendix A
Army Research Laboratory Organization Chart and Staffing Profile
This appendix presents an organization chart of the Army Research Laboratory (ARL) in Figure A.1 and data on ARL staffing in Table A.1. Table A.1 presents staffing profiles by directorate for the years 2004, 2006, 2008, and 2010.
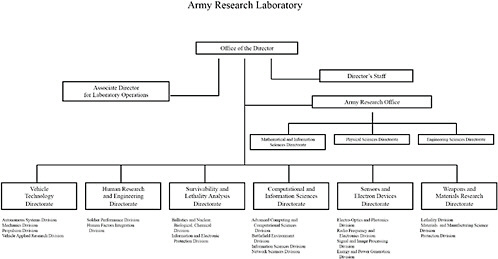
TABLE A.1 Army Research Laboratory Staffing Profiles, by Directorate, for the Years 2004, 2006, 2008, and 2010
|
Staffing Information |
Number [%] |
||||||
|
CISD |
HRED |
SEDD |
SLAD |
VTD |
WMRD |
||
|
Total civilian staff |
Dec-04 |
313 |
217 |
376 |
294 |
84 |
403 |
|
Jul-06 |
302 |
208 |
330 |
305 |
73 |
419 |
|
|
Jul-08 |
294 |
186 |
391 |
305 |
73 |
402 |
|
|
Jul-10 |
291 |
168 |
345 |
307 |
65 |
452 |
|
|
Scientists and engineers |
Dec-04 |
200 [64%] |
162 [75%] |
297 [79%] |
236 [80%] |
61 [73%] |
282 [70%] |
|
Jul-06 |
88 [62%] |
149 [72%] |
272 [82%] |
243 [80%] |
50 [68%] |
294 [70%] |
|
|
Jul-08 |
188 [64%] |
137 [74%] |
292 [75%] |
245 [80%] |
51 [70%] |
288 [72%] |
|
|
Jul-10 |
189 [65%] |
136 [81%] |
291 [84%] |
258 [84%] |
54 [83%] |
328 [73%] |
|
|
Technicians |
Dec-04 |
16 [5%] |
11 [5%] |
46 [12%] |
32 [11%] |
11 [13%] |
89 [22%] |
|
Jul-06 |
14 [5%] |
16 [8%] |
28 [9%] |
32 [10%] |
12 [17%] |
89 [21%] |
|
|
Jul-08 |
21 [7%] |
14 [8%] |
65 [17%] |
38 [12%] |
14 [19%] |
85 [21%] |
|
|
Jul-10 |
11 [4%] |
19 [11%] |
22 [6%] |
25 [8%] |
6 [9%] |
82 [19%] |
|
|
Administrative personnel |
Dec-04 |
97 [31%] |
44 [20%] |
33 [9%] |
26 [9%] |
12 [14%] |
32 [8%] |
|
Jul-06 |
100 [33%] |
43 [20%] |
30 [9%] |
30 [10%] |
11 [15%] |
36 [9%] |
|
|
Jul-08 |
85 [29%] |
35 [19%] |
34 [9%] |
22 [7%] |
8 [11%] |
29 [7%] |
|
|
Jul-10 |
91 [31%] |
13 [8%] |
30 [9%] |
24 [8%] |
5 [8%] |
30 [7%] |
|
|
Military personnel |
Dec-04 |
6 |
3 |
4 |
15 |
5 |
5 |
|
Jul-06 |
4 |
5 |
4 |
11 |
2 |
6 |
|
|
Jul-08 |
5 |
6 |
3 |
9 |
3 |
2 |
|
|
Jul-10 |
4 |
2 |
6 |
7 |
3 |
3 |
|
|
Postdoctoral researchers |
Dec-04 |
1 |
1 |
4 |
0 |
1 |
0 |
|
Jul-06 |
0 |
1 |
17 |
0 |
0 |
8 |
|
|
Jul-08 |
2 |
2 |
12 |
0 |
0 |
9 |
|
|
Jul-10 |
4 |
4 |
24 |
0 |
0 |
39 |
|
|
Guest researchers |
Dec-04 |
2 |
3 |
11 |
0 |
0 |
0 |
|
Jul-06 |
36 |
2 |
24 |
0 |
0 |
17 |
|
|
Jul-08 |
12 |
5 |
10 |
0 |
3 |
10 |
|
|
Jul-10 |
9 |
3 |
15 |
0 |
3 |
7 |
|
|
On-site contractors |
Dec-04 |
286 |
1 |
61 |
80 |
0 |
133 |
|
Jul-06 |
260 |
3 |
65 |
123 |
0 |
214 |
|
|
Jul-08 |
242 |
1 |
72 |
77 |
0 |
135 |
|
|
Jul-10 |
286 |
12 |
113 |
106 |
27 |
317 |
|
|
Staffing Information |
Number [%] |
||||||
|
CISD |
HRED |
SEDD |
SLAD |
VTD |
WMRD |
||
|
B.S. or B.A. |
Dec-04 |
80 [40%] |
64 [40%] |
85 [29%] |
136 [58%] |
23 [38%] |
101 [36%] |
|
Jul-06 |
58 [31%] |
35 [23%] |
52 [19%] |
121 [50%] |
9 [18%] |
87 [30%] |
|
|
Jul-08 |
65 [35%] |
40 [29%] |
87 [30%] |
134 [55%] |
23 [45%] |
89 [31%] |
|
|
Jul-10 |
51 [27%] |
27 [20%] |
57 [18%] |
128 [50%] |
12 [22%] |
75 [23%] |
|
|
M.S. or M.A. |
Dec-04 |
69 [35%] |
51 [31%] |
97 [32%] |
78 [33%] |
16 [26%] |
62 [22%] |
|
Jul-06 |
81 [43%] |
68 [46%] |
99 [37%] |
100 [41%] |
21 [42%] |
63 21%]a |
|
|
Jul-08 |
69 [37%] |
41 [30%] |
90 [31%] |
85 [35%] |
11 [22%] |
66 [23%] |
|
|
Jul-10 |
84 [44%] |
57 [42%] |
98 [31%] |
112 [43%] |
18 [33%] |
95 [29%] |
|
|
Ph.D. |
Dec-04 |
51 [25%] |
47 [29%] |
115 [39%] |
22 [9%] |
22 [36%] |
119 [42%] |
|
Jul-06 |
49 [26%] |
46 [31%] |
120 [44%] |
22 [9%] |
20 [40%] |
144 [49%] |
|
|
Jul-08 |
49 [26%] |
50 [36%] |
111 [38%] |
18 [7%] |
16 [31%] |
123 [43%] |
|
|
Jul-10 |
54 [29%] |
50 [37%] |
149 [49%] |
18 [7%] |
24 [44%] |
158 [48%] |
|
|
Under 25 years of age |
Dec-04 |
11 [6%] |
14 [9%] |
8 [3%] |
19 [8%] |
0 [0%] |
8 [3%] |
|
Jul-06 |
5 [3%] |
7 [5%] |
9 [3%] |
12 [5%] |
0 [0%] |
7 [2%] |
|
|
Jul-08 |
6 [3%] |
1 [1%] |
9 [3%] |
11 [4%] |
0 [0%] |
0 [0%] |
|
|
Jul-10 |
4 [2%] |
5 [4%] |
3 [1%] |
4 [2%] |
1 [1%] |
4 [1%] |
|
|
25-35 years of age |
Dec-04 |
19 [10%] |
25 [15%] |
33 [11%] |
18 [8%] |
7 [12%] |
48 [17%] |
|
Jul-06 |
24 [13%] |
25 [17%] |
34 [13%] |
39 [16%] |
6 [8%] |
39 [13%] |
|
|
Jul-08 |
27 [14%] |
24 [18%] |
48 [16%] |
48 [20%] |
5 [10%] |
52 [18%] |
|
|
Jul-10 |
27 [14%] |
26 [19%] |
55 [16%] |
64 [25%] |
11 [17%] |
94 [21%] |
|
|
35-45 years of age |
Dec-04 |
63 [31%] |
36 [22%] |
112 [38%] |
82 [35%] |
28 [46%] |
97 [34%] |
|
Jul-06 |
48 [26%] |
35 [23%] |
87 [32%] |
72 [30%] |
22 [30%] |
98 [33%] |
|
|
Jul-08 |
35 [19%] |
30 [22%] |
60 [21%] |
49 [20%] |
11 [22%] |
75 [26%] |
|
|
Jul-10 |
37 [20%] |
25 [18%] |
60 [17%] |
39 [15%] |
11 [17%] |
105 [23%] |
|
|
45-55 years of age |
Dec-04 |
65 [32%] |
53 [33%] |
81 [27%] |
65 [27%] |
14 [23%] |
74 [26%] |
|
Jul-06 |
65 [35%] |
46 [31%] |
86 [32%] |
76 [31%] |
31 [43%] |
78 [27%] |
|
|
Jul-08 |
73 [39%] |
42 [31%] |
113 [39%] |
100 [41%] |
23 [45%] |
94 [33%] |
|
|
Jul-10 |
81 [43%] |
39 [29%] |
140 [41%] |
101 [39%] |
31 [48%] |
161 [36%] |
|
|
55-65 years of age |
Dec-04 |
36 [18%] |
28 [17%] |
52 [17%] |
42 [18%] |
10 [16%] |
50 [18%] |
|
Jul-06 |
39 [21%] |
30 [20%] |
44 [16%] |
36 [15%] |
13 [18%] |
66 [22%] |
|
|
Jul-08 |
37 [20%] |
31 [23%] |
48 [16%] |
31 [13%] |
11 [22%] |
55 [19%] |
|
|
Jul-10 |
30 [16%] |
35 [26%] |
66 [19%] |
43 [17%] |
7 [11%] |
71 [16%] |
|


