
This chapter describes the hospital wage index (HWI) and addresses key areas of disagreement in how it is constructed. Two important principles guide the ensuing discussion.
First, the HWI is meant to reflect geographic differences in the price and not the cost of labor that each hospital faces within its labor market. The price of labor is indicated by the prevailing wage in each labor market for a given occupation. The cost of labor reflects each hospital’s decisions regarding its occupational mix of employees and compensation packages. By adjusting for differences in the price of labor, rather than cost actually incurred by hospitals, they are held accountable for using labor efficiently. This principle supports the goal of the prospective payment system to pay hospitals in each area an amount that reflects the cost of efficiently providing inpatient care to Medicare beneficiaries.
Second, to reflect the price rather than the cost of labor in each market area, the HWI should capture only those geographic differences in labor expenses that are beyond the control of the individual hospital. The index—and therefore Medicare payment—should not reflect the impact of a hospital’s own business decisions on its wage-related costs.
DETAILS OF THE HOSPITAL WAGE INDEX
The HWI was first implemented in 1983 as part of the Inpatient Prospective Payment System (IPPS), when Medicare moved away from cost-based payment and began to pay hospitals a set amount for each group of patients who are clinically similar. The intent was to encourage hospitals to operate more efficiently and to think of care in terms of the hospital stay rather than each day of care, procedure, or service provided. The goal of the wage index is to adjust prospective payment rates to account for local differences in the wages that hospitals face in their respective labor markets. Wages account for about two-thirds of total costs, so the HWI is applied to a similar portion of the payment rate for hospitals in each geographic area.
The wage index is part of the overall formula used to pay short-term general hospitals under IPPS for the care that they provide to patients insured by Medicare. The formula is illustrated
in Figure 1-1. In summary, the payment for each patient is determined by making adjustments to a national standard payment rate to account for patient and hospital characteristics, including hospital location, that are thought to affect the cost of efficiently provided inpatient care. Patient characteristics are accounted for by the case mix adjustment. Each patient is assigned to one of 747 Medicare Severity-Diagnosis Related Groups (MS-DRGs). Each MS-DRG carries a specific weight, which reflects the relative costliness of patients in that category compared with the average Medicare patient. Hospital location is accounted for by the wage index adjustment. Each hospital is assigned to a labor market: a metropolitan statistical area (MSA) or a statewide non-MSA. Each labor market is assigned a specific index value, which is intended to reflect the variation in prevailing wage levels across labor markets.
In addition to these adjustments to the standard payment rate, separate amounts are added to fulfill certain public policy goals. These policy adjustments include a percent add-on to Medicare payments for teaching hospitals and for hospitals that serve a disproportionate number of low-income patients. Extra payments are also made to reimburse hospitals for the cost of using certain expensive new technologies and to protect against the risk of large financial losses associated with treating atypically high-cost patients. A reduction is made if the hospital transfers a patient earlier than usual to another hospital or a post-acute care setting (such as a skilled nursing facility). Table 3-1 illustrates the calculation of the wage index and shows the effects of each adjustment, including the wage index, on payments to hospitals in four different geographic areas.
Other payment supports apply to hospitals in nonmetropolitan areas. Rural referral centers1 (RRCs) receive payments for inpatient care equal to what hospitals in metropolitan areas would receive for furnishing the same services (42 CFR 412.96). Sole community hospitals2 (SCHs) receive the IPPS federal rate, or the updated hospital-specific rate based on fiscal years 1982, 1987, 1996, or 2006 per discharge—whichever is highest (CMS, 2011). Finally, critical access hospitals3 (CAHs) are small rural facilities that are not paid under the IPPS system; rather, Medicare pays 101 percent of their costs on a per-patient basis (MedPAC, 2007b).
Figure 3-1 shows how different wage indexes affect payment for the same type of patient at hospitals in four different areas.
The wage index adjustment is currently computed as the average hourly wage (AHW) paid by all IPPS hospitals in each labor market area divided by the AHW for all IPPS hospitals nationwide. The data come from Worksheet S-3 (see Appendix H) of the cost reports that hospitals are required to submit annually to the Centers for Medicare and Medicaid Services (CMS). The index is updated each year on the basis of the latest available complete set of data, after review and verification or correction of any questionable data. Constructing the HWI requires three basic steps:
___________
1 A facility qualifies as an RRC if it is located in a rural area and has a minimum of 275 beds. At least 50 percent of RRC Medicare patients are referred by another hospital or physician, and at least 60 percent of those patients live more than 25 miles away.
2 A facility qualifies as an SCH if it is the only entity that can make inpatient services “reasonably available” to a given population due to isolation, geographic barriers, weather, or distance (the hospital is at least 35 miles away from the next nearest hospital).
3 A facility qualifies as a CAH if it has a maximum of 25 beds dedicated to acute care patients, up to 10 beds for psychiatric care, and 10 beds for rehabilitation. A CAH is at least 15 miles by secondary road, or 35 miles by main road, from the nearest hospital, or it is deemed a “necessary provider.”
TABLE 3-1 Effect of FY 2011 Wage Index on Payments to Hospitals in Four Geographic Areas
| Palo Alto, CA Stanford Hospitala 416 IPPS beds Case Mix Index = 2.09 |
Atlanta, GA Emory University Hospital 506 IPPS beds Case Mix Index = 2.40 |
Columbia, MO University of Missouri Hospital 307 IPPS beds Case Mix Index = 2.04 |
Enterprise, AL Medical Center Enterprise 117 IPPS beds Case Mix Index = 1.07 |
||
|
National Standardized Amountb |
$5,164.11 | $5,164.11 | $5,164.11 | $5,164.11 | |
|
x Labor-related percent |
68.8% | 62.0% | 62.0% | 62.0% | |
|
= Labor-related portion |
$3,552.91 | $3,201.75 | $3,201.75 | $3,201.75 | |
|
x Wage index |
1.6379 | 0.9522 | 0.8227 | 0.7436 | |
|
= Labor-adjusted portion |
$5,819.31 | $3,048.70 | $2,634.08 | $2,380.82 | |
|
+ Non-labor related portion |
$1,611.20 | $1,962.36 | $1,962.36 | $1,962.36 | |
|
= Labor-adjusted standardized amount |
$7,430.51 | $5,011.07 | $4,596.44 | $4,343.18 | |
|
IME & DSH Add-onsc |
$3,454.15 | $1,528.22 | $2,343.49 | $255.34 | |
|
Operating Payment Amount, MS-DRG wt = 1.000 |
$10,884.66 | $6,539.29 | $6,939.94 | $4,598.52 | |
| Example: Stroke with Complication or Comorbidity (CC) | |||||
|
MS-DRG 065 |
$12,699.13 | $7,629.39 | $8,096.82 | $5,365.09 | |
| Example: CABG with Major Complication or Comorbidity (MCC) | |||||
|
MS-DRG 233 |
$78,457.69 | $47,135.87 | $50,023.75 | Not available | |
NOTE: CABG = coronary artery bypass graft; IPPS = Inpatient Prospective Payment System; MS-DRG = Medical Severity-Diagnosis Related Groups.
a Most hospitals in this market, including Stanford, are reclassified to the Santa Cruz/Watsonville area. The Stanford index reflects the reclassified value.
b Amounts are for the operating portion of payment. The capital portion of payment is not reflected.
c Indirect medical education (IME) adjustments provide an increase in Medicare payment to teaching hospitals. Disproportionate share hospital (DSH) adjustments provide an increase in Medicare payment to hospitals that serve a disproportionate share of low-income patients.
SOURCE: RTI Analysis of IPPS impact file and MS-DRG weight file, FY 2011.
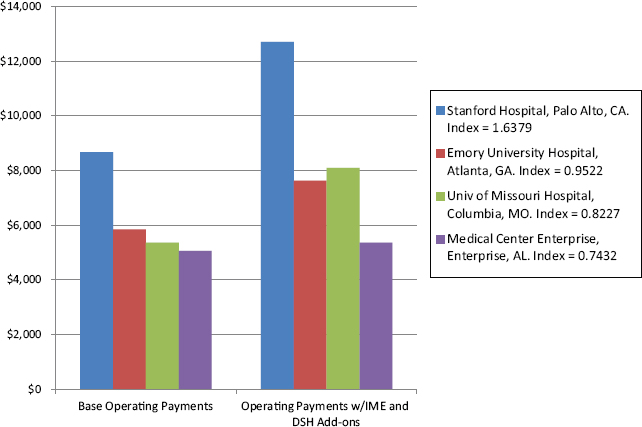
FIGURE 3-1 Payments for stroke admission by hospital.
NOTE: Stanford hospital receives higher payments because its wage index is greater than 1. When an index is equal to or greater than 1, it is adjusted 69.7 percent for area wages. An index that is less than 1 is adjusted 62 percent for area wages. DSH = disproportionate share hospital; IME = indirect medical education.
SOURCE: RTI analysis of CMS FY 2011 IPPS Final Rules.
- Identify the data source from which to derive a measure of the prices for each input. To a large extent, the data determine the options available in the next two steps;
- Define the inputs that will be included in the index; and
- Establish a set of weights to assign relative importance to each input to the index.
Although the steps may seem straightforward, the data, inputs, and weights used for the HWI have been a source of continuing disagreement among stakeholders and policy makers. Small changes in any of the components of the index can have major effects on how payments are distributed.
The inputs to the HWI consist of the dollar-valued wages and benefits of full-time, part-time, and contract workers.4 The AHW is computed as if all hospitals use a fixed mix of hours for each of the major occupations in the hospital industry. The mix of hours assigned to each occupation comprises the weight for each occupation. The weights are used to make the occupational mix
___________
4 Contract workers include nurses, executive management, and other employees working under contract between an agency and a hospital.
adjustment (OMA) to the wage index. It is useful to remember that the OMA is an adjustment to the wage index and that the wage index is an adjustment to the Medicare payment. This is explained further in Box 3-1. As discussed in more detail below, the OMA is needed to even out hospital decisions about how many workers in each occupation to use. The fixed mix of hours used as the standard for each occupation is determined by averaging the number of hours of the occupation that are used by all hospitals in the country.
Currently, CMS uses four occupations to construct the OMA: registered nurses (RNs); licensed practical nurses (LPNs); medical technologists; and nursing aides, orderlies, and attendants. These occupations make up 42.5 percent of hospital workers nationally (CMS, 2010).
BOX 3-1
Mechanics of the Hospital Wage Index with the Occupational Mix Adjustment
Computing the hospital wage index involves a series of steps that use simple multiplication, addition, and division. For ease of explanation, the steps below present the calculation of the wage index from the point of view of a single hypothetical hospital named Clark General Hospital.
Step 1: Determine the proportion of nurses by subcategory (registered nurses; licensed practical nurses [LPNs]; nursing aides, orderlies and attendants; and medical assistants) who are employed by Clark General Hospital.
Start with the LPN subcategory. Divide the LPN hours by the total nursing category hours. Repeat for the other three subcategories of nurses employed by Clark General Hospital.
Every other Inpatient Prospective Payment System (IPPS) hospital does the same
Step 2: Calculate the national average hourly wage (AHW) for each nursing subcategory in all hospitals included in the occupational mix survey database.
Start with the LPN subcategory. Divide the total LPN salaries for all hospitals by the LPN total hours for all hospitals. Repeat this calculation for the other three subcategories of nurses.
Step 3: Calculate Clark General Hospital’s AHW for nursing, weighted by the percentage of hours attributable to each nursing subcategory in all hospitals included in the occupational mix survey database.
Start with the LPN subcategory at Clark General Hospital. Multiply the hours for all LPNs at Clark by the national AHW for LPNs. Do this for the other three subcategories of nurses at Clark. Then sum the weighted AHW for each subcategory to get a weighted AHW for all of nursing at Clark.
Every other IPPS hospital does the same calculation.
Step 4: Calculate the national AHW for nursing, weighted by the percentage of hours attributable to each nursing subcategory in all hospitals included in the occupational mix survey database.
Again, start with the LPN subcategory, but this time the calculation is for all the hospitals in the United States. Multiply the hours for all LPNs in the country by the national AHW for all LPNs in the country. Do the same for the other three subcategories of nursing. Then sum the weighted AHW for each subcategory to get a weighted AHW for all of nursing in the country.
Step 5: Calculate Clark General Hospital’s occupational mix adjustment factor.
Divide the national weighted AHW (from Step 4) by Clark’s AHW (Step 3). If Clark General Hospital’s weighted AHW is less than the weighted national AHW, that means that Clark uses a less expensive mix of nursing employees. Its occupational mix adjustment factor will be greater than 1. If Clark General Hospital’s weighted AHW is greater than the weighted national AHW, that means that Clark uses a more expensive mix of nursing employees. Its occupational mix adjustment factor will be less than 1.
Do this for every other IPPS hospital in the country.
Step 6: Calculate Clark General Hospital’s occupational mix—adjusted salaries and wage-related costs for the total nursing category.
Divide Clark General Hospital’s total nursing category salaries by the total salaries for “nursing and all other” employee categories to determine the percentage of hospital staff attributable to the nursing category. Multiply Clark Generals Hospital’s total salaries and wage-related costs by the percentage of the hospital’s total number of workers attributable to the total nursing category and by the total nursing category’s occupational mix adjustment factor (from Step 5).
Subtract the hospital’s nursing category percentage from 100 percent to determine the portion of Clark General Hospital’s total salaries and wage-related costs for other employees that are not adjusted for occupational mix.
Step 7: Calculate the total occupational mix-adjusted salaries and wage-related costs for Clark General Hospital.
Sum the occupational-mix adjusted salaries and wage-related costs for the total nursing category (from Step 6) and the hospital’s wage related costs for all other employees.
To compute the hospital’s occupational mix-adjusted AHW, divide the hospital’s total occupational mix-adjusted salaries and wage-related costs by the hospital’s total hours.
SOURCE: Sheps Center, 2006.
No OMA is made to the hours of the remaining 57.5 percent of hospital workers. The data on hours worked by each occupation that are needed for the OMA are not included in the annual cost reports that hospitals submit to CMS. Therefore, CMS must conduct a survey of hospitals—known as the occupational mix survey—to acquire the data necessary to compute the OMA. CMS is required by law, the Tax Relief and Healthcare Act of 2006 (P.L. 109-432), to conduct the survey not less than every 3 years and to update the OMA accordingly.
The intent of the OMA is to more accurately reflect the wages that hospitals face in each area by factoring out the effect of the hospitals’ own decisions about the mix of occupations that they hire. This is important because some hospitals, for one reason or another, choose to employ higher-paid occupations instead of lower-paid occupations. Differences in a hospital’s occupational mix due to the clinical characteristics of the hospital’s patient population are already accounted for by the MS-DRG relative weights that are used to adjust the payment for each case. As described in Chapter 1, MS-DRGs increase payment for sicker patients who require more staff resources relative to patients who are less sick. This adjustment is separate from the adjustment made for geographic differences in hospital wages. (Some states require a specific mix of nurses in hospitals, which could affect index values in a way that is beyond the control of the hospitals in those areas. This issue is discussed below.) Without standardization for occupational mix, the HWI would reflect the costs of hospital decisions to use a broader mix of occupations, raising payments for those hospitals. The application of an OMA to the wage index at least partially controls for the impact of those decisions, so that hospitals in different areas that pay the same wages for nurses have the same wage index, even if they choose to hire different mixes of nursing staff.
IPPS hospitals are free to use whatever mix of occupations they need to treat their patients; the goal of the OMA is to avoid rewarding or penalizing hospitals per se for using a richer occupational mix. The FY 2011 IPPS Final Rule states:
The purpose of the OMA is to control for the effect of hospitals’ employment choices on the wage index. For example, hospitals may choose to employ different combinations of registered nurses, licensed practical nurses, nursing aides, and medical assistants for the purpose of providing nursing care to patients. The varying labor costs associated with these choices reflect hospital management decisions rather than geographic differences in the costs of labor. (CMS, 2010)
The OMA was first applied in FY 2005, after 2 decades of debate, several congressional mandates, and a lawsuit (see Box 3-2). In particular, hospitals in nonmetropolitan areas argued that hospitals in large metropolitan areas used a richer mix of occupations and that the unadjusted wage index rewarded those hospitals with higher payments (Pope et al., 1989; ProPAC, 1990, 1991; Size, 1992).
COMMITTEE ASSESSMENT OF WAGE INDEX ALTERNATIVES
The committee examined potential improvements to each component of the HWI: its data source, inputs, and weighting. Because the wage data used to construct the index drive the choice of inputs and methods of weighting the inputs, the ensuing discussion is organized around the alternative sources of wage data available for construction of the index. These are (1) the current hospital cost report data, combined with the occupational mix survey data, and (2) data from the Bureau of Labor Statistics (BLS) Occupational Employment Statistics (OES).
BOX 3-2
Hospital Wage Index Timeline of Events
1965: The U.S. Congress creates the Medicare and Medicaid Programs in Titles XVIII and XIX of the Social Security Act of 1965.
1975: John D. Thompson of Yale University leads the development of the Diagnoses Related Groups (DRG) system (Mistichelli, 1984).
1977: HCFA (Health Care Financing Administration) is authorized by the U.S. Congress to collect and review hospital cost data (Medicaid Anti-fraud and Abuse Amendments. P.L. 95-142, October 25, 1977).
1982: The U.S. Congress requires HCFA to develop a prospective payment system (Tax Equity and Fiscal Responsibility Act. P.L. 97-248, September 3, 1932).
1983: Medicare establishes the hospital wage index (HWI) using Bureau of Labor Statistics (BLS) data to control costs (Social Security Amendments of 1983. P.L. 98-21, April 20, 1983).
1984: HCFA develops and conducts the first Wage Index Survey of hospitals (Deficit Reduction Act of 1984. P.L. 98-369, July 18, 1984).
1987: The U.S. Congress authorizes the Secretary of the U.S. Department of Health and Services (HHS) to reclassify some nonmetropolitan counties as metropolitan counties to reduce variation in wages among neighboring hospitals. These exceptions are known as “Lugar Counties” (Omnibus Budget Reconciliation Act of 1987. P.L. 100-203, December 22, 1987).
1988: The U.S. Congress requires that wage indexes for Lugar counties must be calculated separately from all other hospitals to prevent a decline in the indexes of neighboring areas (Technical and Miscellaneous Revenue Act of 1988. P.L. 100-647, November 10, 1988).
1989: The U.S. Congress requires an annual update of the HWI to ensure accuracy (Omnibus Budget Reconciliation Act of 1989. P.L. 101-239, December 19, 1989).
1989: The U.S. Congress grants the Medicare Geographic Classification Review Board authority to reclassify hospitals to different payment regions (Omnibus Budget Reconciliation Act of 1989. P.L. 101-239, December 19, 1989).
1990: Annual hospital surveys are included in the cost reports (Dalton et al., 2002).
1993: The Prospective Payment Assessment Commission (ProPAC) recommends redefining hospital labor market areas on the basis of the nearest-neighbor principle rather than geo-political boundaries, such as counties and states (Dalton et al., 2002).
1996: ProPAC reports that hospitals in nonmetropolitan areas receive significantly less in Medicare payments than hospitals in metropolitan areas (Dalton et al., 2002).
1997: The U.S. Congress applies the HWI to hospital outpatient services, home health agencies, skilled nursing facilities, impatient psychiatric facilities, inpatient rehabilitation facilities, and long-term acute care hospitals (The Balanced Budget Act of 1997. P.L. 105-33, August 5, 1997).
1997: The U.S. Congress establishes rural floors, so that urban hospitals must be paid at least as much as rural hospitals (The Balanced Budget Act of 1997. P.L. 105-33, August 5, 1997).
1999: The U.S. Congress reclassifies some metropolitan hospitals as nonmetropolitan hospitals, if they meet criteria defined by the Secretary of HHS (Balanced Budget Refinement Act of 1999. P.L. 106-113, November 26, 1999).
2000: The U.S. Congress requires the Centers for Medicare and Medicaid Services (CMS) to account for a hospital’s occupational mix when adjusting the wage index, and gather data at least every 3 years (Medicare, Medicaid, and SCHIP Benefits Improvement and Protection Act of 2000. P.L. 106-554, October 30, 2000).a
2003: CMS grants reclassifications for 3 years, instead of 1 year (Medicare Prescription Drug, Improvement and Modernization Act. P.L. 108-17, December 8, 2003).
2003: Outmigration adjustments increase the wage index for hospitals that employ a significant percentage of individuals who reside in neighboring metropolitan statistical areas with higher wage indexes (Medicare Prescription Drug, Improvement, and Modernization Act of 2003. P.L. 108-173, December 8, 2003).
2003: The U.S. Congress establishes a 1.0 floor on the work geographic practice cost index (Medicare Prescription Drug, Improvement, and Modernization Act of 2003. P.L. 108-173, December 8, 2003).
2006: The U.S. Court of Appeals rules that CMS must immediately apply the occupational mix adjustment to 100 percent of the wage index instead of implementing the adjustment gradually (Bellevue Hospital v. Leavitt, 2006).
2006: The U.S. Congress mandates that MedPAC write a report to CMS containing recommendations for improving the wage index (Tax Relief and Health Care Act of 2006. P.L. 109-432, December 20, 2006).
2007: MedPAC’s June report suggests that CMS account for benefits, use industry-specific data for occupational mix measurements, employ smoothing techniques to reduce disparity between borders, and phase in major changes gradually (MedPAC, 2007).
2010: On behalf of HHS Secretary Kathleen Sebelius, CMS commissions the Institute of Medicine to evaluate the accuracy of the geographic adjustment factors (July 2010).
___________
a CMS surveys the hospitals every 3 years to gather information about paid hours by occupation. It receives national wage rates from the Bureau of Labor Statistics.
The wage data should meet certain fundamental criteria. Most importantly, the data should be sufficiently accurate for use in a price index. That is, the data should reflect the prevailing wages in each market. To meet this criterion, the data should include wages from all employers with which a hospital competes for labor and should not be limited to hospital wage data. This derives from the principle described above, that the wage index should reimburse for the price of labor in a given market and not the cost of labor actually incurred by hospitals. Numerous dimensions of the data affect the accuracy of the index. These include the granularity of data elements, the industries covered, the number of facilities in each market submitting data, and the inclusion of relevant information on benefits and contract labor. Accuracy is also affected by technical characteristics, such as volatility and missing data. In addition to meeting standards in these categories, to the extent possible, the data should also be transparent and timely, and minimize administrative burden.
On the basis of these characteristics, the committee evaluated the current data source—hospital cost reports combined with the occupational mix survey—against data from the BLS OES, as prescribed by the scope of task for this report.
Current Wage Index Data
Accuracy
As described above, the current wage index is computed from hospital employee wage data that are reported to CMS in annual hospital cost reports, and from a special occupational mix survey of hospitals conducted by CMS approximately every 3 years. For a number of reasons, these data do not produce an index that reflects the prevailing wages that hospitals face in their respective markets.
The data that hospitals currently report lack occupation-level wages for all occupations. As described above, occupation-specific data are available for nursing occupations only. Occupation-level data are needed in each market to standardize the measurement of the AHW to a single fixed quantity of hours for each occupation. The current data contain enough wage information to standardize nursing occupations only, leaving more than half of hospital employment unstandardized. This gap results in a wage index that reflects wages paid (actual labor costs) for the unstandardized portion of each hospital’s workforce rather than wages faced (the market price of labor). In a report for CMS, MaCurdy and colleagues found that the adjustment for nursing occupation mix results in a wage index change of at least 2 percent for almost 24 percent of wage areas (MaCurdy et al., 2009). To include all workers in the OMA, the occupational mix survey would have to be expanded to cover all hospital occupations.
The cost report data currently used in the HWI are limited to the hospital industry; they do not include wages from the broader health care sector or non–health care industries. Although cost report wage data come from a census of all hospitals, rather than a survey, the target population is not hospitals but the broader labor market of all employers who compete for hospital workers. The cost report data can therefore be viewed as a biased sample of the target population of all employers, negating the advantage of the census collection method.
A broad representation of occupation-specific wages is required to determine the prevailing wage in a labor market, on the basis of the definition of a labor market (Borjas, 2010). Most hospital workers—whether they are highly trained health care professionals such as nurses or occupations with little or no training—can work in health care settings other than hospitals
or in other industries altogether. For example, a nurse can work in a physician practice, a school, a government agency, or a manufacturing plant. (For a fuller discussion of this issue, see the section “Defining Markets” in Chapter 2.) When hospitals compete for workers, they place their compensation packages against those of other employers in the market, and not just other hospitals. Wage data from these other employers help to determine the prevailing area wage for a given occupation. Because the wage index produced by hospital-only data does not reflect the wages from these other occupations, the index does not reflect the prevailing wage in each labor market.
A related problem with hospital-only data is endogeneity, or circularity, defined as the ability of hospitals to influence their own wage index values. This is especially likely to occur in areas containing only a few hospitals, or in areas with one or a few dominant hospitals. Table 3-2 shows the number of hospitals in each labor market by metropolitan and nonmetropolitan areas.
Fifty-nine markets have only one hospital, and 98 markets have only two hospitals. Nearly all of these markets are small to medium metropolitan markets. Thus, the cost report data that hospitals in these areas submit in a given year directly influence each hospital’s index value 4 years later. In these markets in particular, the index can reflect hospitals’ own decisions about what wages to pay rather than the prevailing wage in the area.
Hospital cost report data contain information on both wages and benefits, such as health insurance and pensions, reported in dollar values. This is important because the portion of compensation paid in benefits varies geographically, thereby affecting the value of the wage index. Table 3-3 shows that high-wage areas generally pay a higher portion of total compensation in benefits relative to low-wage areas.
TABLE 3-2 Number of Inpatient Prospective Payment System (IPPS) Hospitals by Labor Market
| Number of Providers per Market Area | Large Urban Areasa | Other Urban Areasb | State Rural Areasc |
| 1 | 0 | 58 | 1 |
| 2 | 0 | 96 | 2 |
| 3 | 0 | 55 | 1 |
| 4 | 0 | 38 | 2 |
| 5 | 0 | 30 | 5 |
| 6–10 | 7 | 41 | 8 |
| 11–20 | 31 | 4 | 9 |
| >20 | 24 | 0 | 20 |
a Large urban indicates metropolitan statistical area (MSA) with population greater than or equal to 1 million.
b Other urban indicates MSA with population less than 1 million.
c State rural areas are aggregates of all non-MSA counties within a state.
SOURCE: RTI Analysis of CMS wage survey data for fiscal years 2009 to 2011.
TABLE 3-3 Benefits as an Add-on to Base Wages
| Percentile Distribution | Low-wage Hospital Labor Markets (Wage Index =0.90) |
High-wage Hospital Labor Markets (Wage Index >1.10) |
| 10th | 1.22 | 1.24 |
| 25th | 1.23 | 1.26 |
| 50th | 1.25 | 1.28 |
| 75th | 1.28 | 1.31 |
| 90th | 1.30 | 1.34 |
SOURCE: RTI Analysis of CMS wage survey data for payment fiscal years 2009 to 2011.
Excluding benefits from the index would produce inaccurate index values. Specifically, the index would be understated in areas where benefits account for a greater portion of compensation and overstated in areas where benefits account for a lower portion of compensation.
In addition to benefits, the cost report data—and the HWI—include the wages of contract workers, such as nurses, supplied by outside firms. Contract labor generally costs more per hour than directly employed labor (Broome, 2010); therefore, including wages for contract workers produces higher index values in payment areas that rely more on contractors relative to payment areas that rely less on contractors. Opinions vary regarding the appropriateness of including contract wages in the wage index, and an argument can be made that wages for contract labor should be excluded from the calculation of the index. Contract wages were included in the wage index until 1988, when data problems caused CMS to exclude them (CMS, 1992). CMS reincorporated contract labor wages in 1994 after revising the rules for reporting them (CMS, 1993). The following year, CMS incorporated wages for high-level administrators hired under management contracts (CMS, 1994). At the time, hospitals in nonmetropolitan areas were thought to use more contract labor than hospitals in metropolitan areas did, to deal with nursing and other shortages of skilled workers (Size, 1992).
Other aspects of accuracy are more technical in nature. Missing data can decrease the accuracy of the AHW (as it represents the population of hospital workers) calculated from a data source. To the degree that all hospitals complete and submit their cost reports, the AHW accurately captures hospital worker wages. The completion rate of Worksheet S-3 is greater than 90 percent (CMS, 2010). The occupational mix survey is a sample of 3,197 hospitals and has a response rate of 91.1 percent, and the completion rate of Worksheet S-3 is higher (CMS, 2010).
The accuracy of each payment area’s AHW—again, in reference to the population of hospital workers only—also depends on whether the data that hospitals supply on Worksheet S-3 and in the occupational mix survey are correct. Both data sources are subject to review and edits for aberrant data. However, a review of cost reports from 21 hospitals conducted by the Department of Health and Human Services Office of Inspector General (OIG) found that 17 hospitals overstated wages and 4 understated wages (HHS, 2007). Overstatements ranged from 0.23 percent to 21 percent, while the four understatements ranged from 0.62 percent to 28 percent. The OIG stated that “the fiscal intermediaries’ cost report reviews did not detect the errors because their review procedures were generally limited in scope.”
The stability of cost report data from year to year is reasonable in most areas. However, in areas with only a few hospitals, the data can be volatile from year to year (MaCurdy et al., 2009), particularly if a sudden change in occupational availability occurs or a union contract changes wages significantly.
Transparency
The current cost report data used for the HWI are highly transparent. Because the cost reports are publicly available, a hospital can compute its own wage index, compare it with the indexes of other nearby hospitals, and plan for appeal through reclassification or other means.
Timeliness
Stakeholders have stated that hospital cost report data are dated. A given year’s index is based on data that are 4 years old, because of the time required for CMS to receive and audit
the data and respond to appeals of agency auditing decisions. It is not clear to the committee if or how the time lag affects the relative values of the wage index.
Administrative Burden
Worksheet S-3 and the occupational mix survey draw administrative resources from both hospitals and CMS. Hospitals must record and report data at the level of detail required by CMS. CMS and its contractors must review and manage the data. Moreover, the occupational mix survey involves a reporting and review effort separate from that for Worksheet S-3. Partly for this reason, the OMA is limited to the nursing occupations.
Inuts and Weighting
The inputs available from cost report data are total wages and total hours reported at the hospital level. From these inputs, CMS computes an AHW for each hospital. Then, for each labor market, CMS computes an AHW for all the hospitals in the area. The AHW for each labor market is divided by the national AHW to produce a wage index for each market. At this stage, the wage index is called a “raw” index because it is unadjusted for occupational mix.
To compute the OMA to the wage index, national occupation-specific weights are needed. These weights—expressed as the percentage of hours worked in each occupation—assign a level of importance to specific occupations and improve index accuracy. Because the weights available from the occupational mix survey cover nurses’ hours only and nurses make up 42.5 percent of the hospital workforce, the OMA is incomplete; to include all workers in the OMA, the occupational mix survey would have to be expanded to cover all hospital occupations.
Potential Improvements to Hospital Data
The committee discussed ways of improving existing hospital data so that they could meet the requirements necessary to reflect the price, rather than the cost, of labor. First, additional occupation-level data could be collected and reported in either the annual cost reports or the triennial occupational mix survey. Either approach would increase the administrative burden on both hospitals and CMS. Second, the index could be made more reflective of the wages prevailing in a geographic area by incorporating data submitted to CMS from additional types of facilities. Cost report data are collected for long-term specialty hospitals, skilled nursing facilities (SNFs), home health agencies (HHAs), and hospices. However, CMS does not review these data as carefully as hospital cost report data. If they are used for the calculation of the wage index, the data would require more intensive review than is currently done. The timeliness of the data could be improved if CMS could expedite the processes for review and correction of questionable data. This would likely require hiring or contracting with additional staff.
Even with the improvements discussed above, the data collected by CMS still reflect the actual costs incurred for labor rather than prevailing wages. Another approach is to collect BLS-type data from all facilities (including IPPS hospitals and facilities other than short-term acute care hospitals such as SNFs, HHAs, and hospices) outside of the cost report process. Facilities would electronically submit to CMS the same type of payroll data that BLS collects for a sample of hospitals shortly after the close of the calendar year. This may or may not improve timeliness
because it would require a CMS review process to replace the extensive reviews that BLS currently performs, as described below.
An Index Constructed with Data from the Bureau of Labor Statistics
Data
BLS sponsors the OES, which provides estimates of wages and employment rates for 800 occupations in 450 industries in the United States (BLS, 2011). The survey covers all salaried non-farm workers, excluding self-employed individuals. The data are collected through a voluntary mail survey distributed to about 200,000 establishments nationally every 6 months (BLS, 2011). Wages and employment rates are published on the basis of a rolling 3-year average; the total national sample size starts with six panels of 200,000 each, although some data are removed if they are deemed out of scope (BLS, 2011). Occupation-level wage data for specific industries are available at the level of MSA and statewide non-MSA regions within a state.5
Accuracy
The BLS data consist of occupation-specific hourly wages for all the occupations used by hospitals. At the labor market level, data can be segmented by industry, including the health care industry and, more specifically, the hospital industry. Because BLS data are collected at the occupation level, national weights can be computed for every occupation and incorporated into the index. Thus, the index is calculated as if all hospitals use the same amount of each occupation, for every occupation. In contrast, the hospital data provide this information for only four nursing occupations. The improved measurement of AHWs by occupation enabled by the BLS data produces an index that reflects the price of labor more accurately than an index generated with hospital data with a limited OMA. As reported above, several studies have shown that BLS data produce an index that better reflects prevailing wages in each area than cost report or OMA survey data (MaCurdy et al., 2009).
Because the BLS data are collected from all industries, an index using the data could include wages from multiple industries, in addition to hospitals. As explained above, multi-industry data are important to a price index because all employers’ wages determine the prevailing market wage. The committee considered an index based on (1) all-industry data or (2) health care sector data. In addition to hospitals, the health care sector includes physician practices, skilled nursing facilities, ambulatory surgical centers, home health agencies, and hospices, for example.
To gauge the relative accuracy of the options, the committee examined the correlations of the options with an index using data from all industries, based on the assumption that an all-industry index is more accurate than a health care sector index. As shown in Table 3-4, the correlation of the health care sector index with the all-industry index is very high—0.994 for metropolitan areas and 0.990 for nonmetropolitan areas. The correlation is still high but not as strong between the hospital index and the all-industry index: 0.976 for metropolitan markets and 0.951 for nonmetropolitan markets.
___________
5 Occupations are defined by the Standard Occupational Classification system. Industries are defined by the North American Industry Classification System. The Office of Management and Budget coordinated the development of both systems on the basis of the work of interagency and intergovernmental committees of statistical experts.
TABLE 3-4 Correlations of Hospital Indexes Computed from Wages from Different Industry Sectors
| All Employers | Health Sector | All Hospitals | General Hospitalsa | ||
| Metropolitan Markets | |||||
| All employer | 1.000 | ||||
| Health sector | 0.994 | 1.000 | |||
| Hospitals | 0.976 | 0.981 | 1.000 | ||
| General hospitals | 0.974 | 0.979 | 0.999 | 1.000 | |
| Bureau of Labor Statistics (BLS) Rest-of-State Areas | |||||
| All employer | 1.000 | ||||
| Health sector | 0.990 | 1.000 | |||
| Hospitals | 0.951 | 0.950 | 1.000 | ||
| General hospitals | 0.951 | 0.950 | 0.999 | 1.000 | |
a Category includes only general medical and surgical hospitals.
SOURCE: RTI.
In Chapter 2, the committee recommends an index based on health care sector data, acknowledging that health care employers may differ from the universe of all employers in terms of the percentage of compensation paid in benefits, the likelihood of unionization, and other ways that might affect compensation rates for some types of employees. Extending the index to account for additional employers increases the number of facilities contributing data, thereby addressing the problem of index circularity (in addition, data become more stable from year to year because the sample size increases).
Unlike hospital cost report data, BLS data do not include benefits, an important component of the wage index because the portion of total compensation attributable to benefits varies systematically. As seen in Table 3-3, the median value of benefits as a percentage of base wages is 25 percent in low-wage areas and 28 percent in high wage areas.
Benefits information is available in another BLS survey, the National Compensation Survey (NCS). However, occupation-level all-industry benefits data are available for only 15 MSAs, and expanding this survey would be costly, which is unlikely in the current fiscal climate.
The committee discussed several alternatives for incorporating benefits data into an index constructed with BLS wage data. CMS could continue to require submission of the benefits portion of Worksheet S-3 and compute an adjustment to the wage index reflecting the value of benefits. This adjustment would be incorporated as a second step, after the wage index is calculated, similar to how the OMA is applied to the wage index. This approach has two disadvantages: (1) use of data from two different sources can create inaccuracies and inconsistencies in wage index values, and (2) maintenance of Worksheet S-3 defeats an advantage of using BLS data, which is to eliminate the need for hospitals to complete the form. A plausible alternative is to use the NCS to construct a regression from which a coefficient for benefits could be used to adjust wages.
Another difference between hospital and BLS wage data is that BLS data do not capture the wages of contract labor. Contract services are used for professions in short supply, for services where the patient volume is insufficient to hire a staff employee, or to fill vacancies created by turnovers (Broome, 2010). Nationally, in 2002, contract workers accounted for about 8 percent of all hospital personnel expenses (Shoemaker and Douglas, 2005). A more recent study in
North Carolina attributed about 5 percent of that state’s hospital labor costs to contract labor (Broome, 2010). Hospitals vary in their reliance on contractors, and the trend differs by profession. In North Carolina, for example, rural hospitals use more contract therapists and certified nurse anesthetists than urban hospitals do, while urban hospitals use more contract pharmacy and surgical technicians and more contract clinical lab scientists.
The use of contract labor is generally inefficient. A contract worker is more expensive per hour than the same worker employed directly by a hospital (Shoemaker and Douglas, 2005), partly because a fee is paid to the firm supplying the worker, in addition to compensation to the worker. While the use of contract labor may be necessary because of scarcity in the type of labor that a hospital needs, it may also reflect management decisions unaffected by other pressures. An argument can be made that contract wages do not belong in the wage index and that the lack of contract wages in BLS data is not necessarily a drawback. The committee will address this issue in more detail in the phase 2 report, considering whether or not contract labor should be included and, if so, how to incorporate contract labor into an index using BLS data.
BLS and CMS data are also different when they are compared according to their year-to-year volatility, with BLS data appearing to be more stable. One reason is that the BLS index is a rolling average of 3 years of data, and rolling averages are inherently more stable than are static averages (Zaslavsky, 2002). Indexes constructed from CMS data experience small to medium changes over 1 year more frequently than indexes constructed from BLS OES data. The 2002 to 2004 BLS wage index experienced a –0.05 percent mean 1-year change, while the FY 2005–FY 2008 Medicare wage index experienced a –0.17 percent mean 1-year change (MaCurdy et al., 2009).
All individual hospitals and all areas experience some degree of variation, regardless of which index is applied (MaCurdy et al., 2009). An RTI analysis found that from 2002 to 2004, 1.3 percent of payment areas experienced changes in the CMS index of 10 percent or more, while 0.9 percent of the payment areas experienced changes in the BLS index of 10 percent or more (Dalton, 2007). Use of health care or all-industry data, as opposed to hospital-only data, can improve stability for two reasons: (1) the sample size increases and (2) events that can lead to sudden wage changes, such as a diminished supply of individuals in certain occupations, are less likely to occur simultaneously in multiple industries (MaCurdy et al., 2009).
The BLS data come from a survey (based on a probability sample), not a census, as do hospital cost report data. Wage and employment data are estimated by use of scientifically accepted statistical procedures sanctioned by the Office of Management and Budget (OMB). The response rate for the survey is about 80 percent. Wages and employment (counts of workers) are imputed for nonrespondent employers by a method known as “nearest neighbor.” This is accomplished by replacing the missing cell value with the value of the most similar cell for which data are available, based on characteristics including occupation, location, and employer size.6
BLS publishes all-industry data for occupational categories by area for which (1) the relative standard errors (RSEs)7 are less than 30 percent for wages and 50 percent for employment and (2) there are at least three sample units with at least two responses. The first requirement is to ensure the precision of the data and the second is to protect the confidentiality of employer
___________
6 Technical details on BLS data are available at http://www.bls.gov/oes/current/oes_tec.htm.
7 RSE is a measure of the precision of the estimate. More specifically, it is the standard error of the estimate divided by the estimate itself (the mean of the sample). For example, an hourly wage estimate of $30 with a 10 percent RSE means that the actual wage is likely to be between $27 and $33. The actual wage is more likely to be closer to $30 than to $27 or $33.
respondents. Under its current policies, BLS does not publish wage and employment data for the health care sector by state or area, but they do allow state partners to publish that information.
To assess the accuracy of the BLS wage data for the committee, RTI examined the RSEs for the employment share-weighted average wages of three occupations that comprise 50 percent of total hospital employment: RNs; nursing aides, orderlies, and attendants; and office and administrative support staff. This simulates a combination of all occupation-adjusted wages used to construct an index from BLS all-industry data. The analysis, performed with published all-industry data, shows that BLS data are reliable in most areas, including nonmetropolitan areas. The committee could not evaluate unpublished health sector data in the time allotted for the study because the standard errors for these data were not available from BLS in that time period.
For the committee’s analyses, BLS calculated wage index values on the basis of unpublished data for the health care sector. RTI analyzed the correlation between the wage indexes calculated using BLS published all-industry data and wage index values calculated for IOM by BLS using unpublished health sector data. As Table 3-4 shows, the correlation is 0.994, and the number of markets in which the index values of published versus unpublished data differ substantially is small.
The BLS data are reviewed for accuracy at three levels: the state agents who collect the data (these are sworn agents of BLS), BLS staff at the regional federal level, and BLS staff at the national level.
Transparency
Because BLS data are collected as part of a confidential survey process, data at the firm level are not publicly available; wage data are available at the area level. In comparison, CMS cost report data are available at the hospital level. The methods that BLS uses are completely transparent. Moreover, BLS makes its restricted data available on-site to researchers by application, and research to validate wage indexes may fall into the category of acceptable use.
The committee values transparency as a core principle. However, transparency does not require that hospitals have access to cost data from other hospitals, because neither costs nor hospitals are relevant constructs in the context of a price index.
Timeliness
The timeliness of BLS data is comparable to that of the data currently used for the wage index. The data that BLS uses for a given year’s index range from being 2 to 5 years old, which is the result of using a rolling average to compute wage rates.
Administrative Burden
If BLS data were used to construct the HWI, the triennial occupational mix survey could be eliminated, along with all or part of Worksheet S-3. If BLS data were used in conjunction with a regression-computed benefits adjustment based on NCS data, CMS could eliminate the entire Worksheet S-3, a two-page line-itemed document similar to an Internal Revenue Service tax form. Acquisition of benefits information from Worksheet S-3 would require maintaining that portion of the worksheet.
Inuts and Weighting
With occupation-level data, it is possible to construct an index by using fixed national weights, holding all hospitals accountable to a single national standard for the amount of each occupation used. As explained above, this is a fundamental principle of a price index versus a cost index: that the index should not capture variation due to hospital management decisions.
Some hospitals argue that they are reliant on a different and presumably more costly mix of occupations than other hospitals. In some states, laws require a specific nurse-to-patient ratio or limit the scope of practice of some types of nurses. In California, for example, the law requires one RN for every five medical/surgical patients and one RN for every two intensive care patients. In addition, California law limits the scope of practice for LPNs, with the effect being that RNs provide the majority of inpatient care (Kasprak, 2004). The question then arises as to whether the weights (or the OMA, in the current index) should account for these local differences.
The committee examined metropolitan and nonmetropolitan differences in occupational mix for each of the four United States census regions. Table 3-5 compares hospital use of the 10 most common hospital occupations across these areas. Generally, the shares of occupations used are similar across census regions. A report for CMS compared differences in BLS wage index values using national weights and state weights. For 93 percent of payment areas, the difference between state-weighted and national-weighted indexes was less than 1 percent (MaCurdy et al., 2009).
Although the labor shares in individual states can vary for reasons beyond the control of individual hospitals, a price index that accommodates state and local decisions such as staffing ratios and scope-of-practice laws can be administratively burdensome and give states an inappropriate incentive to mandate specific input quantities because the costs would be reimbursed by the federal government. As a federal program, Medicare’s responsibility is to purchase quality services in a way that provides incentives for efficient provision of high-quality care to Medicare beneficiaries across the country.
A related issue concerns which occupations to include in the wage index computation. The choice of occupations and the weights that they supply will affect index values if there are systematic geographic differences in the mix of occupations used by hospitals, if wages for those occupations differ, and if the number of workers in these occupations is substantial.
If BLS hospital-only data are used, not all occupations can be included because the sample sizes for less commonly used occupations in smaller labor markets would be insufficient. A Medicare Payment Advisory Commission (MedPAC) report that recommended using BLS data for production of the wage index suggested using 30 occupations (MedPAC, 2007a), and an Acumen report to CMS to evaluate MedPAC’s proposal suggested that 62 occupations be included as weights in an index based on BLS data (O’Brien-Strain et al., 2008). The Acumen analysis shows that the choice of occupations has a moderate impact on index values: about 14 percent of wage index areas experienced a difference in their index values of more than 2 percent when computed on the basis of the 62 most prevalent occupations and MedPAC’s 30 occupations.8
The committee examined the effects on wage index values of using MedPAC’s 30 recommended occupations versus all of the occupations contained in the BLS OES data. Figure 3-2 shows a scatter plot correlating the HWI values computed on the basis of each set of occupations. Although the correlation between the two sets is extremely strong, the graph shows that
___________
8 See Appendix E for a comparison of the MedPAC and IOM proposals for alternative hospital wage indexes.
| Employment Shares (%) | |||||||||
| Northeast | Midwest | South | West | ||||||
| Occupation Title | National | MSA | Statewide Non-MSA |
MSA | Statewide Non-MSA |
MSA | Statewide Non-MSA |
MSA | Statewide Non-MSA |
|
Registered nurses |
29.69 | 29 | 26 | 30 | 25 | 31 | 25 | 31 | 25 |
|
Nursing aides, orderlies |
7.89 | 8 | 8 | 7 | 8 | 8 | 9 | 8 | 9 |
|
Licensed practical and vocational nurses |
3.15 | 2 | 4 | 2 | 5 | 3 | 7 | 3 | 4 |
|
Radiologic technologists and technicians |
2.54 | 2 | 3 | 3 | 3 | 3 | 3 | 2 | 3 |
|
Maids and housekeeping |
2.34 | 2 | 3 | 2 | 3 | 2 | 3 | 2 | 3 |
|
Medical secretaries |
2.31 | 2 | 2 | 2 | 2 | 2 | 2 | 3 | 2 |
|
Medical and health services managers |
2.04 | 3 | 2 | 2 | 2 | 2 | 2 | 2 | 2 |
|
Medical and clinical laboratory technologists |
1.97 | 2 | 2 | 2 | 2 | 2 | 2 | 2 | 2 |
|
Office clerks, general |
1.97 | 2 | 2 | 2 | 2 | 2 | 2 | 2 | 1 |
|
Interviewers, except eligibility and loan |
1.79 | 2 | 2 | 1 | 2 | 2 | 3 | 2 | 2 |
SOURCE: RTI analysis of BLS tabulations of Occupational Employment Statistics (OES) data released May 2010, for the general medical and surgical hospitals (industry code 622100).
lower-wage markets have a slightly higher wage index when the full set of occupations is used, whereas higher-wage markets have a slightly higher index when the reduced set of occupations is used. Since all occupations are available in most labor markets in BLS health care sector data, it makes sense to use all occupations in the index construction and weighting, based on wage data from the health care sector.
THE HOSPITAL WAGE INDEX AND OTHER FACILITIES
Recommendations for improving the HWI for IPPS hospitals will also affect facilities other than short-term acute care hospitals. Since 1997, CMS has applied a pre-floor, pre-wage index (without accounting for occupation mix or outmigration) to inpatient rehabilitation
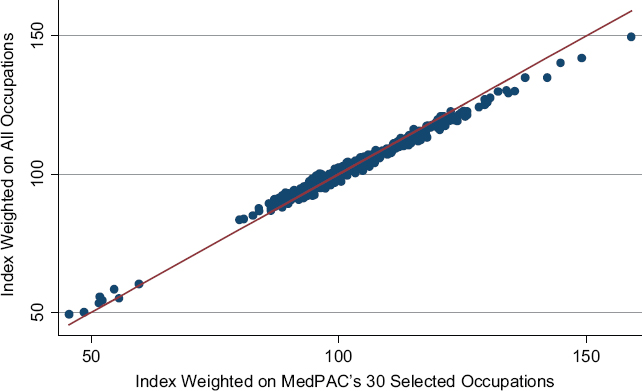
NOTE: Pearson correlation coefficient is 0.99.
SOURCE: RTI analysis of BLS indexes computed from published and unpublished data.
facilities, inpatient psychiatric facilities, long-term care hospitals (LTCHs), SNFs, Hospital Outpatient Department (HOPDs), ambulatory surgical centers (ASCs), HHAs, and hospice facilities (Dalton, 2007).9
The HWI may be inaccurate as a geographic adjuster for these providers for several reasons. First, facilities other than short-term acute care hospitals have a different labor share and mix than IPPS hospitals have (MedPAC, 2007a) because many of them provide services that are different from those provided by IPPS hospitals. Second, the HWI is not geographically representative of other types of facilities such as HHAs, SNFs, etc.; that is, facilities other than short-term acute care hospitals may be located in areas where there are no short-term acute care hospitals (Dalton, 2007). Third, the HWI includes data pertaining to IPPS hospitals. Although labor markets in metropolitan areas are defined primarily by larger IPPS facilities, labor markets in nonmetropolitan areas are typically governed by smaller establishments. Therefore, use of only IPPS hospital wages to calculate a wage index for nonmetropolitan areas in which most employees work at smaller establishments does not accurately reflect the type of labor that facilities other than short-term acute care hospitals provide or the wages that they pay (Dalton, 2007).
To improve payment accuracy to facilities other than acute care hospitals, the committee
___________
9 The pre-reclassified, pre-floor wage index is the value of the index before changes are made on the basis of hospital requests to CMS to be classified in different labor markets and before incorporation of the effects of congressional mandates to limit how low a wage index value can be. See Chapter 2 for more information.
recommends that CMS use BLS OES data rather than the hospital data used in the current HWI. Because the BLS data include wage information from all employers, CMS can adjust the weights for each type of facility to create an index that reflects the national labor share and mix of each facility type. It is important to note that smoothing methods (discussed in Chapter 4) are applicable to any type of provider, and facilities other than short-term acute care hospitals should benefit from smoothing to prevent large differences in wage index values between nearby providers. The committee also encourages CMS to continue a more thorough study of payment methodologies as they are applied to facilities other than short-term acute care hospitals. Because of the time constraints of this study, the committee was unable to investigate providers other than IPPS hospitals.
Apart from wage variation, other variation is currently not captured in the input price index used for hospital services, including variation in prices for utilities such as energy and telecommunication services. Another shortcoming in the adjustment of hospital input prices lies in the source of data used to adjust for capital. Currently, the value of hospital capital is adjusted using the wage index because of a lack of data on capital price variation. If CMS used data on the price of capital rather than the price of labor, the accuracy of the capital adjustment might be improved.
The committee recognizes that gaps exist in the geographic adjustment of the inputs used to produce hospital services. Although the committee did not have the time or resources to explore these areas in more depth, CMS may want to do so. New sources of information on clinician office rent (recommended in Chapter 5) might prove useful in refining the geographic adjustments for hospital input prices.
Recommendation 3-1: The U.S. Congress should revise the hospital wage index (HWI) statute (Section 1886[d][3][E] of the Social Security Act) to allow the Secretary of the U.S. Department of Health and Human Services to use data from the Bureau of Labor Statistics (BLS) to compute the wage index.
An index constructed by the use of the BLS wage data from all health care employers will reflect the prevailing wage in each labor market more accurately than the use of the Centers for Medicare and Medicaid Services (CMS) hospital-only data; reduce the potential for hospitals to affect their own index values; and reward hospitals for efficient use of labor. The wages paid by all health care sector employers in the geographic area is a better measure of prevailing market wages than the wages paid only by acute care hospitals. Because BLS data are collected at the occupation level, national weights can be computed for every occupation and incorporated into the index. The improved measurement of average hourly wages by occupation enabled by the BLS data will produce an index that reflects the price of labor, rather than the cost of labor. In contrast, the index constructed with hospital data has only a partial Occupational Mix Adjustment (OMA), and the data used to compute it come from hospital employers only. As required by law, if the use of BLS data changes the total level of compensation, CMS will have to recalibrate the wage index to make the change budget neutral.
The committee compared the BLS and hospital data on other characteristics. The major disadvantage of the BLS data is that they do not contain information on the value of benefits. However, this limitation can be addressed by using data from the National Compensation Survey to compute an adjustment to average hourly wages for use in the wage index. An alternative would be for CMS to continue collecting benefits data from hospitals. The BLS is also missing data pertaining to the use of contract labor in hospitals. The committee will revisit this issue in the phase two report and consider whether or not an HWI should include the price of contract labor. If appropriate, the committee will identify and recommend potential sources of contract labor data. Another disadvantage is that the BLS data are less accessible than the hospital data are. Because BLS data are carefully managed under federal statistical requirements for accuracy and confidentiality, hospitals and their agents cannot work directly with the BLS firm-level data. However, BLS allows researchers to apply to work with such data on-site for credible research purposes.
Constructing the HWI using the BLS data would reduce the administrative burden on both hospitals and CMS. The occupational mix survey of hospitals could be eliminated, and the Worksheet S-3 that hospitals submit annually to CMS could be eliminated or shortened significantly.
Recommendation 3-2: The Centers for Medicare and Medicaid Services (CMS) should establish an ongoing agreement with the Bureau of Labor Statistics (BLS) to use all necessary wage data from the Occupational Employment Statistics to compute the wage index.
CMS will need access to unpublished data from the BLS to compute the wage index. The BLS publishes all-industry data at the occupation level for most labor markets. The BLS also maintains a broader set of unpublished data, including all-industry data for the remaining markets and health care sector data at the occupation level for all markets. Although all-industry data best reflect market wages for a given hospital occupation, the committee acknowledged in an earlier recommendation reasons for restricting industry wage data to the health care sector. If small sample sizes affect the accuracy of calculations, additional data could be collected, areas or years of data could be combined, or methods that borrow strength from surrounding regions could be used.
Several options for arranging CMS’s access to the BLS data exist. The agencies could arrange for the BLS to calculate wage index values for CMS. The two agencies could also pursue a legal arrangement under which the BLS provides data directly to CMS, or CMS could work with the BLS to publish health care sector data. Although neither CMS nor BLS would be able to release unpublished data, the methods used to compute the index could be made public, and researchers could apply to BLS to use unpublished data on-site at the agency to do validation research, which could include evaluating the accuracy of the wage indexes based on the BLS data.
Recommendation 3-3: The committee recommends use of all occupations as inputs in the hospital wage index, each with a fixed national weight based on the hours of each occupation employed in hospitals nationwide.
The choice of occupations and the weights that they supply will affect index values if there are systematic geographic differences in the mix of occupations used by hospitals, if wages for
those occupations differ, and if the number of workers in these occupations is substantial. Use of all occupational categories eliminates the element of arbitrariness that by nature pertains to the use of any subset of occupations.
The committee examined the effects on wage index values of the use of a limited number of occupations versus all of the BLS occupations. Lower-wage markets have a slightly higher wage index when the full set of occupations is used, whereas higher-wage markets have a slightly higher index when the reduced set of occupations is used. Since all occupations are available in most labor markets in the BLS health care sector data, it makes sense to use all occupations in the index construction and weighting, based on wage data from the health care sector.
The inclusion of all occupations in constructing the wage index strengthens the case for using health care industry rather than hospital industry-only data to construct the index. The use of hospital industry-only data would require that some occupations be excluded because, although sufficient data are available at the nationwide level to construct hospital industry-specific occupational weights, the sample size for less commonly used occupations in smaller labor markets would be insufficient to construct indexes that include all occupations in each area.
Recommendation 3-4: The Centers for Medicare and Medicaid Services (CMS) should apply the proposed hospital wage index to facilities other than short-term acute care hospitals, using nationwide occupation-specific weights derived from data for each type of facility.
The Hospital Wage Index (HWI) is currently applied to non-inpatient prospective payment system facilities, such as skilled nursing facilities, home health agencies, and ambulatory surgical centers. The current wage index does not accurately reflect the wage levels that these providers face because it is computed only from hospital wages, based on hospital labor shares. The committee recognizes that its recommended adjustments to the wage index will affect these non–inpatient prospective payment system facilities. These types of facilities typically have a different mix of employees than inpatient prospective payment system hospitals have, and their labor shares are unique to the nature of the clients that they serve, the resources that they require, and the services that they offer. To improve the accuracy of the price index recommended by the committee for geographic adjustment of payment to these non–inpatient prospective payment system facilities, CMS should use the labor shares derived from each setting as occupation-specific weights in its respective index computations.
BLS (Bureau of Labor Statistics). 2011. Occupational employment statistics overview. Washington, DC: Bureau of Labor Statistics. http://www.bls.gov/oes/oes_emp.htm (accessed March 3, 2011).
Borjas, G. 2010. Labor economics. 5th ed. Boston: McGraw-Hill.
Broome, S. 2010. 2010 NCHA workforce report. Cary: North Carolina Hospital Association.
CMS (Centers for Medicare and Medicaid Services). 1992. Hospital Inpatient Prospective Payment Systems and 1993 FY rates. Federal Register 57(170).
______. 1993. Hospital Inpatient Prospective Payment Systems and 1994 FY rates. Federal Register 58(100):30101–30964.
______. 1994. Hospital Inpatient Prospective Payment Systems and FY 1995 rates. Federal Register 59(102):27708–27930.
______. 2010. Medicare program; hospital Inpatient Prospective Payment Systems for acute care hospitals and the long term care hospital prospective payment system changes and FY2011 rates; provider agreements and supplier approvals; and hospital conditions of participation for rehabilitation and respiratory care services; Medicaid program: Accreditation for providers of inpatient psychiatric services; Final Rule. Federal Register 75(157):50042–50677.
______. 2011. Rural health fact sheet series: Sole community hospital. Washington, DC.
Dalton, K. 2007. Potential refinements to Medicare’s wage indexes for hospitals and other sectors final report. MedPAC contract research series 07-3. Washington, DC: MedPAC. http://purl.access.gpo.gov/GPO/LPS89118 (accessed November 2010).
Dalton, K., R. T. Slifkin, and H. A. Howard. 2002. Rural hospital wages and the area wage index. Health Care Financing Review 24(1):155–175.
HHS. 2007. Review of hospital wage data used to calculate inpatient prospective payment system wage indexes. Washington, DC: HHS.
Kasprak, J. 2004. California RN staffing ratio law. 2004-R-0212. February 10, 2004.
MaCurdy, T., T. DeLeire, K. de Nava, P. Kamenecka, Y. Tan, and S. McClellan. 2009. Revision of Medicare wage index: Final report part 1. Burlingame, CA: Accumen, LLC.
______. 2010. Revision of Medicare wage index: Final report part 2. Burlingame, CA: Acumen, LLC.
MedPAC (Medicare Payment Advisory Commission). 2007a. An alternative method to compute the wage index. In Report to the Congress: Promoting greater efficiency in Medicare. Washington, DC: MedPAC. MedPAC. 2007b. Payment basics: Critical access payment systems. Washington, DC.
Mistichelli, J. 1984. Diagnosis related groups (DRGs) and the prospective payment system: Forecasting social implications. Washington, DC: National Reference Center for Bioethics Literature: Georgetown University.
O’Brien-Strain, M., W. Addison, E. Coombs, N. Hinnebusch, M. Johansson, and S. McClellan. 2008. Review of alternative GPCI payment locality structures. Burlingame, CA: Acumen, LLC.
Pope, G. C., W. P. Welch, S. Zuckerman, and M. G. Henderson. 1989. Cost of practice and geographic variation in Medicare fees. Health Affairs (Millwood) 8(3):117–128.
ProPAC (Prospective Payment Assessment Commission). 1990. Report and recommendations to the Secretary, U.S. Department of Health and Human Services. March 1, 1990. Washington, DC: ProPAC.
______. 1991. Report and recommendations to the Congress. Washington, DC: ProPAC.
Sheps Center. 2006. A primer on the occupational mix adjustment to the Medicare Hospital Wage Index. Chapel Hill, NC.
Shoemaker, P., and H. Douglas. 2005. Trends in the use of contract labor among hospitals. Louisville, KY: American Hospital Directory, Inc.
Size, T. 1992. A pause on the road to rural hospital equity. Rural Health Care 14–16.
Zaslavsky, A. S. A. 2002. Interactions between survey estimates and federal funding formulas. Journal of Official Statistics 18(4):371–391.


