
D
Transformative Action Through Systems-Based Thinking
Robert Berkebile, Fellow of the American Institute of Architects, BNIM Architects
Today I want to share some thoughts and information with you about the tools being used to create sustainable buildings and also about the role of systems-based thinking. While we would benefit from improvements in the technology, tools, and materials needed for sustainable development, the primary limitation is our thinking. So, I’m going to focus on utilizing the available tools and, as importantly, on systematic processes for using those tools to their maximum advantage.
Between 1970 and today, the focus of architecture and construction has evolved. In the 1970s, the focus was on conservation at the building scale. As we began looking at larger and larger scales—neighborhood, city, region, watershed, airshed, jobshed, and so on—we began thinking in terms of sustainability, “Living Buildings,” restoration, and regenerative approaches.
From my perspective, systems-based thinking for the U.S. construction industry really began in 1989 through creation of the American Institute of Architects’ Committee on the Environment (AIA COTE). The AIA COTE’s dialogue with diverse industry and environmental stakeholders gave rise to the U.S. Green Building Council (USGBC).1Since then, we have seen dramatic savings in energy, water, and materials from buildings that are certified under the USGBC’s Leadership in Energy and Environmental Design (LEED) rating system. Even more importantly, we have seen other benefits, including human health and productivity effects and positive social, economic, and environmental impacts on the surrounding community, which are a direct result of using a more systems-based approach.
The definition of what constitutes good design is evolving. It is a given that building design must satisfy the owner’s programmatic needs, including budgets for time and cost, and designs must comply with public safety requirements defined by building codes. But, historically, good design has been a beauty contest. Approximately 25 years ago that definition was called into question when a series of “well-designed,” award-winning buildings caused their occupants to be uncomfortable or sick, had excessive operating and maintenance costs, and resulted in negative impacts on the surrounding neighborhood or environment. Today, if a building is not healthy for its occupants, for the planet, and for the future of all life, it is not well designed, no matter how good it looks.
___________________________
1Information available at http://www.usgbc.org.
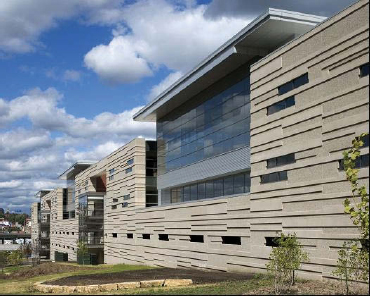
FIGURE D.1 Internal Revenue Service building, Kansas City, Missouri. SOURCE: Courtesy of BNIM Architects.
The “Top Ten Green” building design awards that the AIA COTE bestows every year provide a snapshot of this evolution. On the AIA Web site (http://www.aia.org), one can see how the industry has progressed in its concept of what is green and what is good design.
One recent example of good design recognized in AIA’s Top Ten program is a large Internal Revenue Service (IRS) center in my hometown, Kansas City, Missouri (Figure D.1). This building of approximately 1 million square feet of space was constructed using a design-build process in which the IRS, the General Services Administration (GSA), the developer, the city, and the source of financing were all partners.
The design team used building information modeling (BIM) to analyze many scenarios quickly to advance the best concepts—those that would satisfy a range of stakeholders and create an environment within which the people processing tax returns could feel good about their environment and experience increased health and productivity.
BNIM Architects has used BIM technology on a variety of projects including a band shell in North Charleston, South Carolina (Figure D.2). This facility was part of a 3,000-acre redevelopment, and our client wanted it to be ready for a Fourth of July concert. However, by the time design approval was received from the city, we did not have time for a typical design-bid-build process. So, our office e-mailed our design (using BIM) to the contractor. The design documents were created and approved electronically and then entered directly into the contractor’s manufacturing system (computer-controlled fabrication). The only piece of paper that was printed for this project was the foundation drawing for the local contractor. Technology and collaboration, in this case, made the impossible possible.
We find that high-performance goals require systems-based thinking, collaboration, and computer tools to facilitate a collaborative dialogue of discovery. A comprehensive redevelopment plan for 3,000 acres in North Charleston, South Carolina, is a good example. We first looked back 12,000 years at the deep ecology of the place to understand its history—not to restore it, but to create the best options for moving forward and adding vitality with each decision. As seen in the conceptual plan in Figure D.3, we were examining human systems of 5- and 10-minute walking circles, centering them on the 11 schools within the area. This approach influenced transportation systems and the co-location of community centers, libraries, health clinics, and other community services within the schools. These decisions, in turn, increased the efficiency, quality of life, and economic performance of our community.
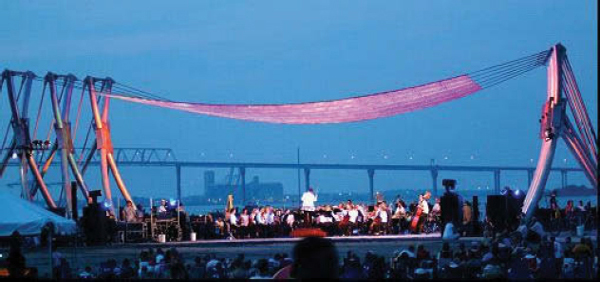
FIGURE D.2 Point Pavilion in North Charleston, South Carolina, designed and delivered using building information modeling.
SOURCE: Courtesy of BNIM Architects.
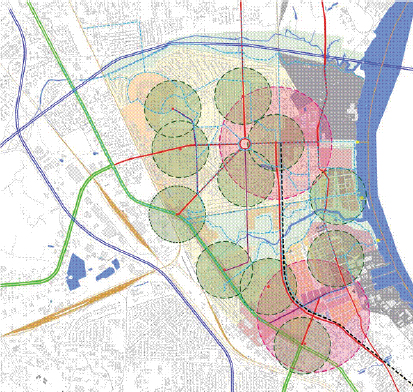
FIGURE D.3 Conceptual plan for North Charleston, South Carolina, using 5- and 10-minute walking circles centered on existing schools. SOURCE: Courtesy of BNIM Architects.
As far as I know, this was the first time in the United States that a developer had entered into an agreement with a city making a commitment that every decision related to design, planning, investment, and construction would increase the vitality of the social, economic, and environmental systems simultaneously. This commitment required holistic, systems-based solutions. The developer and design team could not forward recommendations that included trade-offs between social and/or environmental vitality and economic performance; the recommendations had to improve all three sectors from the community developer’s perspective.
This vision was created through collaboration during a 2-year planning process involving a wide range of stakeholders, including community interests, government agencies, neighborhoods, 65 consulting firms, universities, developers, economic consultants, and nonprofit foundations. All stakeholders made decisions in a series of meetings at various venues. Over time, the BNIM design team built a tool to inform and document these decisions, goals, and metrics. We named it the Noisette Rose, after the French botanist who created a beautiful white rose in Charleston (Figure D.4). Sadly his rose was exported to France; none remain in South Carolina, and the stream named for him has been destroyed by urban development and industrial pollution.
The design team built the Noisette Rose tool to inform our team about the design commitments, to inform our client about their investment options, and to provide the community with a way to monitor the results. It tracks the social, environmental, and economic goals; at some point we renamed these “people, planet, and prosperity,” which we refer to as the Triple Bottom Line. Each spoke on the graphic is a specific goal, and each goal has a specific metric against which it will be measured. The spoke at three o’clock for example, is energy efficiency. On the project represented here, we exceeded the goal slightly, and so the rose projects beyond the ring. By glancing at this diagram, anyone in the community can see that the project is going well. If the shape is a rosebud, it indicates poor performance. If the shape is asymmetrical, it indicates that some sector needs more attention. With this type of approach,
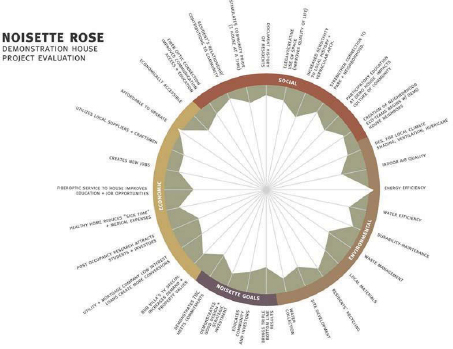
FIGURE D.4 Noisette Rose evaluation tool. SOURCE: Noisette Sustainable Master Plan. Courtesy of BNIM Architects.
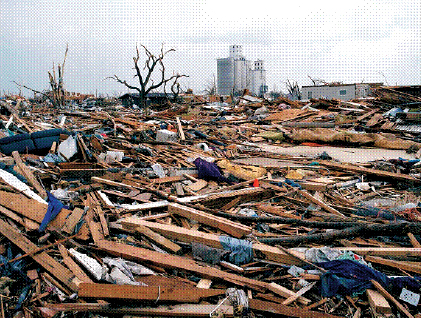
FIGURE D.5 Greensburg, Kansas, after the tornado in July 2007. SOURCE: Courtesy of Larry Schwarm.
using these tools and what I call a “creative dialogue of discovery,” it becomes much easier to improve the relationships between people, planet, and prosperity.
In 2007, a category EF5 tornado destroyed every structure except the grain elevator in the town of Greensburg, Kansas (Figure D.5). Possibly the second greatest shock to the community, however, was waking up to the headline in the New York Times, “Nature Performed a Coup de Grace on Kansas Town” (July 24, 2007). The residents began meeting in tents and other makeshift venues to determine what future they wanted to create. It was dialogue and systems-based thinking that allowed them, in a series of meetings held in the months following the tornado, to develop a unique, high-performance vision for the future of their community (Figure D.6).
Their vision was: “Blessed with a unique opportunity to create a strong community devoted to family, fostering business, and working together for future generations.” To implement that vision, they wanted to promote a high level of efficiency in new construction and to look to renewable options for energy generation.
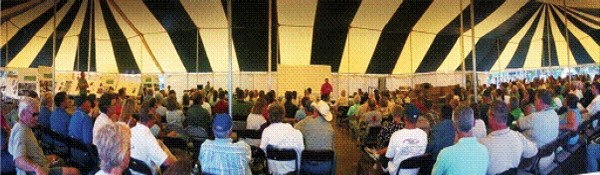
FIGURE D.6 Community meeting in Greensburg, Kansas, after the 2007 tornado. SOURCE: Courtesy of BNIM Architects.
Although the vision was beautiful, it was too vague to provide a basis for design and investment decisions. So the BNIM planning and design team helped the residents of Greensburg develop a set of specific goals related to community, family, prosperity, environment, affordability, growth, renewal, water, health, energy, wind, and the built environment. For example, each goal has specific metrics that inform every project that occurs in Greensburg. These goals and metrics dramatically transformed the master plan and changed the town forever with regard to its buildings’ efficiency, performance, and operating costs. There is more connectivity, more biodiversity, and more intimacy with the landscape (Figure D.7) For example, the plan treats every drop of water as a precious resource. Water is captured from buildings and landscape (including the streetscape), purified, stored, used, and returned to groundwater as clean as when it fell from the sky (Figure D.8).
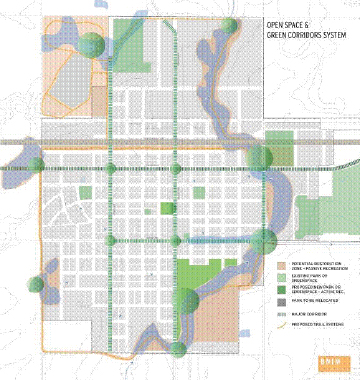
FIGURE D.7 Open space and green corridors system, Greensburg, Kansas. SOURCE: Courtesy of BNIM Architects.
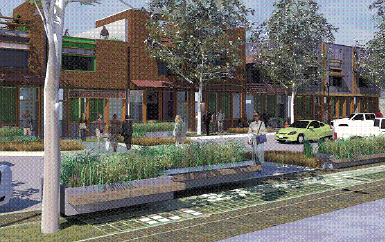
FIGURE D.8 Conceptual design for streetscape, water capture, and storage, Greensburg, Kansas. SOURCE: Courtesy of BNIM Architects.
New city-owned buildings in Greensburg must be twice as efficient as the ones that they replaced and must provide for better health, more comfort, and more passive survivability. Moreover, the city’s wind farm will generate far more energy than the city needs, and the excess will be sold to the grid, creating a revenue stream for the city. Greensburg was the first U.S. city to adopt a resolution making USGBC’s LEED Platinum its standard building goal. The six buildings completed to date—city hall, a community center, a K-12 school, a business incubator, a regional hospital, and a John Deere dealership—all meet that goal (three of these buildings are shown in Figure D.9).
One year following the tornado, the New York Times said, in essence: This is the most brilliant recovery in America. This should be the model for how to build after disaster. My hope is that this approach becomes the model for revitalizing rural America: using systems-based thinking to inform community designs and decisions, including buildings, economy, and lifestyles.
Greensburg is one response to Einstein’s statement that “we shall require a substantially new manner of thinking if mankind is to survive.” But even though they utilized LEED Platinum—and I would argue that the LEED rating system has been the most transformative tool in the design and construction industry—even LEED Platinum is only third-party certification that one is doing less damage to the environment than everyone else. Surely it is time to move beyond the concept of doing less damage, to doing something positive (restorative or regenerative).
I have been working on this idea since the mid-1990s, when my firm was working on a demonstration project for the National Institute of Standards and Technology (NIST) for the LEED 1.0 rating system. At that time, we called the rating system “Plus Ultra” (Latin for “more beyond”). It evolved with input from many, including Janine Benyus, Jason McLennan, and a major study funded by the David and Lucile Packard Foundation, to become what is known as a “Living Building.” The Packard Foundation hired my firm to design a new headquarters, and we signed a contract to deliver a LEED Platinum building. When we shared the idea of moving beyond LEED Platinum (less bad) to something positive, like a Living Building, they commissioned us to create six building designs on their site: a market rate building, the four levels of LEED, and a Living Building.2 The foundation wanted a comprehensive analysis of the relative costs, timing, and benefits of each level of performance, including 30, 60, and 100 years. When the study was completed, the foundation’s chief financial officer said that the only responsible decision, financially, was to design and build a Living Building. Since then, the concept has continued to evolve under the shepherding of the Cascadia chapter of USGBC to become the Living Building Challenge,3 which we introduced at Greenbuild4 in 2007.
Living Buildings gain that stature by being audited after their first year of operation to verify that they perform at the level at which they were designed, including generating more energy than they consume and purifying more water than they pollute. A facility that BNIM designed in Rhinebeck, New York, for the Omega Institute was recently the first LEED Platinum building in the world to become a certified Living Building (Figure D.10). It’s also the first sewage treatment facility (biological waste water treatment system) that has been claimed as the venue for the institute’s yoga classes.
Living Buildings are informed by and heavily rooted in the indigenous characteristics of a building’s eco-region in order to renewably generate their own energy; capture, treat, and use their own water; and operate by embracing the essence of what the site can provide. It is very simple but very demanding. There are five typologies within the Living Building Challenge: renovation, building, neighborhood,
___________________________
2A Living Building harvests all of its own energy and water, is adapted to the climate of the site, operates pollution-free, promotes health and well-being, is composed of integrated systems, and is beautiful.
3For information, see http://ilbi.org/the-standard/lbc-v1.3.pdf.
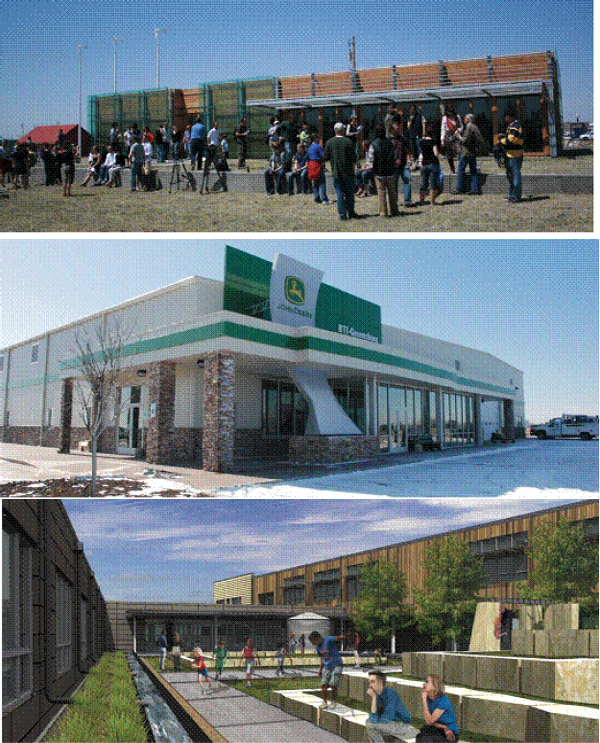
FIGURE D.9 LEED Platinum buildings in Greensburg, Kansas. NOTE: LEED, Leadership in Energy and Environmental Design, the rating system of the U.S. Green Building Council. SOURCE: Courtesy of BNIM Architects.
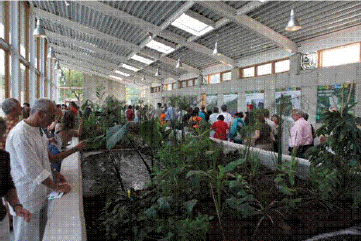
FIGURE D.10 Omega Institute for Holistic Studies facility in Rhinebeck, New York. SOURCE: Courtesy of BNIM Architects.
landscape, and infrastructure. Both LEED and the Living Building Challenge started at the building scale but are now moving to the larger, community scale.
Our firm, with a stellar team of consultants that includes Vivian Loftness, is working on a Living Building at the neighborhood scale at the University of Georgia, Athens—the new Odum School of Ecology. Eugene Odum was arguably the father of systems-based thinking in the United States. It seems appropriate that the school named after him would have these attributes and could measurably transform the campus, the city, and the state in terms of utilizing systems-based thinking to achieve new levels of performance. For example, our design for the landscape surrounding the building was created in collaboration with the faculty and nine programs that are part of the curriculum and research. The faculty and administration are helping us articulate priorities that are now being assigned metrics as part of a strategy for achieving their goals (Figure D.11).
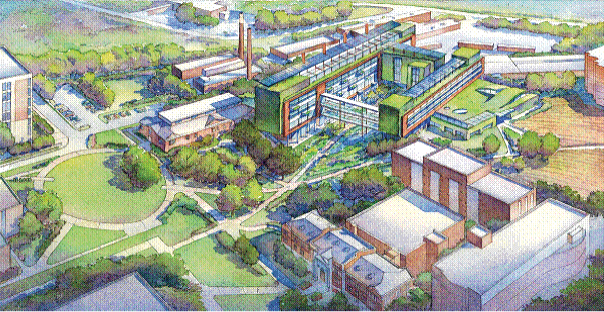
FIGURE D.11 Odum School of Ecology at the University of Georgia, Athens. SOURCE: Courtesy of BNIM Architects.
Over time, BNIM has learned that if we use a systems-based approach it changes the architecture and the landscape, and the line between the two becomes blurred. Often it becomes difficult to distinguish where one ends and the other begins. I find it helpful to try to understand the metabolism of the system. By examining how the whole system operates, we can design ways to close loops or make new connections to add vitality. For example, we like to convert “waste” to a resource by finding ways to put it back into the system as something productive and useful, much like how a natural system would manage waste.
Part of the design process for this project and others is to look for opportunities to create biomimetic materials that improve performance. The first famous biomimetic material used was for the swimsuits that U.S. athletes wore at the Beijing Olympics in 2008, when they broke so many swimming records. The swimsuits were made from a biomimetic fabric that was inspired by analyzing shark skin and dolphin skin. Scientists discovered that the skin of those animals is not smooth, but actually consists of a series of dimples and bumps that reduce friction. That knowledge was used to create the fabrics that dramatically improved the times registered by U.S. swimmers. We believe that incorporating biomimetic materials in buildings could result in building materials that are self-cleaning and self-healing or materials whose thermal value changes as needed.
By utilizing BIM on the Odum building project, or more specifically a green BIM, we can “test-drive” this building and compare it to the two best-performing buildings on campus. (It is not a one-to-one comparison, because one is a school of art and one is a classroom building, but we found that the Odum building out-performs the others, even though laboratories typically use far more resources [energy and water] than are used by other types of buildings.)
We did not plan to analyze carbon offsets, but potential donors were interested in tracking economic performance over time, including a measure for carbon offsets or carbon credits.
Now, I’m going to shift gears. We had hoped that Gregory Norris of the Harvard School of Public Health would be here to talk about life-cycle assessment and transforming the supply chain as it relates to buildings. Because he was unable to come, I was asked to fold some of that information into this presentation.
Work on a life-cycle assessment of the supply chain began in 1993 as part of a research project at Montana State University in Bozeman that was funded by the National Institute of Standards and Technology. The project was a research laboratory, and the subject of the grant was to create a building design that was more energy efficient than any building of its type. While we were interested in energy efficiency, it seemed that we knew a lot more about energy efficiency in 1993 than we knew about human health and productivity, about increases in biodiversity, and about the consumption of water and other materials and resources. I asked if we should not also be looking at those issues.
NIST expanded our commission to look at those issues, and a series of new approaches and tools were created as a result. This was at the time that the USGBC was born, and the building was being designed by many of the same people who were involved in creating the LEED rating system. We explored the possibility of resourcing all materials from within a 500-mile radius, which soon thereafter influenced the LEED rating system. We also looked at converting waste streams to new building materials. In order to inform the decisions, we had to know what the material flows were, although at the time this information was not available; so, we physically located, tracked, and modeled the resources that were available in the region. This research created several interesting new materials, but it was a labor-intensive process.
Several years later, with LEED in place, BNIM began working on a new School of Nursing for the University of Texas Health Science Center at Houston. We knew that we needed a more efficient process to analyze the best material choices, and Gregory Norris agreed to create software that would allow
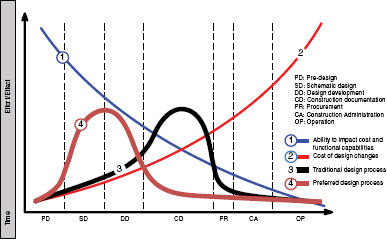
FIGURE D.12 Cost influence curves and Architecture, Engineering, Construction (AEC) productivity. SOURCE: Construction Users’ Roundtable.
us to use a large body of data collected on a county-by-county basis by the Environmental Protection Agency (EPA) and the Department of Commerce. The software allowed us to use those data to evaluate the upstream environmental impact of our design decisions. Using this tool on the School of Nursing to gain access to a much larger body of information improved the environmental impacts of our selections, as well as the performance of the building.
But our client was even more excited about the economic impacts of these decisions. An analysis comparing the base case to the final design showed that we improved the economy in Harris County, Texas, by $1.1 million through intentional design decisions.
The good news is that Greg Norris continues to improve this software. Walmart is now using the new generation of this “open source” tool, currently called “EARTHSTER,” to communicate with and improve the environmental performance of all of its suppliers. The suppliers and manufacturers can log on, describe their process, and answer a series of questions, and the tool will provide an evaluation of their environmental performance. Assuming a good evaluation, they can send it back to Walmart and qualify to be a supplier. A supplier that does not like an evaluation does not have to share it with Walmart, but EARTHSTER captures all the data. As a result, this tool will generate an open-source, Web-based database on materials.
Fortunately there is a growing family of tools and processes that one may want to consider in order to increase quality and performance or to decrease time and costs. One promising approach is called “lean construction,” which changes the relationship between the project owner, designers, and contractors by contract and stimulates a healthy dialogue and partnership among all the stakeholders. One of the things we know is that our ability to have meaningful impact on cost or quality is reduced as the project advances (Figure D.12). If quality information is available early in the project, effective decisions can be made as a collaborative team, improving the outcome dramatically.
Another process that can be utilized if one is working at the community scale (for example, on a military complex, hospital campus, or neighborhood development) is One Planet Communities.5 This is an excellent program that incorporates a systems-based approach. There are 10 areas of study (Figure D.13).
For each of these areas, the user must establish a specific goal for his or her project. Software is
___________________________
5Information available at http://www.oneplanetcommunities.org/about-2/.
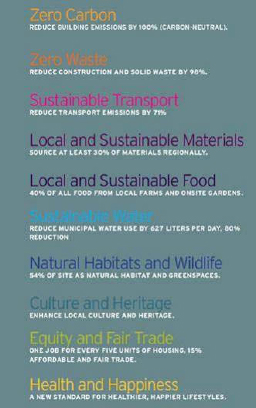
FIGURE D.13 One Planet Communities areas of study. SOURCE: Petite Rivière Regenerative Plan, April 2009.
available to help you assess possibilities during the design-alternatives period of planning, and then, once the project is complete or begins implementation, the user can receive a regular, ongoing follow-up.
One Planet Communities was originally developed by BioRegional (a not-for-profit in the United Kingdom). It was trying to create a prototype community to reduce its environmental footprint in England. At the time BioRegional calculated that if everyone lived like an Englishman, it would require three planets to provide the resources. The goal of the first project, BedZED (Beddington Zero Energy Development), was to provide quality living but reduce consumption to the equivalent of one planet. After measuring the results at BedZED, BioRegional discovered that it had fallen short of its goal and was operating at the equivalent of one and one half planets. It also realized that if resource reduction was its goal, it should be working in North America, where resource consumption is closer to the equivalent of five to six planets. So, BNIM is working on a redevelopment project in Montreal, which is a golf course surrounded by existing development and next to the rail. Over time, it will be transformed into a community with more biodiversity than existed when it was a golf course and hopefully will serve as a model for living successfully in the 21st century.
One Planet Communities, like the Living Building Challenge, is simple. Both require a shift in thinking clarity and a willingness to embrace very high goals. As Kevin Kampschroer said earlier during this workshop, “It’s about claiming the future and then living into it.” Buckminster Fuller taught me that the best way to predict the future is to design it. He also believed that we are all born geniuses, and that we are gradually “de-geniused” by our parents and our teachers. I believe these initiatives come at the perfect time for us to reclaim our genius—by improving the quality of our dialogue with better tools, better information, and inspiring one another to create 21st-century regenerative solutions.


