
SCOPE OF LIFE-CYCLE ESTIMATES
Life-cycle costs (LCC) for each of the existing and proposed space-based early warning IR systems, ground- and sea-based radar systems, and defensive layers of intercept systems are defined as consisting of development, production, and sustainment costs with the last named over a 20-yr period. For the purposes of this study, LCC is divided into these three categories to allow assessing the relative costs across the mix of interceptor and sensor system options for improving missile defense.
Development costs are the cost of engineering activities needed to design and develop baseline and block upgrades of interceptor boosters, kill vehicles (KVs), early warning sensor and radar systems, and other supporting components and infrastructure, with Missile Defense Agency (MDA) annual budget requests for funds reported as research, development, test, and evaluation (RDT&E) appropriations consistent with the military services.1
Procurement costs for the manufacture of missile interceptor KVs, early warning sensor and radar systems, and associated equipment, including, as needed, the purchasing of Aegis-class ships. Construction costs are included as part of procurement and defined as those activities required to build the physical infrastructure, including power generators and maintenance facilities, that supports a given missile defense system or ship-based radar system. Procurement cost also includes the costs of integrating the applicable systems noted above
_____________
1The breakout and definition of the three categories of cost, especially as they relate to the life-cycle cost of ballistic missile interceptors are consistent with recent Congressional Budget Office (CBO) reports on missile defense.
into the existing infrastructure.2 In addition, the procurement cost of interceptors includes the production of the total quantity committed for the inventory to achieve full operational capability (FOC).
Sustainment costs are the costs of the routine efforts to operate and maintain the system over a nominal 20-yr lifetime. Depending on the expected service life of the assets, sustainment costs can include the modification, upgrades, and/or replacement costs of procuring new systems as needed.
Following development and during the sustainment phase and for the purposes of maintaining the necessary operational proficiency, readiness, and training; sustainment costs include costs for conducting engagement exercises and missile tests, which in turn include the costs of procuring test interceptors, target missiles, parts, and so on; and the sustaining engineering costs for performing the tests, assessing the missile’s performance, diagnosing potential success and root causes of failure events as part of the overall integrated system test plans toward achieving the system’s overall operational readiness and training required.3
RELATIONSHIP OF LIFE-CYCLE COST ESTIMATES TO MDA BUDGET
For the purposes of this study, LCC are separated into development, production, and sustainment costs to enable assessing relative costs across system options for improving missile defense. It should be pointed out that through the DOD FY 2011 President’s Budget (PB), submitted to Congress in February 2010, funding for MDA included funding for production (manufacturing) and sustainment operations, all under the single budget category of RDT&E. However, MDA’s most recent budget justification materials for the FY 2012 PB submitted to Congress in February 2011, separated out what were formerly RDT&E program funds into procurement, military construction (MILCON), and the operations and maintenance (O&M) program element funds.
The basis for estimates of 20-yr sustainment costs for the MDA systems and
_____________
2To account for this cost for ground-based interceptor systems similar to the ground-based missile defense (GMD) boost-phase intercept (BPI) systems, the committee applied a factor of 40 percent to account for costs of integrating the interceptor system and subsystems into the existing infrastructure. The integration activities are assumed to include assembly, installation, and integration at the ground-based interceptor launch site comparable to the silos and other infrastructure and the missile fields at Fort Greely, Alaska (FGA). This factor of 40 percent agrees with previous CBO reports on missile defense.
3Consistent with previous CBO reports, the committee assumed that the additional number of test interceptors that need to be procured is based on one test conducted every 2 years over the 20-yr lifetime of the system. The test plan is assumed to have two purposes: (1) testing out the performance of the current system baseline design of the interceptors, which includes any improvements to the booster stages as well as to the KV propulsion and IR seeker or divert systems, and (2), from an event-driven perspective, demonstrating the capability of intercepting target missiles in scenarios mirroring threats from potential adversaries.
the associated funds required will consist of both MDA RDT&E (procurement-related) budgets and the military service’s O&M and military personnel (MILPERS) funds, with specific sustainment responsibilities identified in system-unique memoranda of agreement (MOAs). As stated by LTG Patrick J. O’Reilly, USA, Director, Missile Defense Agency, operations and support (O&S) responsibilities relate to MDA’s role in material sustainment as well as procuring replacement spares and implementing P3I modifications of fielded systems. Breakout of sustainment costs includes training costs, routine maintenance costs, operational tests, and ongoing operational integration.
“Should” vs. “Will” Cost Guidance for Bounding the Range Estimates
Consistent with the Memorandum for Secretaries of the Military Departments and Directors of the Defense Agencies issued on November 3, 2010, and effective November 15, 2010, the committee made a concerted effort to incorporate the guidance on developing “should cost” targets as one of its “sound” estimating techniques.4
The committee generated 20-yr LCC range estimates for each of the committee’s recommended systems and those recently initiated by MDA systems based on first assessing the current technical and manufacturing maturity of all the systems and then generating “should cost” estimates as the lower bound (or minimum) costs based on the following:
• Scrutinizing every element of program cost,
• Assessing whether each element can be reduced by, for example, challenging the learning curves of similar systems, and
• Applying other recently implemented or proposed industry productivity improvements as part of reducing the total costs of doing business with the government, including, for example by reducing overhead rates, indirect costs, and other contractor cost-cutting measures.
The OSD policy states that the metric of success for “should cost” management is leading to annual productivity increases of a few percent from all ongoing contracted activities as program managers execute at lower cost than budgeted. OSD policy guidance believes industry can succeed in this environment because OSD and the military services will tie better system performance to higher corporate profits and because affordable programs will be less likely to face cancellation.
This is in contrast with system costs based on a program’s “will” cost, on which the committee bases its upper bound, or maximum, estimates. These esti-
_____________
4The OSD policy on this subject is based on the guidance described in the “Drive Productivity Growth Through Will Cost/Should Cost Management” article, issued by the Defense Acquisition University (DAU) Acquisition Community Connection.
mates are focused on business-as-usual costs similar to comparable programs in the past where the requested annual budget was fully obligated and expended over time. The higher “will” cost estimate is also used as the basis of the independent cost estimate (ICE) performed by the OSD Cost Assessment and Policy Evaluation (CAPE) office for establishing program budgets that support major acquisition milestone reviews. As mentioned, the committee based these maximum cost targets on analogous systems and program expenditures over comparable acquisition phases where reasonable efficiency- and productivity-enhancing efforts were undertaken. This approach to estimating a system’s “will” upper bound cost targets is consistent with and similar to the CAPE ICE estimating methods and program budget results expected for all ACAT I programs as they advance through the major milestones of the acquisition process.
Observations on System “Should Cost” Comparisons
In looking at previously stated $71 million to $85 million average unit procurement cost for the current and projected ground-based interceptor all up round, the committee wondered how that cost compared with the cost for other weapons of comparable capabilities and complexity. It extracted costs and quantities from DOD Selected Acquisition Reports (SARs) for several programs that allowed it to compare RDT&E efforts and early unit all up missile round costs.
Several of the U.S. Navy’s Trident program SARs provided interesting data. The committee believes the Trident II D-5 and GBI all up rounds are of equal complexity except for the flight tests, which are not separately identified in either RDT&E cost. Table E-1 compares the RDT&E time frame for the GMD inter-
TABLE E-1 Comparison of GMI and Trident II Missiles
| GMD Interceptor System | Trident II (D-5) Missiles | |
| RDT&E time frame | 1998 to 2009a | 1978 to 1993b |
| Interceptor AUPC (million $) | 71-84c | 54d |
| Production lot quantity | 52 | 54 |
aThe GMD program started with NMD DEM/VAL for the BPI followed by GMD block development.
bThe Trident II program includes 3 years of concept definition, 3 years of advanced development, and 10 years of full-scale development (FSD).
cMDA provided the committee with this estimate.
dThe Trident II D-5 missile AUPC cost estimates were the most recent Program Manager’s estimates to completion (ETC) for the first weapons procurement production contracts awarded after FSD to Lockheed-Martin in March 1984 for missiles and to Hughes Aircraft in July 1989 for the electronics packages as reported in “TRIDENT II (D-5) SAR,” December 31, 1990. The AUPC also includes the Program Manager’s ETC for the Kearfott Guidance contract awarded in October 1989 for guidance packages as reported in that same document.
ceptor system, its average unit procurement cost (AUPC) in FY 2010 constant dollars, and production lot quantity to those of the Trident II D-5 missiles.
The Trident II AUPC is for an all-up round for the post-boost vehicles, stellar inertial guidance, and test instrumentation for a first production lot quantity of 54 missiles built immediately after FSD. The AUPC range estimate for GBIs is based on a total quantity of 52 missiles, of which 30 interceptors have already been fielded and produced, 20 with the original Capability Enhancement I (CE-I) KV and 10 with the Capability Enhancement II (CE-II) EKV. The remaining 22 missiles are currently being funded through FY 2016.
The lower bound, or minimum AUPC estimate for producing 52 three-stage GBIs at $71 million (based on continued funding through FY 2016), is 32 percent higher than the comparable average unit cost of 54 Trident II D-5 missiles (without the warheads) at $54 million (both in constant FY 2010 dollars).
ASSESSMENT OF MDA ONGOING PROGRAM BUDGETS AND SOURCES OF DISCRETIONARY FUNDS
This section provides MDA’s current and projected future years defense plan (FYDP) annual budget ceilings and the level of ongoing budget commitments for all the programs of record. In addition, the level of discretionary funds available that could potentially be redirected to implement changes as early as FY 2012 and the out-years is provided.
Figure E-1 provides a top-down breakout of the FY 2011 MDA budget for each of the three major system acquisition phases and costs associated with LCC. The budget for testing is separated from that for sustainment to allow comparisons with the investment budget earmarked for development for procurement acquisition phases.
Table E-2 provides further breakdown of programs considered as part of development from highest to lowest by percent of the $2.9 billion of FY 2011 funds for MDA programs of record beginning with the Aegis and ending with PTSS. Table E-2 reflects a change from the programs funded in FY 2010.
Figure E-2 displays the magnitude of the budget changes contained in the FY 2011 MDA PB submitted in February 2010. On the top bar chart, the boost segment airborne laser program has been terminated (denoted by the red bar). On the bottom bar chart, the land-based SM-3, ABIR, directed energy research, and PTSS all continue (denoted by the green bars).
Advanced Technology Programs
Of the 13 programs shown in Table E-2, at least three advanced technology programs may be considered part of what is being defined as MDA’s discretionary budget, where the investment does not appear to directly lead to a system procurement phase without first having to undergo a next-step system develop-
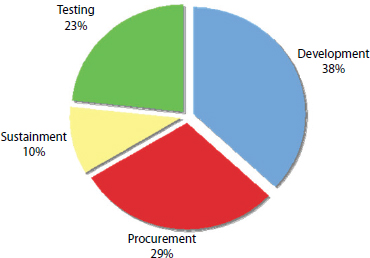
FIGURE E-1 MDA budget breakout by LCC phases. The total portfolio investment budget depicted in this figure does not include $431 million for RDT&E funds for Pentagon Reserve and MDA management headquarters nor does it include the MILCON budget or BRAC funds. The testing budget includes funds for Joint Warfighter exercises and war games but does not include funds for modeling and simulation, which were considered to be part of the development phase.
TABLE E-2 MDA FY 2011 Major Development Programs of Record
| Ballistic Missile Defense (BMD) Programs | Breakdown of Funding of Programs (%)a |
| Aegis | 29 |
| BMD enabling programs | 14 |
| Aegis SM-3 Block IIA codevelopment | 11 |
| Aegis ashore (SM-3 Block IIB) | 9 |
| C2BMC | 9 |
| GMD midcourse segment | 6 |
| Advanced technology | 4 |
| Airborne infrared | 4 |
| Directed energy research | 3 |
| Ground-based radars | 3 |
| Terminal segment of THAAD | 3 |
| Precision tracking and surveillance system (PTSS) | 3 |
| Other | 2 |
NOTE: C2BMC, command and control battle management center; THAAD, Terminal High-Altitude Area Defense.
aPortion of $2.9 billion FY 2010 funds for development.
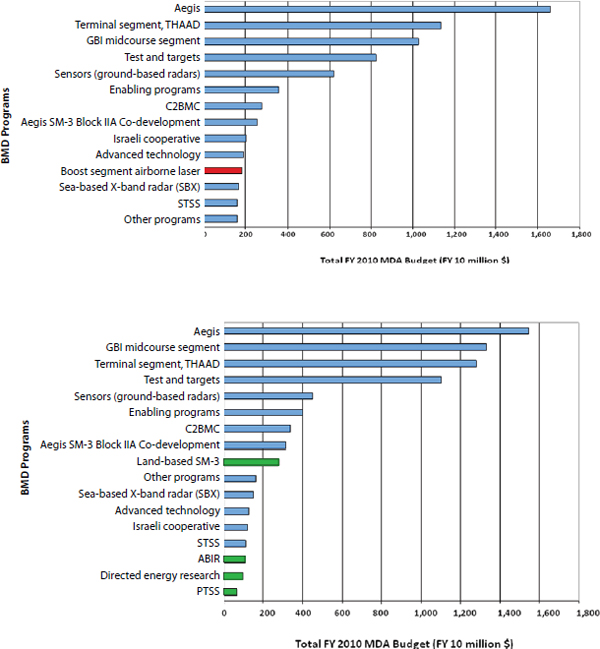
FIGURE E-2 MDA program budget changes from FY 2010 to FY 2011. GBI, ground-based interceptor; STSS, space tracking and surveillance system.
ment activity proposed by MDA and funded within the FYDP or in the next 5-yr time frame. These three programs—BMD Enabling, Advanced Technology, and Directed-Energy Research—comprise 21 percent, or approximately $600 million, of the total development funds of $2.9 billion (in FY 2010 dollars).
Approximately 14 percent of the funds are for BMD Enabling programs, which are focused on developing critical processes needed to integrate standalone missile defense systems into a layered BMD system to achieve cost and operational efficiencies by improving protection performance within increased defended areas and minimizing force structure costs.
Another 4 percent of MDA’s development budget is allocated for advanced technology efforts as a hedge against future threat uncertainties focused on funding next-generation and game-changing technologies with promising operationally cost-effective capabilities and developing and demonstrating the maturity of relevant components for future BMDS architectures.
A third development program, directed energy research, consuming 3 percent of the total MDA development budget, is focused in the near term on the following:
• Using an aircraft test platform in flight, along with ground tests, to characterize high-energy laser beam propagation and the effects of atmospheric (1) propagation and (2) boundary layer and jitter with varying engagement geometries,
• Developing and experimenting with diode-pumped gas lasers, fiber lasers, and solid-state and advanced high-power laser optics,
• Investigating lethality, counter-countermeasures, beam propagation, modeling, laser beam combining, and additional innovative areas, and
• Analyzing alternatives to select out-year laser investments.
Shifting MDA Budget Trends
In addition to advanced technology funds being a potential source of future discretionary budget, the MDA’s continuing role in procurement of Aegis systems and material sustainment of deployed THAAD systems in FY 2012 and the out-years has shifted and reduced the percent of total MDA funds earmarked from 38 percent in FY 2011 to 30 percent (proposed) in FY 2012. As displayed in Figure E-3, FY 2012 procurement funding as a portion of the total MDA budget is 10 percent higher than in FY 2011, owing primarily to a 7.5-fold increase in the Aegis FY 2011 program budget. The FY 2012 sustainment portion of the total
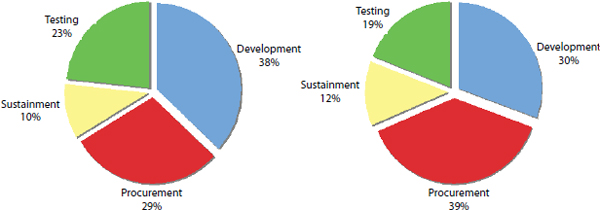
FIGURE E-3 Trends in MDA investment budget portfolio (FY 2011, left pie chart; FY 2012, right pie chart).
MDA budget is 2 percent greater than the FY 2011 budget owing primarily to an increase in THAAD total sustainment funds, which now list a separate O&M budget line item for this system.
MAJOR ESTIMATING GROUND RULES AND ASSUMPTIONS
All costs in this appendix are expressed as FY 2010 dollars.5
The system LCC for each of the options considered will be displayed as “minimum” (or low) and “maximum” (or high) range estimates. For purposes of this study, the resulting LCC estimates for the minimum or the lower bound of the range estimates represent the projected “should cost” estimates6 and are computed based primarily on the data sources and cost estimating methods described later in this appendix.
Since the system options for improving U.S. missile defense range from new, advanced technology, long-range alternatives to near-term, well-proven technology alternatives, the system cost uncertainty of proposed programs and maximum, or upper bound, cost (system “will cost”) estimates must, from a budgetary perspective, include the potential for “representative” cost growth comparable to that of interceptors, early warning IR sensor systems, and ship- and ground-based radar systems. In addition, maximum cost “estimates for systems that are defined only conceptually or that depend on the development of new technologies [could grow faster than those] for well-defined programs [that are] based on proven technologies.”7 For example, as reported by CBO and assessed by the RAND Corporation, the total development and procurement cost growth
_____________
5Costs were escalated to FY 2010 dollars using inflation rates listed in the Air Force Raw Inflation Indices Base Year (FY) 2010 table by appropriation budget categories (e.g., Total Military Compensation (3500), Operations and Maintenance (3400), RDT&E (3600), MILCON (3300), Aircraft and Missile Procurement (3010/20), Other Procurement (3080), and Fuel. The inflation rates are based on OSD Raw Inflation Rates from December 11, 2009 and were issued by the Secretary of the Air Force/FMCEE as the OPR on January 8, 2010.
6The “should” cost” and the “will” cost estimates are terms commonly used by the OSD CAPE office. “Should cost” estimates are most likely generated by program offices and will include additional contingency costs to account for the inherent uncertainty in the cost-estimating methods used and for mitigating known system-specific risks (e.g., requirements creep, program budget changes, and schedule slips).
7Congressional Budget Office. 2004. Alternatives for Boost-Phase Missile Defense, Washington, D.C., July.
for missiles averaged 43.9 percent for six programs. Development cost growth was reported to 40.6 percent with procurement at 58.5 percent.8
DOD budgets for many past and current programs of record, in particular MDA and military service funds, have already been committed as part of the FY 2011 PB submitted in February 2010 and were waiting for approval in FY 2011. In addition, the PB budget justification for the majority of RDT&E and procurement program budgets contains annual projections in the FYDP through FY 2015.
For the purposes of this study and as a ground rule for estimating the cost of potential system options for improving U.S. missile defense, there is a set of system architecture baseline systems and programs of record that are operational and undergoing testing and demonstration, already fielded, or close to providing initial operational capability (IOC) before the end of the FY 2011 FYDP in FY 2015. Since the past annual funds through the approval of FY 2011 budget have already been expended or will soon be committed for these programs of record, the committee considered this portion of the LCC of the following systems as sunk cost and did not include them in their estimates.
KEY BALLISTIC MISSILE BENCHMARK DATA SOURCES
To the greatest extent possible and where the systems were technically similar to previous systems, development and production cost estimates were based on adjusting analogous costs from data from (1) historical programs of record supplied by MDA, (2) detailed breakout of funds identified in past fiscal year budget justification sheets, and (3) open source contract award prices as documented in Defense Links.
Table E-3 is a representative reference list of MDA interceptors the committee used as the key reference data for generating its LCC range estimates along with key cost details listed in tables that follow later in this section and representative sets of parametric data values collected for each.
_____________
8For most components, the cost-risk factors that CBO used were developed by the RAND Corporation and were based on published updates reported in Joseph G. Bolten, Robert S. Leonard, Mark V. Arena, Obaid Younossi, and Jerry M. Sollinger, 2008, Sources of Weapon System Cost Growth Analysis of 35 Major Defense: Acquisition Programs, MG-670-AF, Santa Monica, Calif. Total development and procurement cost growth for missiles averaged 43.9 percent for six programs. Development cost growth was reported at 40.6 percent, with the 17.5 percent of the 40.6 percent due to requirements changes, another 4.6 percent due to schedule changes, and the majority of the remainder of 15.2 percent due to cost estimating errors. The procurement cost growth average of 58.5 percent included 13.1 percent for requirements changes, 15.5 percent for schedule changes, and 5.5 percent for quantity changes with most of the remainder of 13.9 percent due to cost estimating errors.
TABLE E-3 Representative Sources of Cost Data
| Interceptor Systems | Development (NonRecurring Cost) | Production (Recurring Unit Cost) | Annual O&S Cost | MILCON Cost |
| GMD systemsa | ||||
| GBI | NMD and GBI and test details | Booster stacks (2 vs. 3 stage), booster avionics module (BAM), EKV, IA&T, long-lead parts | Total GMD system MDA, contractor and MILPERS sustainment costs and unscheduled and scheduled maintenance costs per GBI | Missile fields, utilities and mechanical/electrical buildings |
| Silos | Part of NMD total | Missile field 2 estimates, allocated on per silo cost basis | Silo ground infrastructure | |
| IFICS data terminal | Part of NMD total | FGA configuration | Yes | |
| Ground fire control | Part of NMD total | Common to FGA and MDIOC | N/A | |
| Aegisb | ||||
| BMD 3.6.1 | ||||
| SM-3 Block IA | Combined total | Yes | Per missile | N/A |
| Ship system (AWS) | Separate total | Total only including installation cost | Per AWS | N/A |
| BMD 5.1 | ||||
| SM-3 Block IB | Separate total | Yes | Per missile | N/A |
| Ship system (AWS) | Separate total | Total only including installation cost | Per AWS | N/A |
| BMD 5.1 | ||||
| SM-3 Block IIA | Separate total | N/A | TBD | N/A |
| Ship system (AWS) | Separate total | Total only including installation cost | TBD | N/A |
| THAADc | ||||
| System | Captured in RDT&E budget documents | Total procurement cost only (includes PSE, systems integration, GSE and CFE) | Beginning in FY 2011, annual O&S cost per THAAD battery split between MDA and Army O&M and MILPERS | N/A |
| Interceptors | Part of system total | Yes | budgetsd | N/A |
| TFOC | Part of system total | Yes | N/A | |
| Launchers | Part of system total | Yes | N/A | |
| Interceptor Systems | Development (NonRecurring Cost) | Production (Recurring Unit Cost) | Annual O&S Cost | MILCON Cost |
| PAC-3 | MDA and Army RDT&E and procurement budgets and latest selected acquisition report | N/A | ||
NOTE: MDIOC, Missile Defense Integrated Operations Center; NMD, National Missile Defense; EKV, exoatmospheric kill vehicle; GBI, ground-based interceptor; IA&T, assembling, integrating, and testing; GSE, general support equipment; CFE, contractor furnished equipment; PSE, particular support equipment; O&S, operation and support; TFCC, THAAD Fire Control and Communications; AWS, Aegis weapon system.
aBenchmark cost for sea-based and ground-based X-band radar covered separately.
bBenchmark cost for SPY-1 radar covered separately.
cBenchmark cost for terminal-based TPY-2 radar covered separately.
dTHAAD O&S annual costs are divided between MDA PTSS, sustaining support, government-furnished equipment (GFE) and support equipment modifications and logistics support of the interceptors, TFCC, and launchers. The Army O&S costs are comprised of POL, GFE spares, repair parts and depot maintenance and indirect support.
ESTIMATING METHODS
Overview
The best estimating methods were selected based on compilation from one of the following:
• Analogous systems with comparable performance and/or technical parametric values or
• Cost models based on factors ranging from weight and power costs to statistically derived cost estimating relationships (CERs).
Cost models with sets of CERs were preferred; they were selected based on a set of technical parameters that best depicted and aligned with the logical set of cost drivers that directly impact the magnitude of the booster and propulsion missile system costs, missile IR seekers, ground radars, airborne and space-based EO/IR/FMV sensors, space launchers, cost per kilogram trends, and so on. In addition as part of the set of estimating methods, the committee used cost models that quantified cost sensitivity—in, for example, estimating space-based interceptors vs. ground-based interceptors and differences between airborne and space-based IR sensors.
TABLE E-4 Summary of Parametric Cost Models
| System or Subsystem | Parametric Cost Models |
| Interceptor stages | Basic rocket equations |
| Propulsion subsystems | Tecolote launch vehicle cost model |
| NASA Marshall Space Flight Center (MSFC) Launch Vehicle Cost Modela | |
| IR seekers | Galorath SEER-hardware and electro-optical systems (EOS)b |
| Airborne platforms | RAND DAPCA modelc |
| Space-based platforms | Tecolote unmanned spacecraft cost model (USCM)d |
| Aerospace small satellite cost model (SSCM)e | |
| Radar | Technomics ground-based radar cost modelf |
| Electro-optical sensors | Galorath SEER-hardware and electro-optical systems (EOS)b |
| Launch service costs | American Institute of Aeronautical Engineers (AIAA) International |
| Launch Vehicle Systems Handbook, 4th editiong |
aTecolote Research, Inc. 1996. NASA MSFC, Launch Vehicle Cost Model, PRC Service, CR-0734, August 23. CERs for solid rocket motor, liquid rocket engines, solid fuel systems, and so on.
bGalorath SEER-electro-optics (EO) parametric cost model.
cRAND Corporation, DAPCA aircraft cost model.
dUSAF Unmanned Spacecraft Cost Model, eighth edition.
eAerospace Corporation, 2002, Small Satellite Cost Model (SSCM).
fTechnomics ground-based radar cost model; CERs taken from J. Horak, J. Harbor, and C. Holcomb, “Integrating Performance and Schedule Analysis with Acquisition Costing for Ground-Based Radars,” presentation to the committee, February 18, 2010.
gAIAA, 2003.
Development Costs
In general, the primary approach used in estimating the rough order of magnitude of development costs was based on an analogous method where feasible. This approach relied on parametric cost models when needed or on a cross-check to ensure the overall reasonableness of the estimates. The parametric cost estimates used for both development and production cost estimates is summarized in Table E-4.
The analogous estimates were computed using historical costs from comparable systems and escalating them to FY 2010 constant year dollars. The costs were then adjusted based on applying an aggregate set of complexity factors primarily driven by a top-down subsystem, and estimates might be lower because of the extent to which the new system could leverage the technical design, engineering, and manufacturing heritage. The heritage assessments were expressed in terms of technology readiness levels (TRLs) or manufacturing readiness levels (MRLs), widely used indexes of maturity.9
_____________
9William L. Nolte, USAF Air Force Research Laboratory (AFRL), Sensors Directorate. 2007. Hardware and Software Transition Readiness Level Calculator, Version 2.2, March 9. Available at www.acq.osd.mil/jctd/TRL/TRL%20Calc%20Ver%202_2. Accessed August 28, 2012. See also William L. Nolte, USAF AFRL, Sensors Directorate, 2002, AFRL Technology Readiness Calculator, October. Available at www.dtic.mil/ndia/2003systems/nolte2.pdf. Accessed August 28, 2012.
Production Costs
In general, the total production cost of each interceptor is calculated by estimating the first unit cost of each major component of the system and then by estimating the cost of assembling, integrating, and testing (AI&T) those components into the first interceptor off the production line. The components include the booster stage(s), avionics (electronic communications and navigation systems), the KV, and, for mobile interceptors, the launch canister. Unless there was a comparable early warning IR sensor, radar, or interceptor with known unit production cost details, the costs of the majority of the relatively new systems were based on system, subsystem, or lower level CERs from the parametric cost models listed in the above table.
Specifically, the booster portion of the interceptor costs that were not part of the MDA programs of record were estimated using a CER based on the total impulse (thrust multiplied by burn time) of each stage of a booster and other technical parameters to calculate the cost of the first production model of the booster. Costs for the booster’s avionics and KV’s avionics, divert attitude control system (DACS), thrusters, and other hardware were estimated with the Air Force Unmanned Spacecraft Cost Model (USCM). USCM uses CERs based on the mass of various components. In addition, the space-based interceptor satellite configured with a lifejacket was estimated using USCM at the subsystem level.
“Wrap” factor percentage values were also applied for estimating the costs of IA&T for components, subsystems, or systems by adding the costs and applying a percent value to the total cost of an interceptor. Where applicable, a wrap factor percentage was also applied for estimating the cost of government systems engineering and project management (SEPM), which would add another 30 percent. The percentages and values applied in the roll-up of an interceptor (as well as other sensor system costs) are consistent with CERs most commonly used for such work.
As in the 2004 CBO report, “costs for the [remaining new] interceptors that would be purchased under each option were estimated by analyzing trends in actual costs for the ground-based” interceptors that MDA has recently purchased.10 The average unit procurement costs computed for multiple interceptors reflects the impact of total manufacturing labor hours and of cost efficiencies of discounts on material quantities on the cost of the first interceptor or other system firsts. Costs would decrease as a function of the quantity produced within an assumed continuous single manufacturing run or of the inefficiencies of reopening and restarting a manufacturing line to procure more replacement interceptors. The estimate of unit production cost of additional interceptors is based on the learning curve, or cost improvement curve (CIC), or on a slope of the historical unit
_____________
10Congressional Budget Office. 2004. Alternatives for Boost-Phase Missile Defense, Washington, D.C., July.
production cost of analogous interceptors as a function of quantity produced.11 Details are provided in the next section of this appendix of the computed unit production cost for Aegis SM-3 Block IA and THAAD interceptors.
Sustainment Costs
Except for space-based interceptors (SBIs), the majority of the sustainment cost estimates are based on average annual O&S system costs provided by MDA and military services’ program offices. As needed and for completeness, the average annual O&S costs for systems already delivered and fielded were estimated by the committee and cross-checked against the total MDA portions of the RDT&E program budget justification sheets, where material sustainment-related activities were specified and the military services (i.e., Navy for Aegis and Army for Patriot) O&M system program budgets and associated military personnel (MILPERS) funds were clearly identified at the system and operating unit levels. For SBIs, the sustainment costs were based on an average on-orbit life for each SBI satellite of 7 years and included procurement replacements and launch costs to maintain full operational capability (FOC) over the 20-yr service life. The annual operating costs for ground mission control were based on previously estimated costs from the 2004 CBO report escalated to FY 2010 dollars.12
LIFE-CYCLE COST DETAILS ON MDA NEW SYSTEMS
Aegis SM-3 Block IIA and Aegis Ashore Systems
In the FY 2012 PB, MDA requested an RDT&E total budget of $2.7 billion through FY 2016 (in FY 2010 constant dollars) for the SM-3 Block IIA interceptor system and another $350 million for the Aegis Ashore program for the procurement of the first 15 Block IIA interceptors. First delivery of Block II interceptors is expected in FY 2019. Projecting forward, the committee estimated 20-yr LCC that includes the requested budget to account for the potential deployment of these latest Aegis interceptors at both ship-based locations in the Persian Gulf and land-based European or Middle East sites.
Table E-5 lists the total 20-yr LCC estimates for improved ship-based and land-based Aegis SM-3 Block IIA interceptors.
In addition to these sites with large coverage capability against Iranian IRBM/MRBM threats, a number of THAAD and/or PAC-3 batteries will also be needed for close-in defense against SRBMs near the forward perimeter of the
_____________
11The learning curve, or CIC slope, value of, for example, 95 percent, quantifies the cost reduction associated with doubling the number of interceptors being purchased and reduces the average unit cost of the lot buy of interceptors by about 5 percent.
12Congressional Budget Office. 2004. Alternatives for Boost-Phase Missile Defense, July, Washington, D.C.
TABLE E-5 Improved Aegis SM-3 Block IIA Interceptor System LCC Estimates (FY 2010 billion dollars)
| Minimum | Maximum | |
| Developmenta | 2.0 | 3.0 |
| Procurement | See above | See above |
| Force quantity buyb | Projected SM-3 Block IIA, quantity = 56 (mix of either two dedicated Aegis ships or two land-based sites) | |
| MILCON | 0.10 | 0.10 |
| 20-yr O&Sc | 3.9 | 4.4 |
| Total | 6.0 | 7.5 |
aBased on the MDA FY 2012 FYDP RDT&E PM SM-3 Block IIA codevelopment and Aegis Ashore program budgets from FY 2010 through FY 2016. The development cost also includes the delivery of 29 SM-3 Block IIA interceptors covered as part of the RDT&E interceptor co-development program budget through FY 2016 and an additional procurement budget buy of 15 SM-3 Block IIA interceptors. The average unit cost of the SM-3 Block IIA missile round was listed in FY 2014 at $24.3 million.
bThe procurement cost included in the development estimate is based on a force quantity buy of 48 operational SM-3 Block IIA missiles and an additional 8 test interceptors.
cThe SM-3 Block IIA system O&S estimates are based on continuous operational readiness of 48 SM-3 Block IIA interceptors on a mix of two dedicated Aegis ships in either the Persian Gulf or at two Middle East fixed land sites with 24 operational missiles plus test interceptors at each location, all over a 20-yr sustainment period.
defended zones. The 20-yr LCC summary estimates for these two systems are provided later in this appendix for THAAD and for Army PAC-3/MSE systems.
Aegis SM-3 Block IIB
MDA is requesting in the FY 2012 PB an RDT&E total budget of $1.6 billion through FY 2016 (in FY 2010 constant dollars) for the SM-3 Block IIB interceptor system program of record. Since the SM-3 Block IIB program beginning in FY 2011 is in an early technology development phase, MDA has awarded three contracts with potential prime contractors to define missile concepts, assess technology risk, and complete system-level trade studies in preparation for the product development phase, which is not scheduled to begin until FY 2013.
Even though previous performance interceptor funding combined with the propulsion technology content was used for the SM-3 Block IIB new program of record, it is too early in the acquisition to determine if the design baseline will focus on maturing the key component technologies to TRL values of 5 or 6 for increasing the speed of the missile (using lighter weight structures and materials to reduce inert mass) and ensuring the flexible energy management needed to effectively engage targeted ballistic missiles early in their trajectory. Other opportunities in the design trade space could include investments in advanced seeker technologies to increase KV acquisition range thus improving threat missile containment.
The engineering trade space includes alternative configurations for the booster to enable higher burnout velocities; larger diameter missiles and resulting modifications to the MK41 VLS launcher, rocket propellants, missile structures, control mechanisms, and missile communication concepts to enable communication with multiple sensors over several frequencies; and the kinetic warhead seeker and the kinetic warhead DACS. Another key aspect of the trade studies and technology development is to analyze and define a larger canister and missile threat that is compatible with the MK 41 launcher used on Aegis ships to ensure compatibility with Aegis Ashore and Afloat. This comprehensive strategy of technology investments to reduce risk, exploit technology opportunities, and engage industry early will provide the foundation for executable plans for the product development phase.
Given the current consideration of several land-based SM-3 Block IIB interceptor designs within the solution space from the original SM-3 Block IIB designs and projecting forward to a higher performance next-generation Aegis missile system (NGAMS), the committee estimated 20-yr LCC ranges to account for the technical risk and cost uncertainty in potential deployment of these latest AEGIS interceptors at land-based European sites.
Table E-6 lists the 20-yr LCC estimates for land-based SM-3 Block IIB interceptor systems for one dedicated European fixed site.
TABLE E-6 Land-Based SM-3 Block IIB System 20-Yr LCC Estimates (FY 2010 billion dollars)
| Minimum | Maximum | |
| Developmenta | 5.3 | 13.7 |
| Procurement | See above | See above |
| Force quantity buyb | Projected SM-3 Block IIB, quantity = 28 (one dedicated European land site) | |
| MILCONc | 0.10 | 0.10 |
| 20-yr O&S | 3.8 | 5.5 |
| Total | 9.2 | 19.25 |
aThe total development cost is based on total MDA FY 2012 RDT&E PB budget from FY 2011 through FY 2016 requested for the (1) land-based SM-3 Block IIB program, (2) BMD advanced technology development funds that were transferred to this program beginning in FY 2012, and (3) additional projected cost the committee estimated for extending the development phase for the lower bound, or minimum, total cost to FY 2019 and the upper bound, or maximum, total cost with the development program extended to FY 2021 and beyond.
bThe procurement cost included in the development estimate is for a total force buy quantity for defending U.S. and European allies and U.S. deployed forces from an Iranian ballistic missile attack based on a total buy quantity of 28 SM-3 Block IIB missiles: 24 operational missiles and 4 test interceptors, ground-based launchers, fire control units, and C2BMC terminals at a single dedicated European land-based site.
cThe MILCON cost is based on the MDA FY 2012 PB MILCON budget requested for the construction cost of a land-based SM-3 launch facility in the FY 2013 time frame.
Total SM-3 Block IIB interceptor system O&S estimates are based on the costs for continuous operation readiness, testing and sustainment at one land-based European site for maintaining the 24 operational missiles and remaining test assets over a 20-yr period.
ABIR Systems
Life-Cycle Cost Summary
The 20-yr LCC range estimate for the ABIR system is summarized in Table E-7.
TABLE E-7 ABIR System Total LCC Estimate (FY 2010 billion dollars)
| Minimum | Maximum | |
| Developmenta | 1.4 | 1.9 |
| Procurementb | 0.3 | 0.7 |
| Force quantity buyc | Three 24/7 CAPs of 3 + 1 spare or four mission-capable | |
| Reapers and a ground station per | CAP | |
| Total inventory of 12 vehicles for a notional annual use of up to 90 days per yr | Total inventory of 17 vehicles for a surge demand of up to 270 days per yr | |
| MILCON | 0.03 | 0.06 |
| 20-yr O&Sc | 2.6 | 2.8 |
| Total 20-yr LCC estimate | 4.2 | 5.4 |
NOTE: CAP, combat air patrol.
aThe development cost estimate of between $1.4 billion and $1.9 billion is based on the MDA total investment in the ABIR program from FY 2011 through FY 2016 of $342 million as stated in the MDA FY 2012 FYDP and projected forward for another 9 to 14 years from FY 2023 through FY 2030 to complete EMD through full operational testing and continuing until go-ahead into the production phase. (Of the $342 million in the ABIR program budget through FY 2016, $312 million is for the RDT&E development program and $30 million is MILCON budget for the construction of an ABIR facility in FY 2014.)
In addition, the development range estimates includes the cost of designing, integrating, and testing five fully configured flight test articles at a lower bound, or minimum, average unit procurement cost (AUPC) of $21.5 million for Reaper MQ-9Bs configured with an as-designed MTS-B sensor coming off the production line or at an upper bound, or maximum, AUPC of $24.5 million for a slightly modified MTS-B. The range for each ABIR system flight test article also includes an onboard processor and communications link to the C2BMC needed for satisfying and demonstrating the unique missile tracking performance required for the ABIR mission. The committee also estimated the AUPC of five sets of Reaper MQ-9 ground systems at $10 million each (in FY 2010 dollars) to be delivered along with airborne vehicles during the development phase. (Each Reaper ground system includes the procurement of hardware for the Reaper launch and recovery element for landings and takeoffs and the mission control station (MCS) for operating the vehicles once at cruise altitude and in on-station CAP orbits. The MCS includes the hardware and software interfaces to enable Reaper’s ground operators to monitor the health and status of the airborne C2BM communications downlinks and ensure the integrity and timely transmission of the airborne IR sensor missile tracking data that is being routed to the nearest C2BMC and the designated interceptor’s fire control radar.)
bFor the follow-on production phase in FY 2023 to FY 2030, the procurement cost range estimate of between $300 million and $700 million is based on an ABIR system AUPC range for the force-level quantity of between 12 and 17 airborne systems. The committee based its procurement minimum cost estimate for an ABIR sensor AUPC integrated on a Reaper MQ-9B airborne vehicle configured with a modified MTS-B sensor at a lower bound, or minimum, AUPC estimated at $21.4 million for a lower bound force size of 12 airborne systems. The committee based the procurement maximum cost estimate for the same ABIR sensor AUPC integrated on a Reaper MQ-9B airborne vehicle configured with a notional repackaged, smaller, lighter, reduced-power-version of the pod-mounted Heimdall sensor as an alternative candidate IR sensor, also integrated on a Reaper MQ-9 airborne vehicle with a minimum AUPC estimate of $37.9 million for a higher force-level quantity of 17 systems. (The modified Heimdall sensor unit cost is based on a further weight, volume, and power reduction over the envisioned modifications needed for the Global Hawk RQ-4B. Further details on the earlier use of the Heimdall sensor and the basis for the modified version of this sensor are provided in a previous section of this appendix, “Aegis SM-3 Block IIA and Aegis Ashore Systems.”) Finally, the procurement cost also includes three ground systems at $10 million each required for operating three CAPs at separate outside the continental United States (OCONUS) forward-deployed bases.
cThe 20-yr O&S cost range estimate represents the steady-state annual O&S costs on a per CAP basis for operating and sustaining the ABIR systems and the ground segment operations centers out of a forward-deployed OCONUS base across the range of a force size inventory of up to (1) 12 systems for an average annual surge of CAP operations for 90 days, estimated at an annual cost of approximately $42 million per CAP and (2) up to 17 systems for a higher annual surge of CAP operations for 270 days, estimated at an annual cost of approximately $47 million per CAP.
The basis for the forward-base locations, time to station, and other details used to compute the number of ABIR-configured Reapers to sustain a 24/7 CAP and the total force inventory quantity range of ABIR-configured Reapers needed for nominal and surge demand conditions are provided later in this section.
Previous Relevant Investments
As part of the potentially relevant (and technically relevant) proof-of-concept investment activities that preceded MDA submitting a budget for FY 2011 budget through FY 2015 for the new start ABIR program in February 2010, MDA has an on-going Airborne Sensor (ABS) program. The ABS program issued a request to industry in May 2009 for going forward with a 5-yr effort to continue “operation and sustainment of the MDA airborne sensors and platforms used to support the BMDS test program.”13 At that time, the contractor that won the award would
… be required to perform mission operations, aircraft test operations, and aircraft maintenance [on four] airborne sensor systems currently operated by
_____________
13Airborne Sensor Program (ABS) Sources Sought, FBO Daily, May 22, 2009, FBO #2734, Notice date May 20, 2009, available at http://www.fbodaily.com/archive/2009/05-May/22-May-2009/FBO01824078.htm. Accessed June 14, 2012.
MDA[:] the High Altitude Observatories (HALO I, II, and III) and the Wide-body Airborne Sensor Platform (WASP) aircraft….
The HALO I is a Gulfstream IIB aircraft with multiple sensors viewing through optical windows, used for data collection in the visible through long-wave IR (LWIR) spectral regions. Four sensor stations accommodate a mix of user-defined sensors in three gimbaled-mirror pointed platforms and one fixed-mirror pointed platform. HALO II is also a Gulfstream IIB aircraft with a cupola mounted atop the fuselage that allows for open port viewing with a multiband sensor system to collect radiometric and photo documentation data in the visible through LWIR spectral regions. HALO II also allows for window viewing by cabin sensors. HALO III is a Gulfstream IISP aircraft that serves as the airborne diagnostic target (ADT) for the Airborne Laser program. It includes a wing-mounted sensor pod, plume emulator, target board, various beacon lasers, and ADT system control and situational awareness hardware. WASP is a DC-10 aircraft modified with three pressure vessels to allow open port or closed cabin optical window sensor viewing. WASP will accommodate a prime sensor system (PSS) for data collection and guest captive-carry seeker/sensor systems. The WASP PSS is similar in design and capability to the HALO-II primary sensor.14
Furthermore, as a precursor to the ABIR program, the ABS program’s industry solicitation also stated that “as future requirements emerge, MDA may add additional aircraft, additional sensors, develop new sensor systems, and/or modify sensor/mission support systems onboard the current [MDA] aircraft…. [MDA stated that] the intended outcome of this [solicitation was] to [both] determine interest and capability in supporting the ABS program and to identify acquisition alternatives that may warrant further study and review.”15
In going forward and as part of its justification for the ABIR budget, MDA stated that in order “to address the looming threat of regional forces in large numbers, [it had] aligned [its] technology investments with [the objective of uncovering] gaps in [the] ability to (1) address large raid sizes and (2) intercept the enemy early in [its] trajectory [and] when the enemy is most vulnerable[:] assess[,] then reengage if necessary.”16
In addition, to potentially leverage the relevant airborne IR and optics technology from the ABS program, MDA had prior to February 2010 “demonstrated the ability of IR sensors carried aboard Navy Reaper unmanned aerial systems to observe ballistic missiles in-flight at long distance during the “Stellar Daggers” test in Hawaii and the Delta II launch in California. The impressive results of
_____________
14Ibid.
15Ibid.
16As reported in MDA, FY-2011 FYDP Research, Development, Test & Evaluation, President’s Budget, Exhibit R-2, RDT&E Budget Item Justification, BA 4: Advanced Component Development & Prototypes (ACD&P), PE 0604884C: Airborne Infrared (ABIR), February 2010.
these tests lead [MDA] to believe that airborne sensors can be an effective component of the Ballistic Missile Defense System as early as 2015.”17
Going forward, the MDA total investment in the ABIR program, $477.1 million (FY 2010 dollars) reflects the average annual budget, $95.4 million (FY 2010 dollars), for the technology development effort to prove the airborne sensor capabilities and allow the operational assessment and proof of capability needed to detect ballistic targets and achieve early intercepts by conducting a series of ground and flight tests through FY 2012. Specifically, MDA stated that
these demonstrations [will] incrementally prove the key functions of an airborne infrared sensor:
• Acquisition of a threat based on a cue from overhead persistent infrared satellites;
• Tracking of a threat throughout its flight;
• Generation of a two-dimensional track prediction of the threat’s flight path based on a single airborne sensor;
• Fusing multiple two-dimensional tracks into a three-dimensional track with sufficient accuracy to launch an interceptor; and
• Delivering this information through the C2BMC system to the shooter….
In FY 2010, [MDA] began assessing platform and sensor alternatives with MIT’s Lincoln Laboratory and partners at the Joint Integrated Air and Missile Defense Organization. This effort [pointed] the way to the [airborne] vehicle most suited to fill this role among a group of candidates including the currently deployed MQ-9 Reaper and the RQ-4 Global Hawk. At the same time, [MDA] [engaged the] Joint Forces Command and the COCOMs to develop a concept of operations for adding this mission to the [DOD’s] unmanned aerial systems fleet.18
The alternatives for the most likely platform and sensor combination were based on a cost-effectiveness assessment of the sensor’s performance, target auto tracking, and raid handling capacity and on the airborne systems’ secure communications data link capability to accurately transmit IR sensor data with low enough latency to enable C2BMC and BMDS interceptors to complete ballistic missile engagements.
Plans going forward include
computer-in-the-loop to hardware-in-the-loop experiments to incrementally verify and validate [the] functionality [of the airborne sensor’s effective field of regard. According to MDA, these experiments [will] culminate in Aegis intercept flight tests using primarily airborne sensors for fire control at the Pacific Missile Range Facility in Hawaii [planned for] the summer of 2012. This testing,
_____________
17Ibid.
18Ibid.
interspersed with regular campaigns in theater, [leads] to [MDA’s plans for] an operationally useful architecture as early as [FY] 2015.19
As for estimating the recurring unit costs of the airborne platform and IR sensor mix system quantities, the planned schedule reported in the FY 2011 MDA ABIR program budget of February 2010 called for the first delivery of platform and ground station in the third quarter of FY 2011, followed by four other platforms and ground stations in 1-yr increments through FY 2015. MDA planned on modifying the first and second long lead in the first and fourth quarters of FY 2011. Since the program was to start in the first quarter of FY 2011, the committee assumes these airborne IR sensors are most likely MTS-B sensors already in production or a modified version of the MTS-B sensor. For estimating purposes, two other near-term key milestones are the launch of an ABIR system for performing an airborne sensor risk reduction demonstration, set for the third quarter of FY 2012, and plans for an acquisition procurement milestone decision by the second quarter of FY 2012 to procure operational assets for fielding in FY 2015.
MDA Force-Level Quantities
For the purposes of estimating a recurring cost range for a representative unit during the procurement phase, the committee assumed a total MDA force-level quantity of at least 12 and a maximum of 17 airborne systems and the necessary three sets of ground stations that would be capable of sustaining eight mission-capable systems or primary authorized aircraft (PAA) operationally available for providing persistent 24/7 missile tracking coverage of up to three CAPs or one system per CAP. Each CAP and the two or three requisite PAA-designated systems are capable of being prepositioned and/or forward-deployed well in advance of the threat at OCONUS military bases located within a reasonable operating system range of the expected area of regard and within the effective range of the IR sensor for performing the missile tracking mission. The total force-level quantity also includes the procurement of three spares or backup inventory (BAI)-designated systems that are available as needed and colocated with each of the other PAA systems at one of the three OCONUS bases. The BAI-assigned ABIR systems are configured with the same airborne IR sensor as the PAA aircraft and are needed to maintain persistent operational coverage and used for replacing PAA-designated systems either in transit from the CAP back to the forward-deployed squadron or not operationally available until field maintenance is completed. Finally, based on a notional surge capability of three continuous CAPs on station for between 90 days and 270 days per year, the minimum and maximum range estimates of the total force-level quantity of ABIR systems is also based on procuring anywhere from one to six additional aircraft designated as attrition
_____________
19Ibid.
TABLE E-8 Projected Force-Level Quantities for ABIR Systems
| Force-Size Parameters | Reaper MQ-9 |
| Representative distance base to CAP (mi) | 621.4 |
| Cruise speed (mph) | 175 |
| Notional endurance (hr) | 32.0 |
| One-way transit to fly-out and back (hr) | 7.2 |
| Time on station (hr) | 24.8 |
| Total flight hours per sortie | 32.0 |
| Sorties per day per CAP | 1.0 |
| Number of CAP forward-operating base locations | 3 |
| Total sorties per day | 3 |
| Sorties per day per aircraft | 1 |
| Total number of PAA-designated aircraft employed | 3 |
| BAI-designated aircraft per location | 1 |
| Minimum total force size of ABIR systems (assumes no attrition) | 6 |
| Force flight hours per day (three CAPS) | 72 |
| Case 1: 90-day continuous three CAPS operation | |
|
Total annual flight hours for 90-day surge |
2,160 |
|
Average annual PAA-designated flight hours per aircraft per year |
360 |
|
Attrition rate per 100,000 flight hours |
2.0 |
|
Life-cycle flight hours (over assumed 15-yr service life) |
32,400 |
|
Number of attrition reserve for 90-day surge (over 15 yr) |
1 |
|
BAI-designated aircraft |
3 |
|
Minimum total force size (with attrition) |
10 |
| Case 2: 270-day continuous three CAPs operation | |
|
Total annual flight hours for 270-day surge |
19,440 |
|
Average annual PAA-designated flight hours per aircraft per year |
3,240 |
|
Attrition rate per 100,000 flight hours |
2.0 |
|
Life-cycle flight hours (over assumed 15-yr service life) |
291,600 |
|
Number of attrition reserve for 270-day surge (over 15 yr) |
6 |
|
BAI-designated aircraft |
3 |
|
Maximum total force size (with attrition) |
15 |
reserve inventory and needed to replace PAA systems due to operational attrition or other accidents, assuming, on average, the loss of two systems every 100,000 flight hours, where an in-flight accident occurred and/or the system was declared inoperable and too expensive to repair.
Table E-8 provides the ABIR system force-level quantity range estimates based on an average cruise speed of 175 mph at 40,000 ft and an average operational endurance of 24 flight hours per sortie.
System Acquisition Costs
Table E-9 summarizes the committee’s estimate of the ABIR System T1 recurring cost of the first of five airborne systems used during the development phase through FY 2015 for flight testing demonstrations and the projected
TABLE E-9 ABIR System AUPC Estimate During the Development Phase (FY 2010 million dollars)
| ABIR System T1 Estimate | |
| Reaper MQ-9 unit flyaway price | 15.2 |
| MTS-B sensor unit cost | 0.9 |
| Onboard mission processor and BLOS C2BMC | 0.4 |
| System AI&T (30 percent factor) | 5.0 |
| Total ABIR T1 cost | 21.5 |
cumulative average recurring unit costs for the procurement phase. The committee assumed that after FY 2015 the five flight test systems used during the development phase would end up being colocated at existing CONUS-based military test and training bases and used as test bed platforms for flight testing upgrades to an improved version of the MTS-B sensor and/or as a new, possibly more capable IR sensor for performing ballistic missile tracking missions on the Reapers acquired during the production phase.
For both the development and the procurement phase, the committee estimated the ABIR system AUPC for five flight articles and a production quantity of between 12 and 17 based on MDA’s preferred airborne platform, the Reaper MQ-9. The cost baseline for the MQ-9 unmanned aircraft vehicle is configured without mission payload hardware and includes avionics and flight controls.
For the 5-yr development phase currently funded in the FY 2011 budget through FY 2015, the committee estimated the IR sensor AUPC based on the first sensor delivered for the first Reaper to be an as-designed MTS-B sensor coming off the production line with a combination of either additional MTS-B sensors procured for the other four flight test airborne vehicles or a slightly modified version of the MTS-B designed to more closely satisfy and demonstrate the unique missile tracking performance needed for the ABIR mission. In addition, the costs for adding an onboard mission processor and C2MB communications to the Reaper MQ-9 are also included along with AI&T of each ABIR system.
For the follow-on production phase beginning after FY 2015, Table E-10 lists the ABIR AUPC range estimate for the force-level quantity of between 12 and 17 airborne systems. The committee based its range estimate of the ABIR sensor average unit cost on a modified MTS-B sensor as a lower bound for the lower bound force size of 12 airborne systems. As an upper bound recurring cost and as a potential hedging strategy for meeting the expected missile tracking requirements, the committee estimated the unit recurring cost of a notional repackaged and smaller, lighter, and reduced-power version of the pod-mounted Heimdall sensor (compared to the option MDA had considered as a candidate IR sensor for the Global Hawk RQ-4B). (The full-scale Heimdall sensor was originally designed for and is currently being used on the HALO II manned ABS testbed aircraft.) It should be noted that this upper bound, higher ABIR system recurring
TABLE E-10 ABIR System AUPC Estimate During the Production Phase (FY 2010 million dollars)
| ABIR System AUPC Estimate | ||
| Low (Quantity = 12) | High (Quantity = 17) | |
| Reaper MQ-9 unit flyaway pricea | 15.2 | 15.2 |
| Modified MTS-B sensor unit costb | 1.2 | |
| Modified Heimdall sensor unit costc | 11.8 | |
| Onboard mission processor and BLOS C2BMC | 0.1 | 0.1 |
| System AI&T (30 to 40 percent factor)d | 4.9 | 10.8 |
| Total ABIR AUPC cost | 21.4 | 37.9 |
aIn the FY 2011 through FY 2015 time frame, the Reaper MQ-9 unit fly-away price is based on the assumption that MDA will be able to procure the as-is designed green aircraft off the contractor’s manufacturing line fully configured with the flight controls, avionics, and other equipment to flight qualify the system. The price also included the communication system links for operating the unmanned vehicle through ground operators at the launch and recovery unit and the missions control station and also for transmitting the IR sensor data through MDA’s C2BMC and on to a designated interceptor’s fire control radar. After FY 2015 MDA will be procuring identically configured Reapers coming off a mature, continuous production line, where it assumed the learning or cost improvement factor is relatively flat and affords relatively small savings per system as the total quantity manufactured increases.
bThe modified MTS-B sensor is based on a more complex design than the MTS-B that provides additional IR capability to meet the mission-unique requirements for performing the missile tracking mission.
cThe modified Heimdall sensor unit cost is based on a further weight, volume, and power reduction over the envisioned modifications needed for the Global Hawk RQ-4B. ABIR system analysis alternatives performed for MDA indicated that the Heimdall sensor suite and real-time signal processors onboard the HALO II aircraft can be transplanted to fit within a configured green aircraft version of the Global Hawk RQ-4B without any other mission equipment. However, the RQ-4B airframe must be able to accommodate the weight load of the pod and the necessary onboard electronics. Given the existing RQ-4B onboard power and air cooling and further modifications needed, the total weight load on the RQ-4B of a pod-modified Heimdall sensor was estimated at between 2,000 lb and 2,800 lb, with more than 700 lb of this weight attributable to the optical sensor, the platform, and the mission equipment suite itself.
dThe factor for IA&T for the Heimdall IR sensor is higher, 40 percent, than that for the modified MTS-B sensor reflects because the recurring costs of electrical and mechanical interfaces to install this heavier sensor and still meet the platform’s center of gravity and reduced drag requirements will be higher.
cost estimate would most likely require additional development funds to cover the cost for modifying the Reaper airframe to carry the load of the larger pod-mounted IR sensor and still meet the aerodynamic performance and required high endurance of the vehicle. The upper bound estimate is also based on the higher force-level quantity of 17 systems.
The committee also estimated the average unit cost of five sets of Reaper
MQ-9 ground systems at $10 million each (FY 2010 dollars) to be delivered along with airborne vehicles during the development phase. Since this procurement relies primarily on off-the-shelf computer workstations, processors, and communication equipment, the committee estimated the cost of operating three CAPS at separate OCONUS forward-deployed bases would remain at $10 million each for the procurement of three ground systems required during the production phase. Each ground system requires the procurement of hardware for the Reaper launch and recovery element (LRE) for landings and takeoffs and for the mission control station (MCS) for operating the vehicles once at cruise altitude and for on-station CAP orbits. The MCS includes the hardware and software interfaces to enable Reapers’ ground operators to monitor the health and status of the airborne C2BMC downlinks and to ensure the integrity and timely transmission of the airborne IR sensor missile tracking data to the nearest C2BMC and the designated interceptor’s fire control radar.
System O&S Costs
Finally, Table E-11 provides a rough order-of-magnitude range estimate for the steady-state annual O&S costs on a per CAP basis for operating and sustaining the ABIR systems and the ground segment operations centers out of a forward-deployed OCONUS base for force sizes of 12 systems (for an average annual surge of CAP operations for 90 days) and 17 systems (for a higher annual surge of CAP operations for 270 days).
TABLE E-11 ABIR System Average Annual Sustainment Cost for Force Sizes of 12 and 17 for Three CAPS (FY 2010 million dollars)
| ABIR (Reaper MQ-9) Average Annual O&S Costs per CAP | ||
| 12 | 17 | |
| Unit level manning | 13.58 | 13.58 |
| Operation and consumptiona | 10.10 | 14.31 |
| Nonoperating unit maintenance | 1.07 | 1.07 |
| Sustaining support and investment | 15.03 | 15.03 |
| Indirect and other costs | 2.84 | 2.84 |
| Total average annual O&S cost per CAP | 42.63 | 46.84 |
aThe annual O&S cost per CAP for the large force size of 17 systems and the associated higher average annual flying hours per CAP case is the only O&S cost element that directly affects the magnitude of the ground operations and spare parts consumption costs at both the field and depot levels of maintenance. All the other O&S costs elements for the manning levels at the forward-deployed OCONUS squadrons are assumed to be fixed for both cases, along with the other three cost elements listed.
TABLE E-12 PTSS Total LCC Estimate (FY 2010 billion dollars)
| Minimum | Maximum | |
| Developmenta | 3.1 | 4.5 |
| Procurementb | 4.4 | 6.9 |
| Force quantity buy | 9-ball constellation + two on-orbit spares with 7 yr on-orbit life | 12-ball constellation + two on-orbit spares with 5 yr on-orbit life |
| MILCON | None required | None required |
| 20-yr O&Sc | 10.7 | 25.6 |
| Total 20-yr LCC estimatec | 18.2 | 37.0 |
aThe development cost range estimate of $3.1 to $4.5 billion includes the PTSS program budget of $1.3 billion cited in the MDA FY 2012 FYDP PB, which consists of a 1-yr concept development phase beginning in FY 2011 awarded to three contractors followed by a Phase I effort with plans for developing, launching, and operating a set of first spacecraft articles using an integrated ground control system in FY 2016. The estimate for the Phase I effort consists of the total nonrecurring development and recurring costs for designing and building the space segment bus, the optical tracking and communications payloads for two prototype satellites, and the ground segment. The PTSS prototype satellites will demonstrate early, precise, real-time tracking of ballistic missiles.
As part of the development cost and as the basis for the procurement cost of the first production satellite, the committee estimated the recurring cost of producing the first two prototype satellites at $550 million each (FY 2010 dollars) based on (1) applying PTSS weight and power budget estimates at the satellite bus and payload subsystem levels to two parametric representative space system and electro-optical cost models and (2) using each model’s cost estimating relationships calibrated to previous analogous cost expenditures and comparable parametric data details from the STSS program at the same subsystem detail for the development build of two prototype satellites. (The MDA PTSS program office provided the committee with a spreadsheet for PTSS Phase I annual budget costs and weight and power estimates for the prototype satellites as of May 2010. The two estimating tools used were the USAF Unmanned Spacecraft Cost Model (USCM) 8th edition and the Galorath SEER EOS parametric model. The cost estimating relationships of the two cost models have been calibrated against the STSS program’s recurring costs and weight and power and other parametric data values reported in the March 2010 STSS Cost Analysis Requirements Description (CARD)).
The MDA budget through FY 2016 does not include the launch vehicle (LV) and LV adapter costs or the costs for the space segment contractor’s prototype mission integrated system engineering team efforts at the space launch pad to IA&T and full functional checkout of the two prototype satellites in a stowed configuration onto the upper-stage shroud of the heavy lift launch vehicle. The committee included the launch booster, launch services, and space segment contractors’ launch IA&T and checkout costs in development cost estimate. The total launch cost during the development phase is based on launching the two prototype PTSS satellites on one Atlas V EELV-class booster capable of lifting both, each with an estimated satellite total wet mass of 1,550 kg, which includes 30 percent weight margins for the both the PTSS bus and the payload.
bThe procurement cost range estimate of $4.4 billion to $6.9 billion is based on the follow-on build of an additional 9 to 12 satellites (which includes two on-orbit spares) and an AUPC range estimate for each PTSS satellite of $452 to $572 million. The PTSS satellite AUPC range estimate for the lower bound, minimum, reference data point is based on a best case step-down in the second prototype satellite cost for the first unit cost of the production satellite designed for a 7-yr expected design life. This estimate is then projected forward for the total build quantity required to reach FOC of a 9-ball constellation based on a highly efficient cost improvement, or learning curve, of 95-98 percent. The committee based an upper bound, maximum, AUPC estimate using a worst case, or minimal, step-
down in the second prototype satellite for the first unit cost of the production article designed for a 5-yr expected design life and then projected forward for the total build quantity required to reach FOC of a 12-ball constellation based on very little or no cost improvement (a flat learning curve). As in the development phase, the launch cost range estimates are assumed to be the same for the two prototype satellites based on an EELV-class vehicle capable of lifting two production satellites per launch.
cThe 20-yr O&S cost range estimate covers the fixed costs for the ground segment infrastructure and personnel needed beginning with the first two prototype satellites on orbit and continuing forward for the production of on-orbit satellites within the constellation for the following tasks: (1) on-orbit satellite station-keeping and maintaining tracking, telemetry, and communications and (2) mission command and control (C2) needed for passing on satellite precision tracking data for augmenting the planned terrestrial sensor network.
The O&S cost range estimate also includes the cost of producing and launching the additional replacement satellites needed for sustaining the constellation size, where (1) the lower bound, or minimum, cost estimate is based on sustaining the 9-ball constellation based on satellites with an expected average on-orbit life of 7 years and (2) an upper bound, or maximum, cost estimate is based on sustaining the 12-ball constellation based on satellites with an expected average on-orbit life of 5 years.
PTSS Systems
Life-Cycle Cost Summary
A summary of the 20-yr LCC range estimate for the PTSS space and ground segment system is summarized in Table E-12. Further details on the basis of the estimates and further breakout of costs for all three phases of the life cycle are provided in this section.
Relevant Investment Costs
As of May 2010, the projected investment cost beginning in FY 2011 and continuing through FY 2016 is $1.3 billion (constant FY 2010 dollars). According to MDA, this investment and the annual budget investment of $217 million reflects a 1-yr concept development phase beginning in FY 2011 followed by a Phase I effort beginning later in FY 2011, with plans for delivery and launch of two prototype satellites by late FY 2015. The prototypes “will demonstrate early, precise, real-time tracking of ballistic missiles.20 The cost includes the estimated budget for FY 2016 of the Phase I effort to cover the costs for operating the two prototype satellites and augmenting the “planned terrestrial (surface and airborne)
_____________
20See MDA, FY-2011 FYDP Research, Development, Test & Evaluation, President’s Budget, Exhibit R-2, RDT&E Budget Item Justification, BA 4: Advanced Component Development & Prototypes (ACD&P), PE 0604883C: Precission Tracking Space System, February 2010.
sensor network … with [a demonstrated] precision tracking [capability] from space.”21
The investment costs are based on the MDA PTSS program budget estimates as of May 2010. The program budget request for FY 2012 at the time was still under development so the budget had yet to be determined. The PTSS Phase I annual program budget estimates through FY 2016 consist of all nonrecurring development and recurring cost estimates for the space segment bus, the optical tracking and communications payloads, the ground segment, the launch vehicle (LV), and LV adapter costs as well as the costs for the contractor’s prototype mission integrated system engineering team, system engineering program manager, the space segment IA&T, and the operations and testing of the prototype satellites. The roll-up of the total annual budget also included an estimate of the government program operations costs. The MDA PTSS program office provided a spreadsheet of PTSS Phase I annual budget costs and weight and power estimates of the prototype satellites. The development cost budget has been updated since May 2010 to reflect two February 2011 documents: “MDA Fiscal Year 2012 Budget Outline” and “FY 2012 Appropriations Summary,” RDT&E PTSS program element line item budget from 2011 through FY 2016.
System Acquisition Costs
For the purposes of estimating the recurring cost of prototype and an operational projected baseline constellation of nine PTSS satellites, the committee reviewed the MDA’s PTSS Phase I program budget projection and span time frame of 5 years from the start of concept definition through delivery and launch of the first two prototype satellites as the best case, or lower bound, estimate of $1,058 million (in FY 2010 dollars) through the end of FY 2015. Based on the best available analogous comparison of the STSS program’s expended average annual costs and development time frames reported in the STSS CARD document from March 201022 and the most recent STSS program percent cost growth reported by GAO,23 the committee derived an upper bound PTSS Phase I estimate of $1,354 million (also in FY 2010 dollars) based on a representative SSTS program cost growth of 28 percent over the 7 years of development span time beginning in April 2002, when MDA took over the Air Force SBIRS Low program and the
_____________
21Ibid.
22MDA. 2010. “Space Tracking and Surveillance System (STSS) Demonstration Satellites,” Cost Analysis Requirements Description (Card), March 1.
23GAO. 2010. “Report to Congressional Committees–Defense Acquisitions: Assessments of Selected Weapon Programs,” GAO-10-388SP, March.
contractor team had authority to proceed through the refurbishment and launching of the two STSS demonstrations satellites in September 2009.24
The committee was able to derive the first unit (T1) costs for the first prototype satellite based on first parsing out the Phase I space segment recurring portion of the costs from the MDA-provided Phase I annual program budgets. This was done by assuming that the Phase I portion of the nonrecurring Phase I development prototype time frame is a best case (optimistic) estimate comparable to the STSS program’s time frame of slightly less than 2 years (23 months) from the MDA contractor team’s ATP in April 2004 through prototype satellite concept design review (CDR) in March 2004.
Table E-13 provides a summary of the committee’s PTSS T1 prototype satellite unit cost and the projected cumulative average unit costs for the Phase II procurement of a constellation of nine on-orbit satellites and two spares.
MDA’s May 2010 PTSS Phase I annual program budgets submitted to the committee also included a program launch cost estimate of $145 million (in FY 2010 dollars) based on launching the two prototype PTSS satellites on an Atlas V based on a total wet mass estimate of 1,550 kg, which includes 30 percent weight margins for the bus and the two payloads.
System O&S Costs
Since this PTSS represents an MDA new start program that begins with the concept definition phase, the committee estimated the average annual sustainment costs as a rough order of magnitude (ROM) annual projected O&S cost of between $66 million and $108 million (in FY 2010 dollars). The low estimate is based on the MDA PTSS program office’s annual budget projection for FY 2016, which represents the fiscal year immediately following the planned launch of the two prototype satellites. The primary cost is for sustaining systems engineering and program management and ground segment operations. The upper bound, or high, estimate is based on the STSS budget request for FY 2011 for testing the two on-orbit demonstrations, executing critical engagement conditions, and collecting test data used in updating, verifying, and validating the modeling and simulation representations used for assessing system performance. After complet-
_____________
24This upper bound estimate is based on GAO reporting in March 2010 that MDA STSS program office officials stated that there were 2 years of prototype satellite launch delays, and over the MDA period of performance contract costs increased by 40 percent, or $385 million, which included about $115 million to address the various hardware issues that drove the launch delays. Since there was a 3-yr gap in the STSS program in the transition from the Air Force to MDA and the majority of the development was focused on the STSS satellites’ refurbishment, the committee reduced the cost growth due to the added costs for resolving hardware issues that resulted in launch schedule delays and assumed 28 percent was a more representative cost growth factor for estimating the upper bound PTSS Phase I program cost. The committee used this same 28 percent cost growth factor for estimating the upper bound or high estimates for the T1 PTSS prototype satellite cost and the Phase II average recurring unit costs of the constellation of operational satellites.
TABLE E-13 PTSS Satellite Recurring Unit Cost Estimates (FY 2010 million dollars)
| T1 Prototype Satellite Cost | Cumulative Satellite Cost (9-Ball Constellation) | |||
| Low | High | Low | High | |
| Total PTSS satellite unit costa | 198.1 | 250.5 | 148.9 | 187.8 |
| Government office/program operations | 10.9 | 10.9 | 9.8 | 9.8 |
| Contractor satellite unit cost | 187.2 | 239.6 | 139.1 | 178.0 |
| PTSS | 0.1 | 0.1 | 0.1 | 0.1 |
| SE/PM | 23.2 | 29.8 | 17.3 | 22.1 |
| IA&T (space segment) | 29.1 | 37.2 | 21.6 | 27.6 |
| Space segment | 110.8 | 141.8 | 82.3 | 105.3 |
| Bus | 55.0 | 70.5 | 38.3 | 49.1 |
| Payload | 55.7 | 71.3 | 43.9 | 56.3 |
| Optical tracking P/L | 34.0 | 43.6 | 26.8 | 34.4 |
| Communications P/L | 21.7 | 27.8 | 17.1 | 21.9 |
| Operations and test | 24.0 | 30.7 | 17.8 | 22.8 |
NOTE: P/L, payload; SE/PM, system engineering/project manager.
aThe cumulative average unit costs for the space segment bus are based on first starting with a step-down cost of 10 percent from the second prototype satellite cost to the first production unit cost, and then projecting forward a cumulative average unit cost for a total of 11 satellites based on a 95 percent representative cost improvement factor for bus production. The same 10 percent step-down factor is applied to the first production unit cost for both PTSS payloads, and then a cumulative average unit cost is projected for a total quantity of 11 satellites based on a slightly higher 98 percent learning curve factor for payload production.
ing the Phase II production, delivery, and successful launch of the nine-ball PTSS constellation so that it achieves FOC, the steady-state annual average sustainment costs for the system should consist of (1) ground segment operations centers for satellite on-orbit operations comprising station keeping, telemetry tracking, and health monitoring and (2) mission control centers for managing and directing on-orbit satellites’ sensor data-link interfaces to interceptor fire control radars through the BMDS C2BMC communications network. The average on-orbit life of satellites is assumed to be the 5-yr design life.
FURTHER COST DETAILS FOR OTHER SYSTEM ALTERNATIVES CONSIDERED
Air-Launched Hit-to-Kill Systems
This section provides LCC range estimates for the development, procurement, and O&S costs of air-launched hit-to-kill (ALHK) interceptor missiles and
associated airborne platforms based on the two Air Force/MDA design concepts the committee assessed as best able to meet the requirements for longer ranges and having a higher burnout velocity than the network-centric airborne defense element (NCADE) and air-launched PAC-3 missile concepts that have also been considered by MDA. At the time the committee was briefed by the Air Force/MDA back in July 2010,25 the MDA ALHK study team had not recommended one specific interceptor—kill vehicles or airborne platforms with onboard sensors—over another for development.
Life-Cycle Cost Summary
Table E-14 summarizes the ALHK Interceptor system 20-yr LCC range estimate at between $10.5 billion and $17.6 billion. A more detailed breakout by LCC phase is provided later in this section, as are further details on the basis for these estimates.
System Acquisition Costs
Given the early concept design stage that MDA is currently in for evaluating the ALHK and airborne platform options, the committee felt it was prudent to generate two sets of range estimates based on two ALHK single-stage interceptor descriptions that MDA described to the committee back in July 2010 for use on either exo- or exo/high endoatmospheric engagements. The committee concurred with MDA that both proposed missile design concepts of larger missiles are technically viable and capable of providing longer standoff ranges and engagement during the ascent phase.
The first design comprised of an 18 in. diameter booster with an advanced kill vehicle (AKV) having an estimated total mass of 754 kg and a burnout velocity of approximately 3.5 km/sec. The second design alternative is configured with same size booster diameter and interceptor length but with a SM-3 Block IB KV-based design that has a higher projected burnout velocity, up to 4.1 km/sec. The estimated total mass of the second design alternative is 713 kg. Both ALHK interceptor design will require an integrated fire control unit.
MDA has looked at several airborne platform alternatives. The magnitude of the estimates for development cost and recurring retrofit cost of each mix of airborne platform and interceptor candidates is driven by the following characteristics of the air vehicle:
• Carriage capacity and maximum load (i.e., distributed total missile mass);
_____________
25Linton Wells III, MDA/DE, and Lt Col Jordan Thomas, USAF/A5XS, “Air Launched Hit-to-Kill in Ballistic Missile Defense Study,” presentation to the committee, July 16, 2010.
TABLE E-14 Air Launched Hit-to-Kill Interceptor System Total LCC Estimate (FY 2010 billion dollars)
| Minimum | Maximum | |
| Developmenta | 2.8 | 5.4 |
| Procurementb | 7.6 | 11.2 |
| Force quantity buy | 1,000 interceptors with 18-in. boosters and modified SM-3 Block IB KV and 100 retrofitted F-15Cs | 1,000 interceptors with 18-in. boosters and advanced KV and 100 retrofitted F-15Cs |
| MILCON | None required | None required |
| 20-yr O&Sc | 0.11 | 0.97 |
| Total 20-yr LCC estimate | 10.5 | 17.6 |
aThe ALHK interceptor development program cost range estimates of between $2.8 billion and $5.4 billion (in FY 2010 dollars) over 12- and 15-yr time frames is based on going forward from technology development through the systems development and demonstration (SDD) phases for two ALHK interceptor missile options. As part of the SDD phase estimate, the development cost includes the procurement and flight testing of two advanced targeting pods installed on two F-15C test bed fighters configured with the existing onboard AN/APG-63(V)3 radar and either a LITENING or SNIPER targeting pod.
The SDD phase costs consists of estimates for the F-15C-unique development activities and for the concurrent design, integration, and testing of the ALHK missiles into two F-15C test bed aircraft.
The upper bound, or maximum, development estimate includes a contingency cost for mitigating two known risk reduction items and potential long-poles in the tent relative to beginning the SDD phase for demonstrating (1) airborne IR stereo ranging of ballistic missiles with two or more fighters flying in formation with the same sensor suite and (2) airborne Link-16 communications package integrated with BMDS off-board sensor systems (e.g., the proposed ABIR transmitting cueing target object map updates to the ALHK booster via the onboard fire control unit prior to KV vehicle separation).
The SDD range estimates include the costs of designing in airframe design modification for (1) retrofitting at least two F-15Cs as flight test articles to accommodate the weapons carriage loads of each missile option, (2) designing modifications to the fighter’s existing stores management system, and (3) adding the system design engineering required to accommodate, integrate, and test either the LITENING G4 or the SNIPER surrogate pods on the two test bed fighters. Consistent with the Air Force/MDA briefing to the committee, the committee assumed the two F-15C fighters would be taken from the existing Air Force active fighter inventory or inactive (soon to be retired) drawdown fighter force.
bThe procurement retrofit range cost estimate of between $7.6 billion and $11.2 billion is based on an estimated AUPC for both ALHK missile options, $7 million and $8.3 million, and a range estimate of the average retrofit recurring cost per F-15C of between $6 million up to approximately $29 million for accommodating either a LITENING G4 pod or a SNIPER surrogate pod.
cThe total O&S marginal cost range estimate for sustaining 100 retrofitting multimission F-15Cs over the 20-yr service life of between $116 million and $966 million is based on an average marginal annual O&S cost estimate per CAP of between $0.2 million and $1.3 million.
• Aerodynamic concerns raised by drag penalties, center-of-gravity related issues, reduced range, increased fuel consumption, and the like; and
• Overall launching capability at the optimal altitude, for each platform and each interceptor.
Manned fighter alternatives have sufficient carriage capacity for at least two interceptors per fighter for either interceptor option. Depending on the candidate fighter selected, MDA may be able to leverage to some extent existing onboard sensors and radar with modifications as necessary for performing fire control capabilities. Manned bombers can carry the largest magazine (up to 24 on a B-1) but will require more significant changes to onboard sensors and fire control for performing independent ballistic missile defense missions. Currently developed remotely piloted aircraft (RPA) (formerly known as unmanned airborne systems, or UAS) are limited to carrying NCADE interceptors on the MQ-9 Reaper. Similar to fighters, the large-class of RPA may be able to leverage to some extent existing onboard sensors but will require radar modifications to perform fire control functions.
From the perspective of a candidate airborne platform onboard sensor, MDA stated that target management should be handled by the same operational methods used in multitarget air-combat missions using a combination of onboard search radars with IR-assisted laser ranging and IR search and track (IRST) sensors for stereo ranging. This consists of using onboard (1) RF and IR sensors to conduct surveillance and make measurements and (2) processors to collect data, develop stereo tracks, allocate and assign interceptors, upload engagement instructions, direct interceptors, direct sensors, and conduct hit assessments.
The MDA design concept study team considered the following radars: F-15C AN/APG-63(V)3, F-15E AN/APG-82(V)1, and F-22 AN/APG-77. The airborne radar selected should complement the all-weather boost-phase capability of the ALHK missile and be capable of demonstrating the potential for providing real-time TOM in-flight updates after missile launch and for communicating and guiding interceptors to predicted intercept points.
The onboard airborne IR sensors contribute to tracking above the clouds or in their absence. Airborne IR sensor technology can detect a threat in boost at line-of-sight (LOS) distances. Current fighter IR sensors are range-limited to detect a separated reentry vehicle (RV). The F-35 distributed aperture system (DAS) has less detection distance than current SNIPER and LITENING pods for detecting ballistic missile threats after separation.
To establish a cost baseline for each ALHK interceptor missile option, and consistent with the Air Force/MDA briefing, the committee selected the F-15C as the common airborne platform configured with the same onboard augmented sensor suite. The committee set the cost baseline for the set of sensors required on the Air Force/MDA set of projected performance projections and other assumptions provided in the briefing.
For an airborne intercept in boost phase, the Air Force/MDA assumed surveillance would be performed with airborne radar seeing through the clouds and/or with onboard infrared search and track (IRST) sensors. This combination of radar and IRST sensors would also be capable of detecting, tracking, classifying, and predicting the ballistic missile trajectory and uploading instructions to the interceptor missile.
To employ a shoot-look-shoot airborne intercept capability, the committee estimated the cost of developing a kit for ALTK missile system modification and the cost of recurring procurement retrofit as ranges, with the lower bound, or minimum, cost baseline consisting of using the existing F-15Cs able to carry a weapons load of two 18-in. boosters with a KV similar to the SM-3 Block 1B design; the onboard existing AN/APG-63(V)3 radar with the airframe would be retrofitted only as needed to accommodate the size, weight, and power (SWaP) required for installing an already designed and in-production LITENING G4 pod.26
The upper bound, or maximum, cost baseline estimate is for the following:
• Same F-15C airborne platform with the capability to carry two 18-in. boosters of an advanced KV design and onboard existing AN/APG-63(V)3 radar and
• Airframe retrofitted only as needed to accommodate the SWaP required for installing a SNIPER surrogate pod design needed for meeting the higher end performance range projected in the USAF/MDA briefing.
For this maximum cost baseline configuration, the committee assumed that the costs of developing a nonrecurring modification kit and of recurring procurement retrofit of the SNIPER surrogate pod would have to cover modifying the existing SNIPER Extended Range (XR) Advanced Targeting Pod (ATP).27
The development cost is for configuring F-15Cs will vary. They could range from revalidating and using the same previously designed modification kits for installing the LITENING G4 system to modifying the existing SNIPER XR ATP system and the newly designed modification kits for installing the SNIPER surrogate system on the F-15C. For both IRST systems, integration and testing with F-15C flight test articles will be required to ensure that the unique ballistic missile performance tracking requirements have been met before proceeding with production.
_____________
26In November 2008, the Air Force began ordering the LITENING next-generation (G4) targeting sensor system under a contract with the 647th Aeronautical Systems Squadron. (See Northrop Grumman press release: “Northrop-Grumman Receives $120 Million Order to Supply LITENING Gen 4 Targeting Sensor Systems,” Global Newswire, September 25, 2008.) This contract was followed by an additional order from the Air Force for 99 new LITENING G4 pods and 241 modification kits for installation and/or retrofit on F-15s as well as other fighter and attack aircraft. The LITENING G4 is the basis for the Air Force’s LITENING-SE. It includes an all-digital 1024 by 1024 pixel forward-looking IR sensor; a laser targeting program with improved target recognition across a wide range of conditions; and a plug-and-play data-link system that accepts a wide variety of off-board data links without further modifications.
27In August 2001, the Air Force awarded a contract under its Advanced Targeting Pod—Sensor Enhancement program to Lockheed Martin for procurement of the SNIPER XR ATPs. The buy of up to 522 pods was for the product and deployment on Air Force F-15CJ Block 50 aircraft and Air National Guard F-15 Block 30 aircraft. The delivery of 24 systems per year began in FY 2002 and ended in FY 2008. (See “Sniper XR/ATP—Advanced Targeting Pod,” Global Security Web site.)
According to the Air Force/MDA briefing, the current development investment commitment focuses on advanced technology efforts. A decision on Materiel Development led by the Air Force Materiel Command involved funding in FY 2010 at $300,000 (in FY 2010 dollars). An Air Force/MDA Joint Concept Technology Development (JCTD) effort awarded two contractor proposals for development of an Air National Guard NCADE concept with funding estimated at approximately $40 million over a 3-yr period beginning in FY 2011.
The ALHK Interceptor development program cost range estimates of between $2.8 billion and $5.4 billion (in FY 2010 dollars) over 12- and 15-yr time frames for going forward from technology development through the SDD phases, along with the time frame range estimates for each phase for the two ALHK interceptor missile options summarized in Table E-15. As part of the SDD phase estimate, the development cost includes the procurement and flight testing of two advanced targeting pods installed on two F-15C test bed fighters configured with the existing onboard AN/APG-63(V)3 radar and either of the previously described LITENING or SNIPER targeting pods.
Consistent with the basis for the cost range estimated for the SDD phase, the committee assumed the procurement retrofit range cost estimate for accommodating either a LITENING G4 pod or a SNIPER surrogate pod would vary depending on the current onboard F-15C sensor suite configuration of each fighter before or shortly after the approval to begin production of the ALHK Interceptor missiles.
Table E-16 summarizes the total procurement cost range estimate of between $7.6 billion and $11.2 billion, made up of an estimated AUPC for both ALHK missile options of between $7 million and $8.3 million each and a range estimate for the average retrofit recurring cost per F-15C of between $6 million and approximately $29 million (all in FY 2010 dollars).
F-15Cs configured with the onboard sensor suite and configured with a weapons carriage capable of loading two ALHK missiles per fighter are assumed to begin incurring annual O&S costs the fiscal year when IOC is met, which the Air Force and MDA briefing defined when 50 interceptor missiles are produced in low-rate initial production (LRIP) and delivered to one designated fighter squadron along with at least five retrofitted combat-ready F-15Cs. FOC was defined as being achieved 7 years later, when delivery of the total quantity of 1,000 interceptors is phased into the inventory and all 100 retrofitted F-15Cs are in the fighter force and available for forward deployment to fighter squadrons.
The Air Force and MDA briefing estimated the O&S costs over a 15-yr period as the delta cost, or difference, between the sustainment costs of retrofitting F-15Cs and the cost of sustaining F-15Cs already in the Air Force active inventory. The O&S estimate based on marginal costs allows the combatant commanders (COCOMs) additional flexibility in using the retrofitted F-15C for other fighter missions.
TABLE E-15 ALHK Interceptor Program Development Cost Estimates (FY 2010 billion$)
| Cost Component | Development Costa | Air Force/MDA Description of | Development Time (yr)c | ||||||||||||||||
| Minimumd | Maximume | Development Phase Effort and Missile TRL Assessmentsb | Minimumc | Maximumf | |||||||||||||||
| Fighter/ALHK cost benefit studyg | 0.001 | 0.008 | Conduct detailed BMDS cost/benefit analysis. | 0.5 | 1.5 | ||||||||||||||
| F-15C unique technology development (risk reduction phase)h | 0.3 | 0.4 | Airborne demonstration of in-formation IR stereo imaging and off-board Link-16 communications with BMDS sensors. | 3 | 3 | ||||||||||||||
| F-15C unique SDD phased | 0.5 | 0.7 | Integrate new sensors, fire control S/W dev, flight tests, and stores separation. | 3 | 3 | ||||||||||||||
| SDD phase and ALHK missile optionse | Intercept only | ALTK application | |||||||||||||||||
|
18-in. booster with SM-3 Block IB KV |
2.1 | 3.2 | 3 | 3 | 8.5 | 10 | |||||||||||||
|
18-in. booster with advanced KV |
2.9 | 4.4 | 3 | 3 | 9 | 10.5 | |||||||||||||
| Total development cost | 2.8 to 3.5 | 4.3 to 5.4 | Total time frame (yr) | 12 to 12.5 | 14.5 to 15 | ||||||||||||||
aThe development cost range estimate listed is for two acquisition phases, technology development and SDD; the latter phase costs consist of estimates for (1) the F-15C unique development activities and (2) the concurrent design, integration, and testing of the ALHK missiles into two F-15C test bed aircraft.
bFor each ALHK missile option, the committee assumed the same assessed value for the TRLs that the Air Force and MDA cited as one of the primary factors for driving both the nonrecurring portion of the SDD costs and the time frame for development from Milestone B contract go-ahead through the modified fighter ALHK Interceptor missile system’s critical design review (CDR). S/W, software.
cConsistent with the minimum development cost estimates, the minimum time frames listed for the technology development and SDD are consistent with the Air Force and MDA schedule estimates. The concurrent F-15C and ALHK activities during the SDD phase minimum total time frames of between 8.5 or 9 years includes approximately 6 years to fully configure and integrate the first F-15C test bed platform. For both ALHK options the minimum SDD time frame estimates are driven by designing
an 18 in. booster over an 8.5-yr time frame. However, the committee assumed, consistent with Air Force and MDA, that additional development time to complete an advanced KV extends the overall minimum SDD schedule by at least 6 months.
dThe SDD range estimates unique to the F-15C airborne platform are for the cost of designing in airframe design modification for retrofitting at least two F-15Cs as flight test articles to accommodate the weapons carriage loads of each missile option; designing modifications to the fighter’s existing stores management system; and the additional system design engineering required to accommodate, integrate, and test either the LITENING G4 or SNIPER surrogate pods on the two test bed fighters. The committee assumed the two F-15C fighters would be taken from the existing Air Force active fighter inventory or inactive (soon to be retired) drawdown fighter force.
Even though the committee for the sake of consistency went along with the Air Force/MDA briefing choice of the F-15C as the threshold airborne system baseline selected for the LCC estimates presented in this section, there may be a better mix of fighter choices for the Air Force and MDA to consider prior to beginning the SDD phase. Given the early stages of this development activity and the average age of over 25 years for the Air Force active duty inventory of 233 F-15C/Ds (see active duty inventory quantities for the F-15C/D and the average service life taken from “2010 USAF Almanac,” Air Force Magazine, May 2010), the continuing investment in an F-15C service life extension program to sustain these retrofitted aging fighters may not provide the best return on investment over a 20-yr life cycle sustainment cost relative to the total LCC cost of using F-35A production fighters currently entering the USAF inventory. In the Congressional Research Service (CRS) study by Jeremiah Gertler, “F-35 Joint Strike Fighter (JSF) Program: Background and Issues for Congress Report,” CRS RL30563, September 23, 2010, the annual quantity of Air Force F-35As procured through FY 2010 was listed at 25, with a request for 23 more in FY 2011. At the time of the CRS report, past DOD plans increased the procurement for F-35As to a sustained rate of 80 aircraft per year, leading to a total procurement planned of 1,763 F-35As by around FY 2034.
eThe SDD range estimate is the cost for the system engineering design, development, testing, and procurement of a sufficient quantity of either of the two ALHK interceptor missile options for DT and initial operational testing and evaluation (IOT&E) flight testing required on the two F-15C test bed aircraft.
fThe maximum time frames listed for the cost-benefit study are consistent with the estimates specified in the Air Force and MDA briefing along with the SDD time frame of 3 years for the F-15Cunique development activities. However, owing to the uncertainty of the time frames for completing and fully testing a new 18-in. booster and integrating it with either an existing SM-3 Block IB or an advanced new design, the committee added another 1.5 years, or between 15 and 20 percent more time, as slack time for mitigating potential risks.
gThe cost-benefit study was described in the Air Force/MDA briefing as an 18-month study, the funding for which (between $15 million and $30 million in FY 2010 dollars) was at the time of the briefing pending joint approval.
hThe Air Force and MDA identified the two development risk reduction items and potential “long-poles in the tent” relative to beginning the SDD phase for improving the technical maturity and demonstrating the capability of demonstrating airborne IR stereo ranging of ballistic missiles with two or more fighters flying in formation with the same sensor suite and airborne Link-16 communications package integrated with BMDS off-board sensor systems (e.g., the proposed ABIR transmitting cueing data on TOM updates to the ALHK booster via the onboard fire control unit prior to KV separation).
TABLE E-16 ALHK Interceptor Program Procurement Cost Estimates (FY 2010 dollars)
| Average Retrofit Cost per F-15C (FY 2010 million $) | Total Procurement Cost (FY 2010 billion $) | ||||||||||||||||||
| ALHK Missile Option | Interceptor Quantitya | Missile AUPC (FY 2010 million $)a | F-15C Quantitya | Minimuma | Maximumb | Minimum | Maximum | ||||||||||||
| 18-in. booster with SM-3 Block IB KV | 1,000 | 7.0 | 100 | 6.0 | 24.8 | 7.6 | 9.5 | ||||||||||||
| 18-in. booster with advanced KV | 1,000 | 8.3 | 100 | 8.3 | 29.4 | 9.1 | 11.2 | ||||||||||||
aFor each of the two options, the committee based the AUPC estimates on the same ALHK missile interceptor buy quantity of 1,000 and weight-based cost estimates as specified in the Air Force/MDA briefing. The lower bound, or minimum, average recurring cost range estimates per fighter are based on, as needed, retrofitting and installing the latest LITENING or SNIPER targeting pods discussed above, associated modification kits, and system testing for 100 F-15C fighters, which is the same quantity also previously specified by the Air Force and MDA study team. The lower bound or minimum average retrofit costs per F-15C are the same as the values stated in the Air Force/MDA briefing. The assumption the Air Force and MDA briefers made for the ALHK missiles interceptor study was that there would be up to 100 F-15C Air Force and Air National Guard fighters available. The Air Force and MDA average retrofit costs per F-15C are based on SPO estimates of platform and integration costs.
bThe upper bound, or maximum, average retrofit cost per F-15C development cost for each option is based on an increased retrofit effort, where the estimates are based on the average relative cost percentage factor of 1.42 times the AUPC cost to account for the costs of fabrication for unique F-15C airframe interface electrical and mechanical hardware; installation and integration of targeting pods and the modification kits; and end-to-end system test and evaluation.
System O&S Costs
When needed for the ballistic missile defense mission, the COCOM would forward deploy the F-15Cs in CAPs to attempt a boost, or early, intercept by ensuring the placement and continuous on-station coverage needed. The COCOMs can also be in the rear and deploy the retrofitted F-15Cs in CAPs closer to a defended area. In both cases, robust and timely communication links of sufficient bandwidth are necessary to transfer fire-quality tracks to and from the ALHK F-15C platform. In either CONOPS scenario, the ALHK interceptors can be used to execute limited boost-phase intercepts but will likely require as a prerequisite
that the Air Force penetrate enemy airspace to gain air supremacy in advance of the deployment of these CAPs.
For purposes of arriving at O&S costs, the committee estimated the average marginal annual O&S costs on both a per fighter basis and a per CAP basis with three retrofitted F-16Cs each. It limited the O&S estimates to retrofitted F-15Cs for performing this ballistic missile defense mission. Using the above CONOPS and F-15Cs per CAP set of assumptions, the committee computed the average annual O&S delta cost over a steady-state period of 15 years for sustaining 100 F-15Cs in the active inventory at $425,000, which is the equivalent of 1.2 percent of the ROM annual O&S estimate of $4.3 million for sustaining today’s Air Force fleet of F-15C/Ds (in FY 2010 dollars). Given the uncertainty in the CONOPS and varying percentage use of the force of retrofitted F-15Cs to perform ballistic missile tracking and intercept missions along with other fighter missions, the committee considered this a lower bound estimate of the marginal O&S cost of sustaining this fighter force as it operates these missions over a 20-yr service life. The marginal O&S estimate also does not include any most likely USAF investments in extending the service life of the F-15C airframe, engine, and other flight-critical equipment to continue operations from the start of the sustainment phase projected by the Air Force and MDA to begin in FY 2018 and continue for at least another 20 years to FY 2038.28
Table E-17 lists the minimum and maximum average marginal annual O&S cost per aircraft and per CAP, and total marginal O&S costs for 100 retrofitted multimission F-15Cs from IOC forward through FOC and continuing on over the 20-yr service life for sustaining.
Space-Based Interceptor Systems
Cost Overview and Analysis Approach of SBI Constellation
The committee investigated three options for an SBI system: a boost-phase system and a hybrid system capable of doing both boost-phase and midcourse intercept, and a satellite for midcourse intercept. The criterion for optimization was to minimize the total cost from initial R&D through a 20-yr LCC.
The first option was a satellite capable of intercepting both solid and liquid ICBMs with very low leakage, and the second could only achieve very low leakage against liquid ICBMs. For the second class, some geometric leakage for solid ICBMs would be expected, approximately 30 percent for 0-sec decision time and
_____________
28A recent Aircraft Structural Integrity Program (ASIP) briefing by the Air Force from Warner Robbins AFB projected the service life and active duty of Air National Guard and Reserve inventory for providing air superiority missions of approximately 250 F-15Cs to extend out to the mid-2020s. (Joseph D. Lane, USAF-WR-ALC/GRM Eagle Division, and Paul A. Reid, Boeing, “Certifying the F-15C Beyond 2025,” Aircraft Structural Integrity Program (ASIP) 2010 Conference, presentation to the committee, December 2, 2010.)
TABLE E-17 Retrofitted F-15C Marginal O&S Cost Estimates (FY 2010 dollars)
| Average Marginal Annual O&S Costs | Total Marginal O&S Costs over 20-Yr Service Life | |||
| Retrofitted F-15C (thousand $) | F-15C CAP (million $) | (million $) | ||
| Minimum | 51 | 0.2 | 116 | |
| Maximuma | 426 | 1.3 | 966 | |
aThe maximum marginal cost is based on an eightfold increase over the minimum average marginal annual O&S cost per retrofitted F-15C, which equates to an increase in the marginal cost of up to 10 percent of the average annual cost of F-15C/Ds over the minimum estimate based on 1.2 percent.
60 percent for 30-sec decision time; the midcourse capability would be used to deal with the leakage. The third class was a constellation capable of midcourse intercepts only.
The design requirements for the KV were reviewed, with an eye toward minimizing the mass but preserving the functionality needed as well as using sound design principles and technologies that are robust and credible. For the hybrid system the committee slightly relaxed the divert requirement from 2.5 km/sec, used by the APS report to assure the ability to engage solids, to 2.0 km/sec. This reduction of divert velocity may degrade the ability to intercept solid ICBMs and their unanticipated acceleration, but the committee has not tried to quantify that loss. The saving in mass (and therefore cost) is substantial.
Three generic KVs were considered, one for each type of constellations. One was optimized for boost phase only, another was optimized to be able to do both boost phase and midcourse intercepts, and, finally, one was only for midcourse intercepts. The boost phase only KV has a divert velocity of 2.5 km/sec to be able to engage solids and 10-cm diameter optics. The hybrid system has a divert velocity of 2.0 km/sec and 20-cm diameter optics. The midcourse only KV has a divert velocity of 0.6 km/sec and 20-cm diameter optics. For doing midcourse intercepts the committee chose 20-cm diameter optics rather than 30 cm as was used for ground-based interceptors because the long viewing is neither needed nor wanted for SBIs. First, the number of satellites is large, so no target will be far from one of them. The second reason has to do with the orbital mechanics. Once launched the SBI will likely have a very high velocity, perhaps even an escape velocity. A target 3,000 km away means that the KV would need to expend resources to go “around the corner” of Earth to reach the target.
For a given KV, a parametric search was made varying burnout velocity (vbo). In this manner, the number of satellites was determined with the requirement of having at least two satellites within range of any single threat missile. The committee considered both one-stage and two-stage boosters but found that for the speeds needed, one-stage boosters are impractical. The associated LCC was
computed as was the value of vbo. In this way the number of satellites was found that minimized that cost.
LCCs included these:
• Development,
• Production,
• Life jacket mass computed at 50 percent of SBI (booster plus KV mass),
• Learning curve assumptions for the average unit cost of the SBI satellite as a function of the total production buy quantity,
• Average 7-yr SABI satellite on-orbit lifetime and two replacements launches over the 20 years of system sustainment,
• Launch costs, and
• Sustainment costs for operating and maintaining the constellation size and fixed number of SBI satellites on-orbit over a 20-yr period.
The committee evaluated five cases of constellations and estimated the minimum LCCs for the optimum SBI with vbo = 5 km/sec. It required that, on average, at least two satellites be within range for an intercept:
Case 1. Boost-phase coverage of the entire United States with at least one satellite within range against both solid and liquid ICBMs. Decision time = 0 sec.
Case 2. Boost-phase coverage as in Case 1, except that the design only assures coverage against liquids, and midcourse capability is added.
Case 3. Same as Case 1, except decision time = 30 sec.
Case 4. Same as Case 2, except decision time = 30 sec.
Case 5. Only midcourse defense is offered.
Table E-18 summarizes the results of this optimization for the defense of the entire United States29 and most of Canada against ICBM launches from Iran or North Korea for decision times of td = 0 sec and 30 sec.
Each of these SBIs needs a “garage” or a “life jacket” in orbit to provide housing and certain utilities. Table E-19 provides a representative list of the life-jacket hardware envisioned to fill these functions. The committee estimated the total mass of the life jacket to be approximately 50 percent of the total mass of the SBI including the KV.
Cost Trade-off Results of Varying SBI Booster Burnout Velocities
The committee took the KV of Cases 2, 3, and 4 and explored the 20-yr LCC as a function of vbo.
_____________
29The entire United States means CONUS, Alaska, and Hawaii. “Most of Canada” means coverage over areas south of the northernmost part of Alaska.
TABLE E-18 Number of Satellites, Other Parameters, and LCC
| Description | Optics Diameter (cm) | KV Mass (kg) | KV Divert (km/sec) | SBI Mass (kg) | Nsat | 20-Yr LCC Cost (FY 2010 billion $) | |
| Minimum | Maximum | ||||||
| Decision time td = 0 sec | |||||||
|
Case 1: BPI solid + liquid BPI |
10 | 164 | 2.5 | 1,978 | 1,000 | 296 | 500 |
|
Case 2: BPI liquid + midcourse |
20 | 149 | 2.0 | 1,796 | 400 | 119 | 200 |
| Decision time td = 30 sec | |||||||
|
Case 3: BPI solid + liquid |
10 | 164 | 2.5 | 1,978 | 2,000 | 581 | 978 |
|
Case 4: BPI liquid + midcourse |
20 | 149 | 2.0 | 1,796 | 650 | 187 | 311 |
|
Case 5: Midcourse only |
20 | 81 | 0.6 | 977 | 200 | 43 | 73 |
TABLE E-19 SBI Life-Jacket Subsystems and Hardware
| Propulsion |
|
Hall effect ion engine and controls (apogee kick motor) |
|
Propellant |
| Structure and shielding (survivability housing) radiators |
| Electrical power |
|
Solar panel power distribution unit |
|
Batteries |
|
DC-to-DC convertors (power convertor electronics) |
| RF receiver and antenna (tracking telemetry and communications) |
| Attitude determination and control |
|
Momentum wheels and controller |
|
Horizon/star tracker sensors |
|
Low-rate attitude control system for momentum dump |
Figure E-4 shows a plot of the two-stage mass, the total constellation mass, and the 20-yr LCC (average of the minimum and maximum values) as a function of vbo of the interceptor. To do this it did the following: For each value of vbo an appropriate SBI booster was chosen to achieve vbo for the given payload. For each value of vbo the number of satellites was computed to achieve the needed coverage. From the SBI mass, the associated life-jacket mass, and the number of satellites placed in orbit, the total mass to orbit was computed. The LCC was computed using the methodology described below and plotted. The minimum is for vbo between 4 and 5 km/sec. The committee chose 5 km/sec for all subsequent design work. Although the minimum of the curve is a little lower, 5 km/sec was chosen to provide a somewhat robust design in case more reach should be needed.
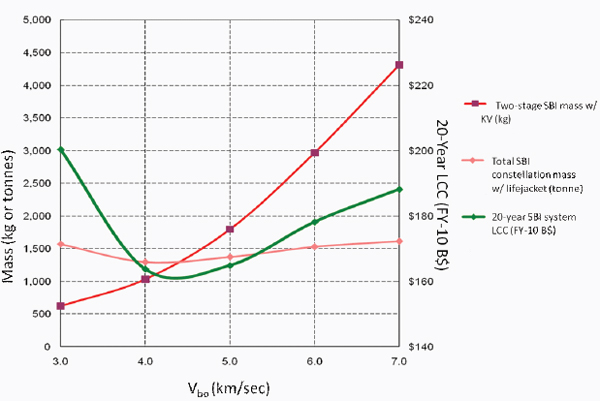
FIGURE E-4 Optimal booster burnout velocity at lowest LCC.
A major driver of the LCC is the cost of delivering the total mass of the constellation to orbit. To deploy a total SBI system constellation of this size and total mass would require a large increase in the current annual U.S. launch capacity, the construction of additional launch pads and associated facilities, and major increases in the production rate of EELV-class and emerging next-generation smaller class launch lift vehicles, such as the Falcon 9 family of Space X vehicles. From a launch lift readiness best-case perspective, EELV-class Delta IV H (heavy) launch vehicles could lift up to 14 SBI satellites (with life jackets) at a mass margin of around 15 percent to a 330-km altitude at an orbital inclination of between 45 and 55 degrees. Of course, this would be contingent upon being able to package all the satellites along with payload adaptors to fit within the volumetric limitations of the Delta IV’s upper-stage shroud. Even if this rather optimistic assumption is technically feasible, it would still require as a best-case scenario a minimum of 115 launches to lift a constellation size of 1,000 SBI satellites. In a 2006 CBO report on projections of U.S. launch capacity and demand through 2020, the minimum number of 115 SBI launches of EELV-class, heavy-lift launch vehicles needed is greater than the total annual capacity of 50 launches per year
projected and much greater than the total U.S. government and commercial annual demand of 25 to 30 launches per year projected for 2015 and beyond.30
Case 1: SBI System for Boost-Phase Defense Missions
Here is an example of the kind of analysis that was done for the LCC estimates. Case 1 is an SBI constellation system designed for the boost-phase mission against both solid and liquid ICBMs with a two-stage booster having a vbo = 5 km/sec, which has been sized to be capable of lifting a KV with a wet mass of approximately 164 kg. The wet mass of the KV is configured with the 10-cm optical diameter IR seeker. The DACS consists of four divert thrusters with the KV capable of a 2.5 km/sec divert velocity and sized for slightly reduced lower bound closing velocities of 8 km/sec to 14 km/sec. The maximum total time of the KV operation can also be extended up to 400 sec.
Table E-20 shows SBI system 20-yr LCC range estimates for acquiring and launching an SBI constellation of about 1,000 satellites and sustaining this fully operational capability over a 20-yr period. Key ground rules and assumptions contained in footnotes to this table, are consistently applied for this case as well as the other cases.
Other SBI System Case LCC Summaries
The summary tables for the LCC range estimates for Cases 2 through 4, which vary with respect to the number of satellites and the diameter of the optics, are provided below as Tables E-21 through E-23.
Costs of Launching Space-Based Interceptors
As discussed in Appendix J, in the section “Space-Based Interceptors,” the required total wet mass of SBI satellites on orbit dominates the design considerations for any space system, largely because of the very high cost of deploying space systems mass into orbit.
History of Cited EELV Launch Costs Early in the history of the Air Force’s EELV program the estimated average launch cost was based on an annual launch rate mission model of heavy lift boosters assuming 95 launches in the FY 2002 to FY 2022 time frame, which would have corresponded approximately to 5 or 6 launches per year, split evenly among the Atlas V and Delta IV family of boosters. In FY 2006, if one divided the RDT&E budget for EELV of $838 million by
_____________
30For further details see Figure 1-2, “Projections of U.S. Launch Capacity and Demand” in the CBO report, Alternatives for Future U.S. Space-Launch Capabilities, Publication No. 2568, October 2006. CBO defined “capacity” as the number of launches that the infrastructure and production facilities can support if fully manned and funded. “Demand” is either the number of launches required on historical launch manifests or current projections of future launch manifests.
six, the average cost per launch was computed at approximately $150 million in FY 2010 dollars.31 This FY 2006 budget is a 66 percent increase over previous years and reflects the “new acquisition strategy, which separated the launch price from the infrastructure or launch pad and range costs. In that same fiscal year, the AF stated that Follow on Launch Service Buys will include launch service costs on a fixed price contract.”
Another source, Aviation Week and Space Technology in the article “Rocket Boosters—To Prop Up Domestic Rocket Industry,” stated that the Air Force had abandoned competition on April 18, 2005, and cited a higher FY 2006 budget request based on an average EELV launch and associated services cost estimate of approximately $183 million (in FY 2010 dollars), which was said to vary depending on the complexity of integrating the payload onto the rocket and the desired orbit. A more recent NASA launch service contract award with United Launch Alliance in March 2009 cited a cost of approximately $605 million (in FY 2010 dollars) for launching multiple space system payloads on four EELV boosters from their Science Mission and Space Operations Mission Directorates.32 The average launch service cost of approximately $151 million is planned for 2011 through 2014, all of it for designated Atlas V launch vehicles. The total value of the award includes the costs of the rockets, “plus additional [launch services] under other contracts for payload processing; launch vehicle integration; and tracking, data and telemetry support.”33
Launch Service Costs per Launch Lift Mass to Lower Earth Orbit The committee bounded the cost per launch lift mass to LEO using two different candidate EELV Delta IV configurations based on the computed SBI total mass launch lift performance values up to an altitude of approximately 330 km. It should be noted that the actual costs are likely to be higher due to recent cost increases for EELV.
An upper bound (or pessimistic) estimate of $15.5 million per ton (in FY 2010 dollars) was computed using the lower-end Delta IV Medium + (5.4) representative booster with a maximum lift capability of approximately 11,250 kg up to 330 km altitude at 45-degree inclination angle of performance and a representative launch service cost of approximately $148 million per launch in FY 2002 dollars or $174 million per launch in FY 2010 dollars. Figure E-5 illustrates the
_____________
31The Air Force RDT&E-based estimated in Forecast International, a 2004 space systems market forecast had cited the Pentagon paying, on average, ~$171 million (in FY 2010 dollars) for each EELV based on a 117-unit buy. This cost will vary depending on the booster vehicle configuration. This estimate of ~$171 million included cost growth of 26 percent from FY 2004 to FY 2005 after approximately four Delta IVs and four Atlas Vs had been produced.
32The launches will be from Launch Complex 41 at Cape Canaveral Air Force Station [in] Florida. The four payloads are the Radiation Belt Storm Probes mission [with a launch in 2011;] the Magnetospheric Multiscale mission [with a launch in 2014;] and the Tracking and Data Relay Satellites (TDRS) K and L (or TDRS-K and TDRS-L) missions [planned for 2012 and 2013 launches, respectively.] See NASA contract release: C09-011, March 16, 2009.
33See NASA contract release: C09-011, March 16, 2009.
TABLE E-20 Case 1: SBI System 20-Yr LCCs (FY 2010 billion dollars)
| Cost Element | Minimum/Low | Maximum/High |
| Research and development | ||
|
SBI booster |
1.1 | 2.4 |
|
KV and seeker |
1.1 | 2.3 |
|
Marginal C2BMCa |
0.5 | 1.0 |
|
Life jacket |
0.4 | 0.9 |
|
NRE I&T cost (30 percent) |
0.9 | 2.0 |
| Subtotalb | 4.0 | 8.7 |
| Production | ||
|
Two-stage boosterc |
10.6 | 14.4 |
|
Kill vehicled |
6.3 | 8.6 |
|
Seekere |
0.6 | 0.8 |
|
Life jacket |
31.9 | 43.5 |
|
Integration and testf |
7.4 | 27.0 |
| SBI satellitesg | 56.8 | 94.4 |
| Launch servicesh | 45.1 | 77.1 |
| Subtotal | 101.9 | 171.5 |
| Operations (over 20 years) | ||
|
Satellite and mission operations |
4.1 | 8.2 |
|
Replacement SBI satellites |
113.6 | 188.7 |
|
Launch servicesi |
72.9 | 123.4 |
| Subtotal | 190.6 | 320.3 |
| Total | 296.4 | 500.5 |
NOTE: Case 1 has vbo = 5 km/sec, Kv divert = 2.5 km/sec, 10-cm optics on the KV, boost-phase liquids, 70 percent solids.
aThe RDT&E costs include the marginal cost of designing the communications links and meeting the interface needs for integrating the on-orbit SBI satellite operations with the ballistic missile defense C2BMC. (The nonrecurring engineering marginal cost is based on taking the average C2BMC program budget from FY 2008 through FY 2015 as reported in the FY 2011 MDA PB, converting it to FY 2010 dollars, and spreading the average annual estimate over an assumed 4-yr development timeline.
bThe RDT&E lower bound, or minimum, cost estimate consists of the nonrecurring system design and engineering minimum cost estimates for modifying a two-stage heritage booster assessed at 50 percent new design, along with a KV and IR seeker design and packaging of the subsystems and components of the life jacket, which the committee assessed as a relatively new design. The assumptions and resulting estimates for the nonrecurring engineering efforts are based on best engineering judgment as to the current technical maturity or readiness level or assessed TRL value, the complexity of the design, and the extent to which the past program heritage can be leveraged for the two-stage booster, the KV (which includes both the DACs and IR seeker), and the life jacket. It also includes estimates of the manufacturing, assembly, integration, and on-orbit testing costs of producing two sets of interceptors, KVs, and life jackets and launching two fully configured protoflight SBI satellites as part of the development phase. The recurring cost of producing the two prototype SBI satellites is based on an assumed increase of 50 percent over the first unit, or T1, production cost estimate calculated as the basis for the procurement cost estimates. This step-back factor of 1.5 is based on a best engineering judgment assumption of higher first-time labor costs due to the inefficiencies of producing the hardware with hands-on engineering compared to a more fully automated manufacturing environment and a higher one-time cost of buying the space-qualified parts needed only for the two prototypes.
To account for requirements creep, schedule changes, and annual budget shift, the upper bound,
or maximum, RDT&E estimate is 72 percent higher than the lower bound, minimum, estimate. This increase is based on the actual cost growth experienced on an analogous THAAD development program as reported in the most recent DOD Selected Acquisition Report for this system. (With 90 percent of the effort completed, the THAAD program’s most recent Selected Acquisition Report of December 31, 2009, reported a contractor RDT&E estimated price at completion cost that had grown 57 percent since the initial contract award in August 2000. The contract called for delivering 50 THAAD interceptors and corresponding hardware for two U.S. Army batteries. In constant-year dollars, the corresponding RDT&E budget over this same time frame also increased by 72 percent.)
cThe two-stage boost phase T1 unit cost is based on applying a weight-based linear regression cost estimate relationship generated using two analogous data points: the GBI OBV three-stage booster weight of 22,483 kg and an average unit cost of $47 million (FY 10 dollars) as the lower-bound value of $2.7 million per ton and the Aegis SM-2 Block IA missile (less the KV) weight of 1,436 kg and an average unit cost of $8.1 million per ton and an upper-bound value of $8.9 million per ton.
dThe remainder of the KV unit cost estimates for the DACs, avionics, structure, tankage hardware, etc. is based on applying similar weight and other technical parameters as input values for the Air Force’s latest edition of the Unmanned Spacecraft Cost Model (USCM). The committee also used the USCM primarily weight-based parametric model to estimate the life jacket for each of subsystems and components previously listed in Table E-19.
eThe IR seeker unit production cost is based on technical parameter values of the optics diameter, focal plane array size and material, electronics weights, etc. as input to a commercial parametric cost model, SEER Electro-Optics.
fThe projected uncertainty in the recurring SBI satellite integration and testing cost estimates is accounted for by applying a 15 percent factor to the sum of the recurring cost of the two-stage booster, the KV, the seeker, and the life jacket as the minimum estimate and a 30 percent factor for the maximum estimate.
gThe SBI satellite production cost range estimates are based on computing the first unit, T1, production cost and then calculating the cumulative average unit costs based on learning curve or CIC slope values to account for manufacturing labor efficiencies and discounts on parts costs as a function of the quantity being produced. Since the projected labor efficiencies and material discounts are not fixed and could vary for producing IR seekers, DACs, avionics, and life-jacket subsystems, the committee based the lower bound, or minimum, set of cost estimates on a steeper CIC slope, 95 percent, compared to an upper bound, or maximum, cost estimate based on a flatter slope, 98 percent.
hFor launch services costs, the committee based the range estimates on the cost to launch a given mass to LEO. It used this cost to calculate the cost of lifting the total SBI satellite constellation wet mass required to achieve FOC. The projections are based on the forecast for the current and emerging candidate set of U.S. launch vehicles available supply and the total U.S. military, NASA, and commercial space system industries’ demand in the FY 2015 to FY 2020 time frame and again in the FY 2025 and beyond time frame for launching replacement SBI satellites after reaching FOC and continuing over the 20-yr life-cycle period. The preceding section provides further details on the launch service cost and launch lift performance capabilities of the candidate set of U.S. boosters.
It should be noted that the launch service cost per mass to LEO is based on keeping within the total launch lift capability of the candidate launch vehicles that have been identified. This total launch mass estimated comprises the total wet mass of the multiple SBI satellites, the mass of the candidate launch vehicle’s payload adaptor(s), and an acceptable launch mass margin.
However, it should also be noted that cost factors being applied are also contingent upon ensuring that the computed total launch lift mass also can be packaged in a stowed configuration to fit within the volumetric constraints of the upper-stage shroud of the candidate launch vehicle.
As part of the total acquisition cost to reach FOC, the committee set the minimum launch service cost at $13 million per ton in FY 2010 dollars based on a representative service cost of approximately $250 million per launch in FY 2010 dollars for an EELV Delta IV heavy vehicle with a maximum lift
of approximately 19,240 kg to 330 km altitude at a 45 to 55 degree orbital inclination. (The launch services cost information for the EELV class of Delta IV heavy and medium boosters was extracted from Edgar Zapata, 2008, A Review of Costs of US Evolved Expendable Launch Vehicles (EELV), National Aeronautics and Space Administration, Kennedy Space Center, February 5. The specific launch performance information for the Delta IV heavy and medium class of vehicles was extracted from S.J. Isakowitz, J.B. Hopkins, and J.P. Hopkins, Jr., 2004, “International Reference Guide to Space Launch Systems,” 4th ed., American Institute of Aeronautics and Astronautics.) The Delta IV Heavy is configured with a 5-m diameter fairing with two additional core common boosters as strap-on motors to the primary launch vehicle. The maximum launch service cost was set at $22.2 million per ton based on the same representative service cost of $250 million per launch for a Delta IV Medium + (5.4) vehicle with a maximum lift of approximately 11,250 kg to 330 km altitude at a 45-degree inclination. The Delta IV Medium launch vehicle is configured with a 5-m diameter fairing with four additional strap-on motors.
iAfter FOC, the committee set the launch cost per ton for SBI replacement launches in the 20-yr life-cycle period at projected minimum and maximum values in the post FY 2025 time frame. The cost reflected slightly lower costs owing to the larger projected market supply of smaller launch vehicles, such as SpaceX Corporation’s Falcon 9 boosters launched from several different U.S. sites. These would be viable candidates beyond the Delta IV and Atlas V expendable vehicles launched from Cape Canaveral and Vandenberg Air Force Base. (Cost and performance information for Falcon 9 was extracted from SpaceX, 2009, “Falcon 9 User’s Guide,” SCM 2009-010 Revision 1, Figure 4.1 Falcon 9 Block 2 Performance to Low Earth Orbit (Cape Canaveral)). The committee set the minimum value at $10.4 million per ton, 20 percent lower than the previously stated value of $13.0 million per ton, by assuming a proportional number of launches would be performed on the Falcon 9 family of vehicles where SpaceX Standard Launch Services cited a price (which includes an additional 8 percent for re-flight insurance) for a booster with a maximum lift capability to LEO for approximately 7,200 kg of approximately $8.4 million per ton. The committee set the maximum value at $20.0 million per ton, or approximately 10 percent lower than the previously stated value of $22.2 million per ton. This value used a more conservative representative mix of Delta IV or Atlas V class vehicles, with Falcon 9 boosters as needed to keep up with SBI satellite replacement launch demands.
Delta IV Medium + (5.4) launch lift performance as a function of orbital altitude. The booster has a 5-m diameter fairing with four additional strap-on motors.
A lower bound (or optimistic) minimum estimate of $9.8 million per ton (in FY 2010 dollars) was computed based on a representative cost of $160 million per launch (in FY 2002 dollars) or $188 million per launch in FY 2010 dollars for a Delta IV Heavy vehicle with a maximum lift of approximately 19,240 kg to 330 km altitude at a 45- to 55-degree orbital inclination performance.34Figure E-6 illustrates the Delta IV Heavy launch lift performance as a function of orbital altitude. The Delta IV Heavy is configured with a 5-m diameter fairing with two additional core common boosters as strap-on motors to the primary launch vehicle.
The minimum and maximum estimates of cost per total mass lift to LEO
_____________
34The launch services cost and performance information for this Delta IV Heavy and Medium class of vehicles is from S.J. Isakowitz, J.B. Hopkins, J.P. Hopkins, Jr., 2004, International Reference Guide to Space Launch Systems, 4th edition, American Institute of Aeronautics and Astronautics.
TABLE E-21 Case 2: SBI System 20-Yr LCC Results for 2,000 Satellites (FY 2010 billion dollars)
| Cost Element | Minimum/Low | Maximum/High |
| Research and development | ||
|
SBI booster |
1.1 | 2.4 |
|
KV and seeker |
1.1 | 2.3 |
|
Marginal C2BMC |
0.5 | 1.0 |
|
Life jacket |
0.4 | 0.9 |
|
NRE I&T cost (30 percent) |
0.9 | 2.0 |
| Subtotal | 4.0 | 8.7 |
| Production | ||
|
Two-stage booster |
21.0 | 28.7 |
|
Kill vehicle |
12.5 | 17.1 |
|
Seeker |
1.2 | 1.7 |
|
Life jacket |
63.4 | 86.5 |
|
Integration and test |
14.7 | 53.6 |
| SBI satellites | 112.9 | 187.6 |
| Launch services | 90 | 153 |
| Subtotal | 202.6 | 340.9 |
| Operations (over 20 years) | ||
|
Satellite and mission operations |
4.1 | 8.2 |
|
Replacement SBI satellites |
225.8 | 375.2 |
|
Launch services |
144.8 | 245.3 |
| Subtotal | 374.8 | 628.7 |
| Total | 581.3 | 978.3 |
NOTE: Case 2 has vbo = 5 km/sec, Kv divert = 2.5 km/sec, 10-cm optics on the KV, boost-phase liquids, 70 percent solids.
were used for computing launch service costs to attain FOC of the total number of SBI satellites required for the constellation. Once FOC is reached and assuming an average life of 7 years for each SBI satellite, replacement launches will be required after FY 2025.
Given the forecast increase in U.S. demand for space systems launch and the emerging use of launch sites other than Vandenberg Air Force Base and Cape Canaveral and use of classes of boosters other than EELVs, the committee reduced the minimum cost of total mass lift to LEO estimate based on the representative market price for launch services cited by SpaceX for the Falcon 9 Block II (see Figure E-7).35
After FOC, the committee set the launch cost per ton for SBI replacement launches in the 20-yr life cycle period at the projected minimum and maximum values after FY 2025. These values reflected the larger market supply of smaller
_____________
35Cost and performance information is from SpaceX, 2009, Falcon 9 User’s Guide, SCM 2009-010 Revision 1, Figure 4.1, “Falcon 9 Block 2 Performance to Low Earth Orbit (Cape Canaveral).”
TABLE E-22 Case 3: SBI System 20-Yr LCC Results for 650 Satellites (FY 2010 billion dollars)
| Cost Element | Minimum/Low | Maximum/High |
| Research and development | ||
|
SBI booster |
1.1 | 2.3 |
|
KV and seeker |
1.0 | 2.2 |
|
Marginal C2BMC |
0.4 | 1.0 |
|
Life jacket |
0.4 | 0.8 |
|
NRE I&T cost (30 percent) |
0.9 | 1.9 |
| Subtotal | 4.0 | 8.1 |
| Production | ||
|
Two-stage booster |
1.4 | 1.8 |
|
Kill vehicle |
0.9 | 1.1 |
|
Seeker |
0.1 | 0.1 |
|
Life jacket |
4.4 | 5.6 |
|
Integration and test |
1.0 | 3.5 |
| SBI satellites | 7.8 | 12.1 |
| Launch services | 4.7 | 8.0 |
| Subtotal | 12.5 | 20.1 |
| Operations (over 20 years) | ||
|
Satellite and mission operations |
4.1 | 8.2 |
|
Replacement SBI satellites |
15.5 | 24.3 |
|
Launch services |
7.6 | 12.8 |
| Subtotal | 27.2 | 45.3 |
| Total | 43.7 | 73.5 |
NOTE: Case 3 has vbo = 5 km/sec, Kv divert = 2.0 km/sec, 20-cm optics on the KV, boost-phase liquids + midcourse.
launch vehicles, such as SpaceX Corporation’s Falcon 9 boosters launched from several different U.S. sites as viable candidates beyond the Delta IV and Atlas V expendable vehicles launched from Cape Canaveral and Vandenberg Air Force Base.
The minimum cost of $8.4 million per ton is based on the standard launch services prices for Falcon 9 and includes an additional 8 percent for reflight insurance. It pertains to a booster with a maximum lift capability to LEO of approximately 7,200 kg after subtracting the mass estimated for the payload adaptor along with a 10 percent additional mass margin.36
In this post-FOC time frame, the maximum cost was set at $13.9 million per ton, or approximately 10 percent less than the previously stated value of $15.5 million per ton. This value is based on use of an assumed mix of Delta IV or
_____________
36Cost and performance information was extracted from Space X Falcon 9 User’s Guide, SCM 2009-010 Revision 1, Figure 4.1, “Falcon 9 Block 2 Performance to Low Earth Orbit (Cape Canaveral).”
TABLE E-23 Case 4: SBI System 20-Yr LCC Results for 200 Satellites (FY 2010 billion dollars)
| Cost Element | Minimum/Low | Maximum/High |
| Research and development | ||
|
SBI booster |
1.1 | 2.3 |
|
KV and seeker |
1.1 | 2.2 |
|
Marginal C2BMC |
0.5 | 1.0 |
|
Life jacket |
0.4 | 0.8 |
|
NRE I&T cost (30 percent) |
0.9 | 1.9 |
| Subtotal | 3.8 | 8.2 |
| Production | ||
|
Two-stage booster |
6.6 | 8.8 |
|
Kill vehicle |
4.1 | 5.4 |
|
Seeker |
0.4 | 0.6 |
|
Life jacket |
20.4 | 27.0 |
|
Integration and test |
4.7 | 16.7 |
| SBI satellites | 36.2 | 58.4 |
| Launch services | 26.8 | 45.8 |
| Subtotal | 63.0 | 104.2 |
| Operations (over 20 years) | ||
|
Satellite and mission operations |
4.1 | 8.2 |
|
Replacement SBI satellites |
72.5 | 116.7 |
|
Launch services |
43.3 | 73.3 |
| Subtotal | 119.9 | 198.3 |
| Total | 186.7 | 310.7 |
NOTE: Case 4 has vbo = 5 km/sec, Kv divert = 0.6 km/sec, 20-cm optics on the KV, midcourse only.
Atlas V class vehicles and Falcon 9 boosters needed to keep up with SBI satellite replacement competitive launch demands.
SBI Constellation Cost and Affordability Observations
Space-based interceptors are a potentially attractive option for boost-phase intercept because they are not constrained by geography to being located close to the target missile. In addition, their accelerations and velocities are not constrained by the atmosphere, so in theory they could have longer reaches than surface- and air-based interceptors.
Those potential operational advantages are offset, however, by a number of drawbacks. First, placing mass into LEO is very expensive, from $8,400 to $15,500 per kilogram (in FY 2010 dollars). This makes total launch lift mass the dominant design criterion for space-based systems. For example, mass constraints limit the ability to exploit the lack of atmosphere to increase the reach of the interceptors. In fact, the committee found that the total mass in orbit was

FIGURE E-5 Delta IV medium + (5.4) LEO launch lift capability. SOURCE: S.J. Isakowitz, J.B. Hopkins, and J.P. Hopkins, Jr. 2004. International Reference Guide to Space Launch Systems 4th edition American Institute of Aeronautics and Astronautics.
minimized when accelerations and flyout velocities were less than those assumed in almost all of U.S. surface-based interceptors. Second, the orbital motion of the satellites and the rotation of Earth result in requirements for very large numbers of satellites to ensure that at least one would be close enough to intercept a single missile before it achieved enough velocity to deliver its munitions to the United States. This coverage requirement, in turn, results in constellations with masses that are between 650 and 2,000 SBI satellites.37 The total launch lift mass to orbit of even the lower end of the constellation size calls for a significant effort and would require at least a threefold increase in the current launch capacity of the United States.
_____________
37The Case 1 SBI satellite constellation size of 1,000 for the boost-phase intercept mission should be considered optimistic against solid-propellant ICBMs. If more realistic geographical scenarios are considered, ICBMs would have to be intercepted sooner than 5 sec before burnout, resulting in an increase in the total number of interceptors and total system mass. For example, the number of interceptors and total mass would increase by about 25 percent if the constellation were designed to defend the United States against Iran. The effects of more realistic scenarios are less pronounced against liquid-propellant ICBMs, because they burn longer and accelerate more rapidly at the end of their burns.
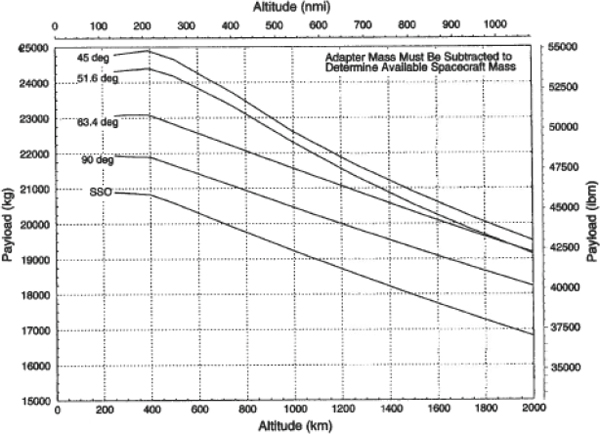
FIGURE E-6 Delta IV heavy LEO launch lift capability. SOURCE: S.J. Isakowitz, J.B. Hopkins, and J.P. Hopkins, Jr. 2004. International Reference Guide to Space Launch Systems 4th edition American Institute of Aeronautics and Astronautics.
GMD Evolved CONUS-Based Systems
The GMD-E cost estimates were based on the committee’s recommended interceptor baseline design that would be half the size and weight of the current GBI and should be designed to be either silo emplaced at a CONUS-based site in the Northeast or, as described in the next section, to be carried in a canister on a transporter/erector/launcher (TEL) at a prepositioned fixed site or sites in Europe.
The committee recommended that the additional site in CONUS should be activated in upstate New York or Maine. For both CONUS and forward-based GMD-E missiles, the new interceptor’s KV should be designed around a 30-cm-diameter two color LWIR sensor with an additional visible band to detect targets as far away as 3,000 km. It is estimated that this sensor with a blow-down-cooled 256 × 256 three-color focal plane array cued by SBIRS high and/or forward-based X-band radars can observe the threat complex for as long as 300 sec with adequate and ever increasing signal-to-noise ratio. The committee estimates that a KV with the features described below will have a wet mass of 106-110 kg and a total divert capability of 600 m/sec. The GMD-E interceptor and KV must be designed to receive uplinks at any time during fly-out and to downlink what the
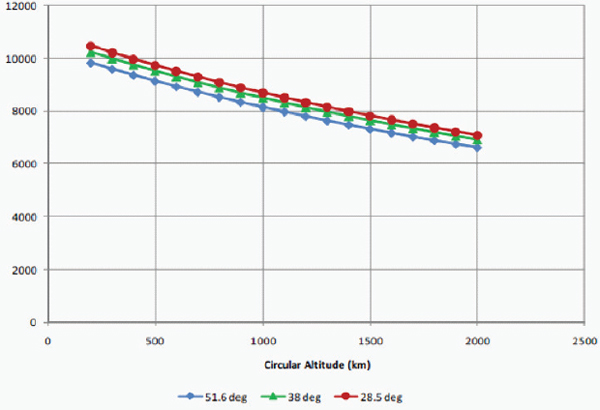
FIGURE E-7 Falcon 9 Block II LEO launch lift capability. SOURCE: Space X Falcon 9 User’s Guide, SCM 2009-010 Revision 1, Figure 4.1, “Falcon 9 Block 2 Performance to Low Earth Orbit (Cape Canaveral).”
KV sees any time after shroud removal without vehicle hardware or orientation constraints, preferably at X-band using one or more of the X-band radars that has the interceptor in view for both up- and downlinks. The KV should have a battery operating time in excess of 700 sec after boost, and the blow-down cooling should take the focal plane and immediately adjacent optical structure to 100 K when the sensor is uncapped. With the focal plane heat sunk, the sensor optics may warm up slowly from that point as the interceptor closes on the target complex. The KV should include an inflatable kill enhancement “net” similar to that used on ERIS to deal with any objects tethered close to the threat warhead.
One of the key assumptions driving the nonrecurring and recurring estimates for the CONUS-based GMD-E booster was leveraging the previous MDA Kinetic Energy Intercept (KEI) program and taking advantage of relevant heritage designs and MDA’s sunk investment cost of $5.1 billion (in FY 2010 dollars) expended on work performed under this now cancelled program of record.38
The committee’s evolved GMD interceptor’s proposed design would use a
_____________
38The booster configuration developed on the KEI program went through successful ground firing of the first-stage motor, and the second-stage motor was ready to fire just before the program was terminated in late 2009.
smaller two-stage interceptor with a total burn time less than a third that of the existing GBI carrying a larger more capable KV. It would also require adding a third missile field site in the U.S. Northeast and a fourth site in the U.S. North Central states together with additional X-band radars to protect the eastern United States and Canada against Iranian threats.
The 20-yr LCC range estimates for this CONUS-based GMD-E system are summarized in Table E-24.
Forward-Based GMD-E Systems
As part of the committee’s evaluation of the gain in effectiveness to defend against ballistic missile attacks from our allies within Europe and others, it
TABLE E-24 Estimated LCC for CONUS-Based GMD-E System Total (FY 2010 billion dollars)
| Minimum | Maximum | ||
| Development | 3.3 | 4.7 | |
| Procurement | 5.8 | 9.6 | |
| Force quantity buy | Two missile field sites 50 interceptors each (30 operational missiles + test assets) | ||
| MILCONa | 2.4 | 2.4 | |
| 20-yr O&S | 7.6 | 8.6 | |
| Total | 19.1 | 25.3 | |
aThe LCC for a CONUS-based Evolved GMD system includes an estimate for the construction cost of Northeast and North Central missile fields and other infrastructure facilities at these two sites.
TABLE E-25 Estimated LCC for Forward-Based GMD-E System Total (FY 2010 dollars)
| Minimum | Maximum | |
| Development | 2.8 | 3.9 |
| Procurement | 1.6 | 2.3 |
| Force quantity buy | One land-based site in Europe | |
| MILCON | None required | None required |
| 20-yr O&S | 2.0 | 3.0 |
| Total | 6.4 | 9.2 |
estimated the 20-yr LCC of a forward-deployed, evolved GMD transportable interceptor system located in Poland as a hedging strategy alternative to the land-based SM-3 Block IIB interceptor previously described in the section “Aegis SM-3 Block IIB.” The 20-yr LCC of a forward-based GMD-E interceptor system is provided below as Table E-25.
LIFE-CYCLE COST DETAILS PROGRAMS OF RECORD SYSTEMS
GMD Systems
Relevant Systems Investment Costs
Table E-26 lists the GMD system total program investment costs (i.e., budget) expended through FY 2009 of approximately $34 billion (in FY 2010 constant dollars).39 In the 1993 time frame, the primary mission of the boost interceptor and the NMD programs was to develop a defensive system that could “intercept incoming ballistic missile warheads outside Earth’s atmosphere [exoatmosphere] and destroy them by force of the impact.”40 This mission and the programs that followed have since evolved, beginning with the GMD incremental block development of a midcourse interceptor system in 2002. During this 8-yr period from FY 2002 through FY 2009, the MDA total annual investment was approximately
TABLE E-26 GMD System Investment Costs Through FY 2009 (FY 2010 dollars)
| Cost Element | Program Time Frame | Total Investment (billions) | Average Annual Investment (millions) |
| Boost-phase interceptor | 1993-1999 | 1.4 | 227 |
| NMD DEM/VAL | 1995-2001 | 8.7 | 1,444 |
| BMDS interceptor | 2003-2009 | 1.9 | 265 |
| GMD block development | 2002-2009 | 21.7 | 2,716 |
| Total investment | 33.7 | ||
NOTE: The total program acquisition (RDT&E and procurement) investment sunk costs for the current GMD system and previous predecessor system expended through FY 2009 are based on the sum of the fiscal year actuals reported from the FY 2012 MDA FYDP PB justification sheets submitted in February 2011 and on previous MDA (formerly BMDO) annual PB justification sheets. For the other interceptor and sensor systems, these same references cited are the basis for the other interceptor and sensor system sunk investment cost calculations and, where applicable, from the other military services listed in the tables in this appendix.
_____________
39For system comparison purposes, all the costs provided in this appendix, as well as in Appendix J, are normalized to FY 2010 constant dollars, using the base year FY 2010 OSD inflation rate index issued on December 11, 2009.
40See MDA, Ground-Based Midcourse Defense (GBD) Validation of Operational Concept (VOC), Chapter 2.0, December 12, 2002.
$22 billion, which in addition to program block development included the production of 40 three-stage GBI operational and test interceptors. The average annual investment for the GMD system and the BPI program during this time frame was approximately $2.7 billion.
System Acquisition Costs
Table E-27 provides the AUPC estimates for the three-stage GBI of $70.2 million, which includes the EKV at close to $30 million, which is 42 percent of the total interceptor cost and also includes the booster avionics module and integration, assembly, and checkout costs per system. With regard to the EKV and in addition to the procurement of new three-stage GBIs, the FY 2011 MDA FYDP PB listed a separate procurement of the capability enhancement-II (CE-2) EKVs at a higher average unit cost of $39 million (also in FY 2010 dollars) for a quantity buy of seven. The enhanced EKV addresses the parts “obsolescence issues and provides additional processor throughput to support systemwide [advanced]
TABLE E-27 GMD Three-Stage GBI Average Unit Procurement Costs (FY 2010 million dollars)a
| GBI Cost Element | AUPC | |
| EKV | 29.8 | |
| Boost stack | 19.8 | |
| Booster avionics modules | 6.5 | |
| Integration, assembly, test, and checkout | 4.1 | Next five GBIsb |
| Total cost | 70.2 | 86.5 |
aMDA provided the total cost estimate for five GBIs, which it was assumed were in FY 2010 dollars (“MDA Ground-Based Midcourse Defense Response to NAS Cost Questions,” August 12, 2010.
bMDA also noted that the purchase of refurbishment parts and flight test rotation kits impacted many suppliers. As a result, the GMDS program allocated $81.8 million (in FY 2010 dollars) specifically to value-added vendor preservation by procuring long-lead items for the next five GBIs. MDA allocated $86.5 million, an upper bound projected AUPC estimate for the next five GBIs, in the budget evenly across this next production buy.
discrimination capabilities.”41
For forward projections of additional quantities of three-stage GBIs beyond the budget committed in the FY 2011 FYDP, the committee assumed the AUPC estimate of $70.2 million as a realistic lower bound estimate along with an upper bound estimate of $86.5 million.
_____________
41See MDA, FY-2011 FYDP Research, Development, Test & Evaluation, President’s Budget, Exhibit R-2, RDT&E Budget Item Justification, BA 4: Advanced Component Development & Prototypes (ACD&P), PE 0603882C: Ballistic Missile Defense Mid-Course Segment, February 2010.
TABLE E-28 GMD System Average Annual O&S Cost (FY 2010 million dollars)
| O&S Cost Elements | Average Annual O&S Cost FY 2010 through FY 2015 | Distribution by Cost Element (%) | |||||||||||||||||
| MDA | Contractor | Army | |||||||||||||||||
| Unit level manpower | 53 | 0 | 21 | 79 | |||||||||||||||
| Unit operations | 4 | 0 | 0 | 100 | |||||||||||||||
| Maintenance | 59 | 0 | 100 | 0 | |||||||||||||||
| Sustaining support | 153 | 37 | 61 | 2 | |||||||||||||||
| Indirect support | 20 | 100 | 0 | 0 | |||||||||||||||
| Total | 290 | 26 | 57 | 17 | |||||||||||||||
NOTE: The annual O&S costs for the GMD program were provided by MDA in then-year dollars from FY 2010 through FY 2027 across the OSD Cost Assessment and Program Evaluation Office cost elements. Also listed is a percentage breakdown by cost element and total O&S costs of the portion of MDA funds for sustaining and indirect support, MDA contractor funds from its RDT&E budget, and Army funds for unit-level manpower and unit operations. An average was taken over the FY 2011 FYDP through FY 2015, and the average annual costs are expressed in FY 2010 constant year dollars. SOURCE: “MDA Ground-Based Midcourse Defense Response to NAS Cost Questions,” August 12, 2010.
System O&S Costs
Table E-28 lists the average annual sustainment or total operating and support costs for the GMD system at $290 million (in FY 2010 dollars) located at both FGA and VAFB.42 MDA is currently pursuing “a competitive development and sustainment contract (DSC) for future development; fielding; test[ing]; systems engineering, integration and configuration management; equipment manufacturing and refurbishment; training; and operations and sustainment support for the GMD system and associated support facilities.”43 Specifically, the sustainment portion of the contract includes base operations maintenance support costs, which include (1) “monitoring, diagnostics, and maintenance of fielded ground-based midcourse defense components,” (2) “continued development and validation of maintenance procedures,” (3) “tracking of repair parts stock levels,” and (4) performing maintenance on a 24/7/365 basis at VAFB, FGA, and the MDIOC.44 Sustainment costs are also for upgrading and maintaining the security system at FGA and “developing a competitive logistics acquisition strategy for follow-on maintenance.”45
_____________
42Until FY 2008, GMD BPI program RDT&E annual budgets from FY 2002 through FY 2007 included a mix of sustainment or operations and support efforts as part of total costs, which were not separately identified within specific program element line item numbers and/or block development projects.
43See MDA, FY-2011 FYDP Research, Development, Test & Evaluation, President’s Budget, Exhibit R-2, RDT&E Budget Item Justification, BA 4: Advanced Component Development & Prototypes (ACD&P), PE 0603882C: Ballistic Missile Defense Mid-Course Segment, February 2010.
44Ibid.
45Ibid.
The average annual GMD O&S cost for a GBI force of 30 operational missiles is approximately $9.7 million per year (in constant FY 2010 dollars).
System Life-Cycle Costs
From FY 2010 forward, the GMD system LCC range estimates for development, procurement, and 20-yr O&S are listed in Table E-29. The total estimate from FY 2010 forward of approximately $19.3 billion includes the following:
• The requested funding for the MDA FY 2012 FYDP PB RDT&E budget for the GMD program of $6.8 billion (excluding sustainment funds) from FY 2010 through FY 2016 to procure additional three-stage boosters configured with enhanced KVs for completing the buildup and retrofit of existing interceptors to an objective operational force of 30 GBIs. In addition, the $6.7 billion budget includes funds for the procurement of launch site components (i.e., silos and silo interface vaults), launch support systems (e.g., command launch equipment), in-flight interceptor communications system data terminals, a communications network, an external systems interface, test exercisers, fire controls, and so on for Missile Field 2 at FGA.
TABLE E-29 GMD System Total LCC Estimate (FY 2010 billion dollars)
| Minimum | Maximum | |
| Developmenta | 10.6 | 14.5 |
| Procurement | 10.6 | 14.5 |
| Force quantity buyb | 12 GBIs | |
| MILCONc | 1.10 | 1.10 |
| 20-yr O&Sd | 5.8 | 5.8 |
| Total | 16.4 | 20.3 |
aThe FY 2012 MDA GMD system program RDT&E budget for development and procurement was not broken down by MDA. The total acquisition cost range estimate listed above consists of the total requested funds from FY 2010 through FY 2016 of $6.8 billion plus costs projected forward for the (1) minimum estimate for another 4 years through FY 2020 of $3.9 billion and (2) maximum estimate for another 8 years through FY 2024 of $7.7 billion based on the same average projected annual budget level of $965 million as the FY 2012 FYDP.
bIn the FY 2012 FYDP PB, MDA requested budget for an interceptor force quantity buy from FY 2010 to FY 2016 of 12, which consists of 1 upgraded and fielded GBI and 11 new GBIs (numbers 34 through 44).
cThe funds for the actual construction of the 14 silos and related facilities for Missile Field 2 are listed under the MDA FY 2012 FYDP PB MILCON budget.
dThe total O&S cost over a 20-yr service life is based on an average annual sustainment costs for the GMD system estimated at $290 million (in FY 2010 dollars) for the missile fields, silos, and interceptors located at both Ft. Greely and VAFB.
• The sustainment funding for the missile fields, silos, command and control operations, and maintenance for ensuring 30 operationally available interceptors and additional test interceptors will be in place at both FGA and VAFB.
Aegis SM-3 Systems
Since both the SM-3 Block IIA codevelopment and SM-3 Block IIB or Aegis Ashore programs are relatively new programs of record that were covered earlier, this section is limited to providing a summary of the total Navy and MDA Aegis system investment costs through FY 2009, the average unit procurement costs of SM-3 Blocks IA and IB, and a discussion of projected sustainment costs of these ship-based missiles.
Relevant System Investment Costs
Table E-30 lists the total investment cost of approximately $17 billion and the average annual investment costs for earlier and current BMD Aegis programs from FY 1964 through FY 2009. The table includes program investments beginning with the initial Navy-funded investments (shaded rows) in the Aegis Weapon System program consisting of both the development of the SM-2 (RIM-66C) missile and the AN/SPY-1A radar beginning in FY 1964 and continuing forward
TABLE E-30 Aegis System Investment Costs Through FY 2009 (FY 2010 dollars)
| Cost Element | Program Time Frame | Total Investment (billions) | Average Annual Investment (millions) |
| Navy Aegis Weapon System (RIM-66C SM-2 and AN/SPY-1A) | 1964-1985 | 2.5 | 115 |
| Navy Aegis SM-2 Blocks I to IV | 1987-2002 | 1.2 | 140 |
| Sea-based Navy theater area TBMD DEM/VAL and EMD | 1993-2002 | 6.2 | 686 |
| SM-2 Blocks IVA and V and VLS canisters procurement | 1999-2001 | 0.3 | 93 |
| BMD Aegis block development | 2002-2009 | 6.9 | 865 |
| BMD Aegis procurement | 2009 | 0.1 | 103 |
| Total Navy and MDA investment | 16.9 | ||
with SM-2 Block I through IV program development efforts through FY 2002. (This table also includes Aegis BMD software development costs.) In parallel, originally BMDO and now MDA continued parallel program investments in initially developing sea-based and Navy theater area ballistic missiles beginning in FY 1993, followed by the procurement of SM-2 Blocks IV and V interceptors as well as vertical launch system (VLS) canisters in the FY 1999 through FY 2001 time frame.
The next-generation SM-3 program was initiated in FY 2002 with the BMD Aegis block development program, which continues through the FY 2012 FYDP along with the parallel procurement of the first 71 SM-3 Block IA interceptors manufactured using MDA RDT&E funds beginning in FY 2009. According to the MDA FY 2012 FYDP budget, 61 of these interceptors are expected in the inventory by the end of FY 2010. The first 34 SM-3 Block IB interceptors are currently being produced using MDA RDT&E funds beginning in FY 2011.
System Acquisition Costs
From FY 2010 through FY 2016, the BMD Aegis RDT&E budget of approximately $7.5 billion continues, with the incremental development of Block 3.6.1 for the PAA Phase 1 midcourse and terminal layer defense and of Block 4.0.1 for improved radar tracking accuracy and RF discrimination, an improved SM-3 Block IB kinetic warhead, a Block 5.0 Aegis modernization program, a Block 5.0.1 improved terminal defense capability, and other activities.
As reported in the MDA FY 2011 FYDP budget, Table E-31 provides the cumulative AUPC estimate of $9.6 million for SM-3 Block IA interceptors based
TABLE E-31 Aegis SM-3 Average Unit Procurement Costs (FY 2010 million dollars)
| Cumulative Average Unit Cost | Total Quantity | Fiscal Year | Annual Lot Quantities | Average Unit Cost per Lot | |
| SM-3 Block IA | 9.6 | 41 | FY 2009 | 23 | 9.3 |
| (last two lots) | FY 2010 | 18 | 10.0 | ||
| SM-3 Block IB | 9.3 | 290 | FY 2011 | 8 | 11.6 |
| FY 2012 | 66 | 10.3 | |||
| FY 2013 | 72 | 9.4 | |||
| FY 2014 | 72 | 8.8 | |||
| FY 2015 | 72 | 8.5 | |||
NOTE: As stated, the costs listed came from the MDA FY 2011 FYDP budget details. (DOD, 2010, Department of Defense Fiscal Year (FY) 2011 President’s Budget Missile Defense Agency Justification Book, Volume 2c, Research, Development, Test & Evaluation, Defense-Wide–0400). The committee elected to use these costs rather than the data provided by MDA in the “AB Cost Estimates Supporting MDA Cost,” presentation to the committee, March 1, 2010, because the latter lacked the AUPC estimates by annual lot production quantity to allow comparison with the other missile systems.
on a total quantity of 41 manufactured over two recent annual production lots, where FY 2009 costs are based on actual budget expenditures and FY 2010 on approved budgets. SM-3 Block IA production is scheduled to be completed around the second quarter of FY 2012.
Table E-31 also lists the cumulative AUPC estimate of $9.3 million for each SM-3 Block 1B based on a total buy quantity of 290 produced over the annual lot quantities listed below beginning with 8 in FY 2011, followed by 66 in FY 2012, and continuing on at 72 a year from FY 2013 through FY 2015. Further details on the computed cost improvement, or learning curve calculations, for SM-3 Block IB missile production are provided in the final main section.
System O&S Costs
With regard to Aegis BMD system O&S costs, MDA and the “Aegis BMD [program] negotiated agreements with the U.S. Navy for the [operation] and maintenance of BMD systems onboard U.S. Navy ships.”46 In the fall of 2005, the U.S. Navy (IWS3A) and the MDA BMD Aegis program office signed a memorandum of understanding (MOU) that established an O&S cost share for the sustainment of SM-3 Block IA missiles and the AWS BMD 3.6.1 Aegis ships, with the U.S. Navy being responsible for supplying funds for unit-level operations and indirect support personnel, contractor logistics support, support equipment, and staffing as the lead service project office.
MDA’s portion of the O&S cost share is currently based on support efforts leveraged off existing contracts and infrastructure. In the FY 2011 FYDP budget, MDA specifically requested SM-3 missile sustainment funds of $64 million (in FY 2010 dollars) for O&S activities providing the U.S. Navy with (1) “in-service engineering support,” (2) “[operations] and maintenance training for Aegis BMD ship crews,” (3) “logistics support including technical manuals, spares,” etc., (4) “reliability, maintainability and availability” (RM&A) analyses products, (5) “leadership and engineering/technical support to conduct Aegis Combat Systems Assessments,” and (6) responses “to fleet issues related to Aegis BMD installations, BMD operations and BMD [emergent] events.”47 In addition, the MDA BMD Aegis program office provided the committee with a set of annual O&S cost estimates from FY 2010 through FY 2015 for the SM-3 Block IA and the AWS BMD Block 3.6.1 systems and the SM-3 Block IB and AWS BMD 4.0.1 systems.
The MDA BMD Aegis program office provided a set of annual O&S costs from FY 2010 through FY 2015 similar to its GMD GBI O&S cost element breakdown.48Table E-32 lists the total average annual O&S cost estimates for
_____________
46Ibid.
47Ibid.
48MDA, “AB Cost Estimates Supporting MDA Cost,” presentation to the committee, March 1, 2010.
TABLE E-32 Aegis SM-3 System Average Annual O&S Cost (FY 2010 million dollars)a
| O&S Cost Elements | FY 2010 Through FY 2015 Average |
| SM-3 Block IA | |
|
Initial spares |
1.7 |
|
Engineering support |
1.5 |
|
Missile surveillance |
1.0 |
|
Recertification |
4.4 |
|
PHS&Tb |
0.3 |
|
Fleet/RM&A supportc |
0.3 |
|
Transportation |
0.1 |
|
Software |
0.7 |
|
Total |
9.9 |
| AWS BMD 3.6.1 | |
|
AWS upgrades |
7.3 |
|
Training |
1.3 |
|
Total |
8.6 |
| SM-3 Block IB | |
|
Initial spares |
20.2 |
|
Engineering support |
1.8 |
|
Missile surveillance |
1.2 |
|
PHS&Tb |
0.3 |
|
Fleet/RM&A supportc |
0.3 |
|
Transportation |
0.8 |
|
Software |
0.8 |
|
Total |
25.5 |
| AWS BMD 4.0.1 | |
|
Test ship under way |
14.0 |
|
AWS upgrades |
47.3 |
|
LRS&T equipment |
5.4 |
|
Engage equipment |
5.4 |
|
Total |
72.0 |
NOTE: The average annual cost of SM-3 Block IA and AWS BMD 3.6.1 is for FY 2010 through FY 2015 and that of SM-3 Block IB and AWS BMD 4.0.1 is for FY 2013 through FY 2015.
aSince an MOU is not currently in place for the SM-3 Block 1B missiles and AWS BMD 4.0.1 assets for Aegis ships, the MDA program office based the estimates for these two tables on the assumption that the U.S. Navy will agree to the same sustainment roles and responsibilities and an O&S cost share similar to that for SM-3 Block IA and AWS BMD 3.6.1. Since low rate initial production for the SM-3 Block IB missiles is currently under way, this set of O&S costs were reported at an 80 percent level of confidence.
bPHS&T, packaging, handling, shipping, and transporting the SM-3 missiles.
cRM&A, reliability, maintainability and availability.
the SM-3 Block IA and AWS BMD 3.6.1 combination, which over that time frame represents the sustainment, on average, of 40 missiles and related AWS
sustainment of 14 Aegis.49 Since the BMD Aegis schedule as of November 2009 displayed full-rate production for SM-3 Block IB missiles continuing through the middle of FY 2013, the committee elected to compute the average annual O&S costs for this SM-3 block of missiles and corresponding AWS BMD 4.0.1 Aegis ship assets beginning in FY 2013 through FY 2015 under more fully deployed steady-state conditions. Table E-32 also lists the average annual O&S cost estimates for SM-3 Block IB and AWS BMD 4.0.1 systems, which is based on the same MDA sustainment roles and responsibilities as the previous SM-3 Block IA missiles and AWS BMD 3.6.1 systems. Based on this same premise, the average annual O&S costs over the FY 2103 through FY 2015 time frame represent MDA’s sustainment of 102 Block IB missiles and 12 Aegis ships.50
THAAD Systems
Relevant System Investment Costs
The THAAD system investment began with BMDO funding a demonstration and validation (DEM/VAL) program beginning in FY 1992 and continued through an engineering, manufacturing, and development (EMD) through FY 2003 for the missile system, which includes the tactical support group (TSG), launcher, and ground-based radar. Table E-33 lists the total annual investment of over $16 billion in the THAAD system from FY 1992 through FY 2009. This investment includes the average annual investment over the first two phases of the development program through preplanned product improvement of $872 million over this initial 12-yr time frame, followed by the MDA THAAD block development program continuing through the next 6 years from FY 2004 through FY 2009 at an annual investment of over $1.1 billion per year, which is approximately 25 percent higher.
System Acquisition Costs
According to the MDA FY 2012 FYDP PB, the THAAD program is continuing block development and concurrently expending procurement funds first initiated in FY 2009 for LRIP. Even though the first 50 THAAD interceptors were produced using RDT&E funds, the average missile unit costs are based on
_____________
49The cost per missile and per ship is based on the Aegis program office estimate of the average MDA O&S cost per SM-3 Block IB missile of approximately $0.25 million per year. The average MDA O&S cost per ship for AWS BMD 3.6.1 of approximately $0.60 million per year does not include the cost of this AWS block installation, checkout, and testing on the Aegis ships, which was completed before FY 2010.
50The average annual O&S cost per Aegis ship for this AWS Block upgrade is significantly higher than that for previous block upgrades since it also includes the integration, checkout, and testing on the ships concurrent with the deployment of SM-3 Block IB missiles.
TABLE E-33 THAAD System Investment Costs Through FY 2009 (FY 2010 dollars)
| Program Time Frame | Total Investment (billions) | Average Annual Investment (millions) | |
|
DEM/VAL EMD (included ground-based radar) |
1992-2003 | 9.6 | 872 |
| Block development | 2004-2009 | 6.7 | 1,123 |
| Procurement | 2009 | 0.1 | 106 |
| Total investment | 16.4 | ||
TABLE E-34 THAAD Average Unit Procurement Costs (FY 2010 million dollars)
| Cumulative Average Unit Cost | Total Quantity | |
| THAAD interceptor | 11.2 | 431 |
| Launcher | 6.7 | 60 |
| TSG | 10.7 | 18 |
reported annual procurement budgets and lot quantity buys beginning in FY-2010 and continuing at the rate of between 65 and 68 per year from FY 2011 through FY 2016.
Table E-34 displays THAAD system AUPC costs for the missiles of $11.2 million based on a total production quantity of 431, for launchers of $6.7 million based on a total quantity of 60, and for TFCC Tactical Support Groups (TSGs) of $10.7 million based on a total quantity of 18. The missile AUPC estimates provided by the MDA Director of Estimating (DOE) THAAD cost team assume that there will be no production breaks, no design changes, no unforeseen cost overruns, and no cost, technical, or schedule problems during full-rate production.51 For the THAAD missile, the MDA DOE THAAD cost team assumed a learning curve of 93 percent. This is consistent with the committee’s detailed calculations of the computed cost improvement, or learning curve calculations, for the THAAD missile production that are provided in the section “THAAD.”
The estimates for the launcher and TFCC TSG units are fixed-price estimates with no cost improvement or learning curve savings over the quantity produced. According to the MDA FY 2011 FYDP budget, TSG average unit costs are based on a production rate of four per year from FY 2013 through FY 2015. The aver-
_____________
51MDA. 2010. “DOE Cost Estimates Supporting NAS: THAAD Cost Team,” February 26. Due to the delay in the start of production, these quantities are slightly higher than the total procurement quantities of 427 missiles, 54 launchers, and 15 TSGs requested in the MDA FY 2012 FYDP PB through FY 2016.
age cost for procuring a THAAD battery, without the AN/TPY-2 terminal mode radar, ranges from a current estimate of $695 million to a projected $530 million with the continued interceptor lot buys through the FY 2015 time frame.
System O&S Costs
According to the MDA FY 2011 FYDP budget details, sustainment funds are for providing THAAD batteries with the “logistical support to field, operate, maintain, repair and replenish the THAAD weapon system as it [is] fielded to the Army. [It includes funds for] contractor logistics support (CLS) technicians responsible for field and sustainment maintenance, including the repair and supply chain management of the required spares and repair parts.”52 The specific CLS annual cost for the THAAD radar software maintenance for implementing the software maintenance plan required for postdeployment software sustainment (PDSS) is covered later in this appendix in the section after next, “AN/TPY-2 Radar Systems,” as part of the average O&S cost estimate for the AN/TPY-2 radar.53
Table E-35 summarizes the THAAD system total annual O&S costs with subtotals reflecting the MDA and assumed U.S. Army projected shares as an average estimate over the FY 2010 through FY 2015 time frame. The table also breaks out the subtotals by O&S cost element.
System Life-Cycle Costs
From FY 2010 forward, the THAAD system LCC range estimates for development, procurement, and 20-yr O&S costs, between $14 billion and $16 billion are listed in Table E-36. The total estimate from FY 2010 forward includes the following:
• The requested funding for FY 2012 FYDP PB from FY 2010 through FY 2016 for the THAAD development program, at approximately $2.5 billion, and the procurement program, at $5.2 billion, to procure 427 additional THAAD interceptors, launchers, and TSG workstations by FY 2016.
• The sustainment funding for operating and maintaining nine THAAD batteries over a 20-yr service life.
Consistent with the MDA FY 2011 and FY 2012 FYDP PB funding, the development and procurement cost estimates for AN/TPY-2 terminal mode radars
_____________
52See MDA, FY-2011 FYDP Research, Development, Test & Evaluation, President’s Budget, Exhibit R-2, RDT&E Budget Item Justification, BA 4: Advanced Component Development & Prototypes (ACD&P), PE 0603882C: Ballistic Missile Defense Mid-Course Segment, February 2010.
53In the THAAD FY 2010 sustainment plans, Lockheed Martin provides 100 percent of the CLS responsible for fielding two battery systems and sustaining maintenance of all the hardware. Raytheon provides the CLS for the AN/TYP-2 radar and associated PPU.
TABLE E-35 THAAD System Average Annual O&S Cost (FY 2010 million dollars)
| Cost Element | FY 2010 Through FY 2015 Average Annual O&S Cost |
| Sustaining supporta | 20.5 |
| GFE and support equipment modification kits replacementb | 1.3 |
| Logistics supportc | 17.0 |
| Phase adaptive approachd | 93.3 |
| MDA subtotal | 132.1 |
| Petroleum, oil, and lubricantse | 0.8 |
| GFE spares, repair parts, depot maintenancef | 13.4 |
| Indirect supportg | 7.8 |
| Military personnelh | 45.9 |
| Army subtotal (see NOTE) | 68.0 |
| Total | 200.0 |
NOTE: The total annual O&S cost estimates and the breakdown by cost elements were provided by the MDA DOE THAAD cost team from FY 2010 through FY 2015. (See MDA, DOE THAAD Cost Team, “DOE Cost Estimates,” presentation to the committee, February 26, 2010. A separate discussion of the AN/TPY-2 forward-based radar recurring unit cost and annual O&S costs was discussed in Appendix I.) The average annual cost in FY 2010 dollars is summarized by O&S cost elements for both MDA and the assumed U.S. Army portion of the sustainment not covered under the MDA FY 2011 FYDP budget for the program element for the BMD terminal defense segment. The sustaining support cost element covers the annual O&S estimate for the interceptor, TFCC, and launcher. The O&S costs assume that the full complement of 48 interceptors, 6 launchers, and 2 TFCC units needed for fielding a total of 9 THAAD batteries will be fully deployed by FY 2015. The estimates are based on the MDA DOE THAAD cost team’s projections for this fiscal year. The total average O&S cost per year is approximately $38.7 million per year (in FY 2010 dollars), which does not include the O&S cost for the AN/TPY-2 terminal mode radar. The GFE and support equipment modification kits replacement costs cover the TFCC and launcher.
aSustaining support costs cover the interceptor; TFCC and launcher and weapon system engineering; integrated logistics support; system testing; and program management.
bThe cost of GFE, support equipment, and modification kit replacements covers TFCC and the launcher.
cLogistics support costs cover the interceptor, TFCC, and the launcher.
dThe MDA DOE THAAD cost team added this cost element for the Phased Adaptive Approach (PAA) even though the funds were not defined in its briefing to the committee. This PAA cost element was also not separately identified in funded elements reported in the MDA FY 2011 FYDP budget under the program element for the BMD terminal defense segment for THAAD.
eU.S. Army POL cost estimates are for the ground vehicles transporting the TFCC, launcher, and THAAD battery common and peculiar equipment.
fU.S. Army O&S cost estimates are for procuring GFE, spares, repair, and parts for performing depot maintenance for the TFCC and the launcher.
gU.S. Army indirect support costs are for sustainment of the entire THAAD battery suite of equipment, except for the AN/TPY-2 radar and PPUs.
hU.S. Army military personnel costs are for operating and maintaining the entire THAAD battery suite of equipment except for the AN/TPY-2 radar and the PPU.
TABLE E-36 THAAD System Total LCC Estimate (FY 2010 billion dollars)
| Minimum | Maximum | |
| Developmenta | 4.0 | 5.4 |
| Procurementb | 5.8 | 6.6 |
| Force quantity buyc | 471 missiles | 527 missiles |
| MILCON | None required | None required |
| 20-yr O&Sd | 4.0 | 4.0 |
| Total | 13.8 | 16.0 |
aThe THAAD development cost range estimate of $4.0 billion to $5.4 billion is based on projecting the FY 2012 MDA THAAD system development total requested funds from FY 2010 through FY 2016, $2.5 billion, forward through the FY 2020 to FY 2024 time frame at the same continued annual average expenditure rate of approximately $360 million for at least 4 more and up to 8 more years. The additional MDA (and possibly Army) RDT&E funding is assumed to continue block development improvements and the sustaining engineering necessary until nine fully configured and operational THAAD batteries are in place and the total operations, support, and material sustainment role is fully transitioned over to the Army.
bThe THAAD procurement cost range estimate of approximately $5.8 billion up to $6.6 billion is based on the FY 2012 MDA THAAD system program procurement total requested funds from FY 2010 through FY 2016 of $5.3 billion and $0.5 billion to $1.3 billion of additional funds after FY 2016 for funding the procurement of at least 44 and at most of 100 additional THAAD missiles plus six launchers, two TSG workstations, and any additional peculiar support equipment and other hardware necessary to fully configure nine Army batteries.
cThe total force buy quantity of between 461 and 527 THAAD missiles will cover the total operational quantity needed for fully configuring nine Army batteries and the expendable assets to cover THAAD missile flight tests and operational readiness training exercises necessary from FY 2011 through the FY 2016 time frame.
dThe committee estimated the THAAD system O&S annual average cost at $200 million (in FY 2010 dollars). The cost consists of both the MDA and Army portions for sustaining and fielding nine deployed batteries with each battery fully configured with 48 interceptors, 6 launchers, and 2 TFCC units.
for the THAAD systems as well as the THAAD battery O&S costs for sustaining these radars over 20 years are not included here; they are, however, covered separately later in this appendix (see Table E-41).
PAC-3 Systems
Relevant System Investment Costs
Table E-37 summarizes the total DOD and Army investment of close to $16 billion from FY 1983 through FY 2009 beginning with the PAC-3 development program and continuing forward for 21 years to FY 2003 at an average investment of $183 million per year. Since FY 2004, the investment in PAC-3 was and still is primarily the responsibility of the Army (shaded rows), including the commitment of procurement funding for producing a total of 975 missiles through
TABLE E-37 PAC-3 System Investment Costs Through FY 2009 (FY 2010 dollars)
| Program Time Frame | Total Investment (billions) | Average Annual Investment (millions) | |
| PAC-3 RDT&E (defense-wide) | 1983-2003 | 3.8 | 183 |
| Army PAC-3 RDT&E | 2004-2005 | 0.2 | 122 |
| Army PAC-3 procurement (quantity = 975) | 1997-2009 | 9.0 | 696 |
| Army PAC-3 modifications | 2000 (est.)-2009 | 2.8 | 282 |
| Total DOD and Army investment | 15.74 | ||
FY 2009. The Army’s LRIP of PAC-3 missiles began in the fourth quarter of FY 1999, and the first unit was delivered in September 2001.54 The system IOT&E was completed by September 2002, and IOC was declared in June 2004. IOC was achieved when the first Patriot operational battalion was fully equipped with five FUs and 32 PAC-3 missiles per FU. By the end of FY 2003, 268 missiles had been produced, and after that the Army procured another 707 missiles through FY 2009.
System Acquisition Costs
Table E-38 provides both the PAC-3 missile cumulative average AUPC costs estimated at $3.1 million based on the MDA FY 2012 FYDP budget for a total quantity of 225 missiles, and the annual lot quantities from FY 2010 through FY 2012. In the Army FY 2012 RDT&E PB, there is a total budget of $366 million from FY 2011 through FY 2016 for development of a missile segment enhancement (MSE) upgraded PAC-3 missile. The Army plans to procure 294 upgraded PAC-3 missiles from FY 2013 through FY 2016 at a total estimated cost of $2.1 billion and to buy another 1,234 MSE missiles after FY 2014 for a total inventory quantity of 1,528 missiles.
Table E-39 lists the PAC-3 Battalion AUPC estimates for each of the main equipment hardware elements listed for each Army battery fire unit.55 The Patriot battery fire unit total AUPC range estimate includes support equipment; the lower bound of approximately $237 million represents the total of the hardware element unit costs and the upper bound of $260.5 million includes a 10 percent contingency cost along with the costs provided to the committee by the Army.56
_____________
54Most of the PAC-3 historical information was based on the Army’s Patriot PAC-3 Dec-09 Selected Acquisition Report (SAR) and Army FY-11 RDT&E and Procurement Budget submitted in February 2010.
55“Patriot Battery/Battalion Life Cycle Cost provided to NAS,” U.S. Army Air and Missiles Defense Lower Tier Project Office Program Executive Office.
56Ibid.
TABLE E-38 PAC-3 Missile Average Unit Procurement Costs (FY 2010 million dollars)
| Fiscal Year | Cumulative Average Unit Cost | Total Quantity | Annual Lot Quantities | Average Unit Cost per Lot |
| FY 2010 | 3.13 | 225 | 59 | 3.42 |
| FY 2011 | 78 | 3.11 | ||
| FY 2012 | 88 | 2.94 | ||
TABLE E-39 PAC-3 Battery Fire Unit Equipment AUPC (FY 2010 million dollars)
| FU Equipment | Average Unit Cost | Quantity per Battery |
| Radar system | 103.0 | 1 |
| Engagement control station | 26.8 | 1 |
| Antenna mast group | 10.5 | 1 |
| Battery command post | 7.5 | 1 |
| PAC-3 launching station | 7.4 | 6 |
| Enhanced launcher electronic system (ELES) | 5.4 | 6 |
| Electrical power plant | 3.1 | 1 |
| Others | 0.6 | 6 |
| FU support equipment | 7.3 | 1 |
| Total battery cost (less PAC-3 missiles) | 236.8-260.5 |
System Life-Cycle Costs
The Army PAC-3/MSE system LCC range estimates for development, procurement, and 20-yr O&S costs are presented in Table E-40. The total estimate from FY 2010 forward includes the following:
• From FY 2010 forward, the requested Army funding for FY 2012 FYDP RDT&E PB of $0.4 billion for the upgraded PAC-3 MSE development program, and the total procurement budget requested of approximately $5.4 billion for the remaining procurement of another 275 PAC-3 missiles through FY 2012 ($1.5 billion); PAC-3 modifications ($1.4 billion), and 292 new PAC-3 MSE upgraded missiles and other hardware ($2.1 billion), the latter two programs over this FY 2010 through FY 2016 7-yr time frame.
• The projected Army O&S and military personnel (MILPERS) estimates for operating and supporting the entire Army force of 15 PAC-3 battalions over a 20-yr service life of approximately $14 billion to $16 billion.57
_____________
57Ibid.
TABLE E-40 Army PAC-3/MSE System Total LCC Estimate (FY 2010 billion dollars)
| Minimum | Maximum | |
| Developmenta | 0.36 | 0.44 |
| Procurementb | 11.5 | 16.9 |
| Force quantity buy | 275 new PAC-3 + 1,528 MSE missiles (and PAC-3 modifications) | |
| MILCON | None required | None required |
| 20-yr O&Sc | 14.7 | 16.2 |
| Total 20-yr LCC estimate | 26.7 | 33.5 |
aThe PAC-3/MSE development cost estimate of $0.4 billion is based on the FY 2012 Army RDT&E budget requested for the upgraded PAC-3 MSE system, approximately $366 million from FY 2011 through FY 2016.
bThe PAC-3/MSE total procurement cost range estimate of between $11.5 billion and $16.9 billion comprises funding for three programs. The estimate is based on the FY 2012 Army missile procurement total requested from FY 2010 through FY 2016 of approximately $5.4 billion for another 275 PAC-3 missiles, 292 new MSE missiles, and annual PAC-3 procurement modification funds over this 7-yr time frame. The procurement cost also includes the projected cost of completing the Army’s planned procurement of another 1,234 MSE missiles at an estimated total cost of between $5.6 and $8.9 billion. The lower bound, or minimum cost estimate, is based on the Army’s cited budget to complete the production run (in FY 2010 dollars), with an assumed learning, or cost improvement, curve savings based on an average annual lot buy of 80 missiles. The upper bound, or maximum cost, estimate is based on applying the same allocated average procurement unit cost per missile for the first 294 MSE missiles projected forward over the remaining buy of 1,234 missiles at the same lot buy rate of 80 missiles per year. Finally, the procurement cost range estimate also includes funds for continuing the PAC-3 procurement modification kits beyond FY 2016 time frame. The lower bound, or minimum cost, was based on the Army’s cited procurement budget to completion of over $0.8 billion. As an upper bound, the committee estimated the total PAC-3 procurement modification costs at approximately $3.0 billion, based on continuing to provide annual funds at the same level as the requested Army FY 2012 FYDP funding through FY 2016 of approximately $200 million, projected forward for another 15 years through the end of the MSE production of 1,234 missiles through FY 2030.
cGiven a total force quantity of up to 1,500 PAC-3 missiles and another 1,528 MSE missiles, the total PAC-3/MSE system 20-yr O&S cost of between $14.7 and $16.2 billion represents the projected total O&M and military personnel (MILPERS) system costs going forward for operating and supporting the Army fleet of 15 Patriot battalions. The O&S annual average cost per battalion of between $49 million and $54 million (in FY 2010 dollars) is based on sustaining four dedicated PAC-3/MSE batteries and a complement of launchers, radars, fire control units, other hardware, and support equipment. The committee’s range estimate is supported by data provided by the previous reference cited in footnote 55.
AN/TPY-2 Radar Systems
Relevant System Investment Costs
Even though development costs for an earlier version of THAAD radars may have been initiated before FY 2003, it was decided to track and aggregate MDA investments in development costs for the AN/TPY-2 radar beginning in FY 2011, with the BMDS radar block effort of 2006 and use of the TPS-X radar as a test bed for designing a forward-deployable radar with modified software algorithms for tracking and discrimination. In FY 2003, this radar block development was concurrent with the THAAD block design of 2004 and development of an interceptor against short- to medium-range ballistic missiles and asymmetric threats and demonstrations of exoatmospheric and high endoatmospheric intercept capability against a limited target set.
A transportable version of the forward-deployable X-band radars (FBX-T) was designed and deployed at VAFB and in Japan through FY 2006. During FY 2006, the FBX-T and THAAD radars were both designated as AN/TPY-2 radars. Block 2006 consists of an AN/TPY-2 basic program to develop releases of the software that allow searching and tracking in a forward-based role and to incorporate discrimination algorithms from Project Hercules.58 The funds also covered development of other radar software and the use of modeling and simulation, hardware-in-the-loop testing, and validation of algorithms with the TPS-X radar at the Pacific Missile Range Facility.
Through the end of FY 2009, two more radar block development efforts were under way. Block 2008 focused on delivering updated software with new releases that were common to support AN/TPY-2 forward-based and THAAD radar missions and on the design of a mechanical steering kit to provide the AN/TPY-2 with real-time slewing in both azimuth and elevation. Block 2010 development focused on (1) upgrading the software based on discrimination database enhancements and (2) continuing to support the two radar missions.
Table E-41 summarizes the total MDA investments of $2.3 billion in AN/TPY-2 radar block developments and procurements as well as radar test and evaluations with SBX radars from FY 2003 through FY 2009.
System Acquisition Costs
MDA also provided the committee in February 2010 with an AUPC estimate for the AN/TPY-2 radar system of $210.8 million.59 However, since the MDA
_____________
58Project Hercules funding was covered as part of MDA’s Advanced Technology program and continued through FY 2010. It focused on developing algorithms and software in the context of persistent sensor coverage, pervasive weapons coverage, global battle management, effective targeting, and improved effectiveness in advanced environments.
59Missile Defense Agency Fiscal Year (FY) 2012 Budget Estimates, Procurement Defense-Wide, BMDS AN/TPY-2 Radars Procurement, Exhibit P-40, Budget Item Justification, February 2011.
TABLE E-41 AN/TPY-2 Radar System Investment Costs Through FY 2009 (FY 2010 dollars)
| Program Time Frame | Total Investment (billions) | Average Annual Investment (millions) | |
|
AN/TPY radar block developmenta |
2003-2009 | 0.8 | 118 |
|
AN/TPY-2 procurementb |
2003-2009 | 1.4 | 353 |
|
SBX and AN/TPY-2 radar test and evaluationc |
2008-2009 | 0.1 | 49 |
|
Total investment |
2.3 | ||
aEven though MDA estimated for the committee sunk costs of $630 million (in FY 2010 dollars) associated with the AN/TPY-2 radar system development, these estimates only covered flight testing and BMDS ground testing. (The information is from MDA “TPY-2 Cost Estimate Supporting MDA Cost Presentations to National Academy of Sciences (NAS),” presentation to the committee, February 24, 2010.) As a result, the committee elected to base historical development costs during this time frame on a higher estimate of $828 million (in FY 2010 dollars) based on funds extracted from MDA FY 2004 through FY 2010 RDT&E budget justification sheets for the BMDS sensor program. These efforts focused on radar block developments described above and modeling and simulation, as well as ground and flight tests and evaluations.
bFrom FY 2003 through the end of FY 2009, six currently designated AN/TPY-2 radar systems have been produced and fielded, with a seventh system in production and expected to have been delivered in FY 2010. The procurement cost estimate listed above was provided as a sunk cost by MDA and represents the production cost estimate for AN/TPY-2 systems prior to FY 2010. (The MDA production cost estimate is relatively consistent with the magnitude of funds reported in the MDA FY 2003 through FY 2010 RDT&E budget justification sheets for the BMDS sensor program for this radar system’s production, site activation and deployment, and system refurbishment costs.)
cBeginning in FY 2008 as part of the BMDS sensor program budget an effort was initiated for the joint testing and evaluation activities for both the AN/TPY-2 and the sea-based X-band radar (SBX) systems. This effort continues through FY 2015 using funds allocated and listed above.
FY 2012 FYDP PB was released, the committee elected to use the lower AUPC estimate for the procurement of 11 AN/TPY-2 radar systems costing $179 million based on the annual budget for one in FY 2010 and two per year from FY 2012 through FY 2016.
System O&S Costs
For TM-configured radars, the MDA annual average O&S cost per system varies from a minimum of $14.9 million per system for two systems to be fielded in FY 2011 to a maximum of $20.7 million per system projected for three operational systems in the FY 2012 to FY 2013 time frame. However, MDA stated that these sustainment cost estimates do not include THAAD site-specific support costs or the annual Army military personnel, security, and base operations costs, which are included as part of the THAAD system sustainment costs.
Therefore in order to get a more complete set of support cost estimates for the TM-configured AN/TPY-2 radar, the committee included and computed radar-specific average annual O&S cost estimates per system based on the FY 2010 through FY 2015 annual costs provided by the MDA THAAD project office for the following sustainment activities funded specifically for AN/TPY-2 radar:60
• Sustaining and logistics support,61
• Repair of GFE and support equipment and procurement of replacement modifications for fielded radar systems, and
• Army-funded procurement of additional government-furnished equipment, replenishment spares and repair parts, and depot maintenance.
The average annual O&S cost for these cost elements over these 6 years is $22.7 million. The average annual cost per THAAD TM radar varies from a minimum additional cost of $5.0 million per year for five radars fielded in FY 2014 to a maximum additional cost of $11.0 million per year for two radars fielded in FY 2011 (all in FY 2010 dollars).
Finally, the committee included an allocated annual O&S cost for the Army-funded indirect support and military personnel costs portion of the THAAD interceptor system cost for sustaining the fielded TM-configured radar. The average annual O&S cost for these elements over these 6 years is $5.5 million. The average annual cost per THAAD TM radar varies from a minimum additional cost of $1.4 million per year for five radars fielded in FY 2014 to a maximum additional cost of $2.7 million per year for two radars fielded in FY 2011 (all in FY 2010 dollars).
In summary, the total annual O&S cost per TM-configured AN/TPY-2 radar varies from a minimum cost of $21.3 million per system to a maximum of $34.4 million per system (in FY 2010 dollars).
System Life-Cycle Costs
From FY 2010 forward, the AN/TPY-2 radar system LCC range estimates for continuing X-band radar incremental development, the planned procurement of 11 systems through FY 2016, and 20-yr O&S costs of sustaining these forward-based radars is approximately $18 billion to $24 billion (Table E-42). The total estimate from FY 2010 forward includes the following:
• The requested funding for FY 2012 FYDP PB from FY 2010 through FY 2016 for the BMD radar development program at approximately $4.0 billion
_____________
60MDA. 2010. “DOE Cost Estimates Supporting NAS: THAAD Cost Team,” February 26.
61In the THAAD FY-10 Sustainment Plans, Raytheon provided 100 percent of the contractor logistics support (CLS) maintenance of fielded AN/TYP-2 radars. Raytheon under the CLS contract is responsible for engineering support and radar software maintenance services.
TABLE E-42 AN/TPY-2 Radar System Total LCC Estimate (FY 2010 billion dollars)
| Minimum | Maximum | |
| Developmenta | 4.0 | 5.7 |
| Procurementb | 2.0 | 2.0 |
| Force quantity buy | 11 | 11 |
| MILCON | None required | None required |
| 20-yr O&Sc | 12.1 | 16.6 |
| Total 20-yr LCC estimate | 18.1 | 24.3 |
aThe AN/TPY-2 development cost range estimate of $4.0 billion to $5.7 billion includes the FY 2012 MDA BMD radar block development requested budget (excluding FY 2010 sustainment funds) from FY 2010 through FY 2016 of $2.4 billion for transitioning the Block 2010 AN/TPY-2 development into an X-band basic effort for continuing the incremental releases of software algorithms (CX-1 and CX-2). These releases are for improving discrimination and enhancing the common software that supports AN/TPY-2 radar operations worldwide. The effort also included the development of critical engagement conditions and empirical measurement events where data are obtained from ground and flight tests as input to system models and simulations.
Since procurement and delivery of the radar planned in the FY 2012 FYDP time frame will not occur until after FY 2016, the committee estimated an upper bound, or maximum, cost estimate to account for continuing X-band development activities at least through the end of the FY 2020 time frame. The additional cost of $1.7 billion is based on the projecting the same average annual funding, approximately $340 million, forward for another 5 years.
bThe AN/TPY-2 radar system procurement cost estimate is based on the budget MDA requested in the FY 2012 FYDP PB of $2.0 billion, for 11 additional systems from FY 2010 through FY 2016 time frame.
cThe total O&S cost for sustaining 11 AN/TPY-2 radar systems over a 20-yr service life is based on all the radars operating in a stand-alone, forward-based, mode. The lower bound, or minimum, O&S cost estimated is based on the annual cost for three FBM-configured systems fielded in FY 2011 at $54.8 million per system, and the maximum estimate is based on $75.4 million per system for two FBM-configured operational systems fielded in FY 2010. As part of the Phase Adaptive Approach for the European missile defense system, MDA has proposed that each interceptor site location include a forward-based (FBM) AN/TPY-2 X-band radar system. The current estimate cited by MDA and used in a recent CBO report cited a projected annual sustainment cost of $70 million to operate this configured radar system in FY 2013. This projected annual O&S cost in constant FY 2010 dollars is comparable with the committee’s MDA-based maximum estimate of $75.4 million per system. However it should be noted that CBO increased the previously estimated MDA operations costs by 50 percent to account for the possible growth of these costs.
and the AN/TPY-2 procurement program at $2.0 billion for 11 additional AN/TPY-2 radar systems through FY 2016.
• The sustainment funding for operating and maintaining these 11 forward-based X-band radars over a 20-yr service life.
GBX (Stacked AN/TPY-2 Array) Radar System
The recommended Ground-Based Midcourse Defense-Evolved (GMD-E) deployment described in Chapter 5 takes advantage of the space-based SBIRS
and DSP satellite systems, as well as currently planned forward-based AN/TPY-2 radars, referred to as standalone X-band radar (FBX), located in Japan and at one or more locations north of Iran.
As also described in Chapter 5, the recommended GMD-E provides a significant enhancement in land-based radars through the introduction of a recommended doubling of existing AN/TPY-2 radars, one stacked on top of the other. For the purposes of this report, the recommended doubled AN/TPY-2 radars are designated as GBX radars, and they would be deployed at fixed sites co-located with the UEWR (ballistic missile early warning system (BMEWS)) radars (Cape Cod, Massachusetts; Grand Forks, North Dakota; Thule, Greenland; and Fylingdales, United Kingdom). Additionally, as a result of its analysis, the committee recommended in Chapter 5 that a fifth GBX radar be added at Clear, Alaska, and that the sea-based X-band (SBX) radar be moved permanently to Adak, Alaska.
Each GBX radar consists essentially of two non-mobile AN/TPY-2 radar systems with the two arrays mounted one above the other in a rigid assembly, coherently integrating the beam forming transmit and receive functions in the electronics and software. These double (or stacked) radars would be mounted on azimuth turntables (like the SBX radar) that could be mechanically reoriented (not scanned) through an azimuth sector of ~270 degrees.
Since the GBX utilizes existing proven designs and hardware with a now well-defined cost basis, it takes advantage of the learning curve, especially on the transmit/receive (T/R) modules that represent a significant cost of each radar.
Table E-43 provides a summary of the 20-year LCC for acquiring and sustaining the system at the five sites noted above and in Chapter 5.
The costing used for the GBX radar is based on AN/TPY-2 and SBX radar cost data. The development cost estimate covers the development and validation of electronics and software modifications and the fixed mount and turntable based on SBX radar estimates. The unit cost for the turntable and installation are derived from the estimated cost of the SBX radar turntable. The GBX radar is configured to provide double the power of the AN/TPY-2 radar and includes an FBX network communication package. All tractor/trailers used in the mobile systems are eliminated in favor of fixed pad mounting.
The GBX radar development cost range estimate is based on scaling down the new radar design effort needed by leveraging off of the proven heritage radar designs of the AN/TPY-2 phased array and receiver electronics hardware (at a total sunk development cost through FY 2009 of $2.3 billion), and an SBX analogous radar turntable. The resulting range estimate of between $0.8 and $1.0 billion is based on the reduced level of system development effort needed for designing GBX system-unique electronics and software to coherently integrate the two arrays; packaging and integrating the two stacked AN/TPY-2 phased arrays onto a turntable; and interfaces for adding an FBX network communications package of already designed electronics and developed software. The estimate also includes producing two system test articles and performing the end-to-end
TABLE E-43 GBX Radar System Total LCC Estimate (FY 2010 billion dollars)
| Minimum | Maximum | |
| Development | 0.8 | 1.0 |
| Procurement | 1.6 | 1.6 |
| Force quantity buy | 5 | 5 |
| MILCON | 0.1 | 0.2 |
| 20-yr O&S | 5.5 | 7.5 |
| Total 20-yr LCC estimate | 8.0 | 10.3 |
NOTE: These estimates do not include flight test costs as they are covered as separate line items for ongoing system validation in MDA’s budget.
radar testing needed to meet the expected system’s higher power and radar coverage and tracking performance requirements to support MDA’s Integrated Master Test Plan.
The GBX radar procurement cost estimate is based on continuing production using the same AN/TPY-2 radar manufacturing assembly “warm” line currently in place for producing the MDA-funded 11 AN/TPY-2 radar systems needed, and avoiding the nonrecurring production costs of restarting the AN/TPY-2 radar production line and incurring any production start-up tooling, testing, and line requalification costs. The average unit cost estimate of MDA’s procurement of 11 AN/TPY-2 radars is $181 million with the eleventh and last unit at $175 million. This buildup of the unit recurring cost is based on first extending the AN/TPY-2 production line and applying the same realized manufacturing assembly labor learning cost improvement curve efficiencies for assembling an additional 10 dismounted antenna units, cooling equipment units, diesel generator power units, and 5 modified electronic equipment units, including material cost unit price discounts in buying the quantity of T/R modules and other common parts from the same vendors at the higher total production lot quantities needed. The GBX radar average unit cost for a quantity of five systems is estimated to be $320 million—approximately $139 million higher than the average unit cost estimate of MDA’s procurement of 11 AN/TPY-2 radars. The GBX unit costs provide:
• Two antenna units without trailers, two cooling equipment units, and two prime power supply units;
• One electronics equipment unit modified to integrate the beam forming and receiving functions of the two antenna units;
• The turntable, its control and associated mounted interface hardware;
• An FBX network communication package; and
• Relatively more complex, additional system integration and end-to-end checkout cost over the AN/TPY-2.
The GBX-specific MILCON costs needed before deploying and operating the five new GBX radars was estimated by scaling down the previous costs in-
curred for constructing the infrastructure facility for the forward-based AN/TPY-2 radar operating in Israel based on assuming each GBX radar will be able to use existing co-located ground radar facilities at the current UEWR (BMEWS) sites noted above.
Finally, the GBX annual O&S estimates were based on adjusting the expenditures MDA provided to the committee for sustaining AN/TPY-2 radars in Israel to reflect use of the operating sites’ consolidation of government base security and early warning radar operations and support personnel as well as available standby power from the local electrical grid system already in place at the government sites.
SBX Radar System
Relevant System Investment Costs
The SBX radar as a midcourse defense sensor is capable of providing weapons task plans, in-flight target updates, TOMs, and kill assessments. The MDA investment in development of the SBX radar began in FY 2002 with an X-band radar technology development effort focused on providing high-resolution tracking and discrimination data to significantly enhance the GMD fire control and, subsequently, the EKV. The RDT&E funds also covered the development of software algorithms to enhance target discrimination, along with material component enhancements to improve output power and sensitivity. Concurrent with this radar development effort, the SBX program was also initiated, with long-lead parts procurement beginning in FY 2002; procurement of the sea-based platform, main radar structure, radar electronic components, and support equipment and construction of support structures and facilities began the following year. The plan was for delivery of one SBX radar test article for FY 2005. The RDT&E budget also included funds for an IFICS data terminal. The sea-based platform where the SBX was mounted was envisioned to be a modified seagoing, semisubmersible platform similar to the operational oil drilling platforms in use.
Table E-44 summarizes the total investment in the SBX system acquisition costs of $1.7 billion from FY 2002 through FY 2009.
System O&S Costs
The annual costs for operations and sustainment of the SBX radar and the vessel as an overall system are based on implementing a flexible support strategy with Pearl Harbor, San Diego, and Dutch Harbor as forward-support ports. The sustainment costs include XBR software maintenance, shipyard maintenance and certifications, and sustainment activities for the radar, vessel, and support
TABLE E-44 SBX Radar System Investment Costs Through FY 2009 (FY 2010 dollars)
| Program Time Frame | Total Investment (billions) | Average Annual Investment (millions) | |
|
Sea-based X-band (SBX) radar developmenta |
2002-2005 | 0.4 | 100 |
| SBX radar system procurementb | 2002-2005 | 1.0 | 245 |
| SBX radar enhancementsb | 2006-2009 | 0.3 | 75 |
| Total investment | 1.7 | ||
aOver a 4-yr period from FY 2002 through FY 2005, $1.4 billion of the $1.7 billion was associated with the SBX-specific X-band advanced technology development effort and concurrent procurement of the SBX radar system test article, modified the sea-based vessel platform, and IDT estimated at system unit cost of $980.5 million. As noted, the annual development funds identified for the X-band advanced technology effort explicitly earmarked for the SBX radar program were allocated as part of the BMD Midcourse Defense Segment program budget from FY 2002 through FY 2005. To the extent possible, the committee’s total development cost estimates generated from the MDA RDT&E budget from FY 2002 through FY 2009 were relatively consistent with the total sunk costs and with FYDP development cost estimates provided by MDA. SOURCE: MDA. 2010. “SBX Joint Cost Estimates Supporting MDA Cost Presentations to NAS,” February 28.
bThe development cost estimated during this 4-yr period is based on funds explicitly identified for the sea-based X-band radar development portion of the BMD Midcourse Defense Segment program’s annual MDA RDT&E budgets from FY 2007 through FY 2008 budgets and the FY 2009 sea-based X-band radar program. The SBX radar enhancement from FY 2006 through FY 2009 focused on the following: (1) developing algorithms for discrimination of more complex threat sets and targets; (2) designing material and electronic component enhancements to improve the radar’s output power; (3) updating and integrating the SBX software for improving the radar’s sensitivity; and (4) performing system integration and ground and flight testing activities.
vessel. The MDA O&S costs provided to the committee do not include the costs of MDA’s transition to the Navy planned for FY 2012 and beyond.62
MDA gave the committee an annual O&S cost breakdown for FY 2012 to FY 2017 consisting of overall SBX vessel and radar system estimates for unit personnel, operations, maintenance, sustaining support, and continuing system improvements.63 Because the estimates were not transparent with respect to the sustainment costs of the SBX vessel and the offshore support vessel and the SBX radar system itself, the committee summarized the specific annual O&S costs
_____________
62MDA provided the committee with the SBX program schedule as of February 2010. The schedule identified plans for transition of the Navy as the mission integrator and operator of the offshore SBX support vessel to the Marine Corps as the operator for the SBX vessel. It also identified transferring responsibility from MDA to the Navy as being responsible for funding the X-band radar CLS and system security activities.
63For its purposes, the committee accounted for MDA’s estimates for continuing system improvement of approximately $0.5 million (in then-year dollars) as part of the ongoing development cost estimates for FY 2010 through FY 2015.
TABLE E-45 SBX Vessel and Radar System Annual O&S Costs (FY 2010 million dollars)
| Fiscal Year | Vessel O&S Costsa | SBX Radar System O&S Costsb |
| 2010 | 106 | 44 |
| 2011 | 107 | 46 |
| 2012c | 108 | 47 |
| 2013 | 111 | 51 |
| 2014 | 109 | 51 |
| 2015 | 129 | 63 |
| Average | 112 | 50 |
aThe SBX vessel O&S costs include the costs of the SBX and crews for the offshore motor support vessel (the Dove), spare parts provisioning, and the lease of the Dove for continuing to support ongoing SBX shipboard operations, maintenance, and logistical support activities. These activities include galley and starboard crane upgrades, liquid condition and cooling system modifications, and so on. The activities also include participating in BMDS ground and flight tests. The O&S costs also include activities to support vessel maintenance certifications and the planned procurement of any parts due to the obsolescence of current onboard processors, controls, or displays. In addition, the costs also include onboard system force protection for the SBX and portside security for the SBX and the Dove.
bThe SBX radar O&S costs include costs for sustainment activities for operating and maintaining the X-band radar and associated equipment including the onboard IDT. The O&S costs have included the recent enhancements to the onboard operations control center and installation of the Emergency Radome Pressurization System. The costs include CLS to maintain the onboard primary mission equipment and support to the operation crews.
As part of the estimates for FY 2010 and FY 2011, the committee has included the annual cost of providing sustaining engineering and logistics support (i.e., repairs and spares) for the fielded suite of onboard SBX communications hardware and software for providing 24/7 SATCOM operations.
cSince the MDA RDT&E FY 2011 PB did not provide the funding projections for the vessel and SBX radar system for FY 2012 through FY 2015, the committee used the total annual O&S costs provided by MDA for those fiscal years and allocated the costs for each category based on the percentages computed for the FY 2011 funds cited in the budget justification sheets for the SBX sustainment program budgets. (The MDA O&S cost estimates on which the allocations were based were provided in MDA, 2010, “SBX Joint Cost Estimates Supporting MDA Cost Presentations to NAS,” February 28. The committee assumed the funds allocated and reported in the budget for FY 2011 closely approximate the projected split of sustainment costs going forward from FY 2012 through FY2015.)
in Table E-45. The FY 2010 and FY 2011 O&S costs listed are based on funds earmarked for these two sustainment activities, as listed in the MDA RDT&E FY 2011 PB and identified in the sea-based X-band radar sustainment program budget justification details.
System Life-Cycle Costs
From FY 2010 forward, the SBX radar system LCC range estimates for continuing X-band radar development and 20-yr O&S costs of sustaining this
TABLE E-46 SBX Ship-Based Radar System Total LCC Estimate (FY 2010 billion dollars)
| Minimum | Maximum | |
| Developmenta | 1.1 | 1.9 |
| Procurementb | Not applicable | Not applicable |
| Force quantity buy | 1 | 1 |
| MILCON | None required | None required |
| 20-yr O&Sc | 1.0 | 1.0 |
| Total 20-yr LCC estimate | 2.1 | 2.9 |
aThe SBX system development lower bound, or minimum, cost estimate of $1.1 million accounts for the efforts from FY 2010 through FY 2016 for MDA funds focused on (1) developing and providing system engineering and X-band radar advanced discrimination algorithms and software build releases for SBX system integration and testing and (2) demonstrating this SBX target tracking capability on planned flight interceptor tests by acquiring the targets of opportunity and sending tracking reports to the GMD fire control.
The upper bound, or maximum, development cost estimate of $1.9 billion adds $0.8 billion for continuing this SBX-specific radar development effort based on extending the average annual FY 2012 FYDP budget request of $160 million for at least 5 more years through FY 2020.
bProcurement cost is not separately identified from the development cost.
cThe total O&S cost for sustaining the ship-based SBX radar systems over a 20-yr service life is estimated at $1.0 billion based on applying an average sustainment cost estimate of $50 million over the 20-yr service life of this system. The SBX radar O&S estimate includes costs for operating and maintaining the X-band radar and associated equipment for the onboard IDT.
ship-based radar system are estimated at between $2.1 billion and $2.9 billion (Table E-46). The total estimate from FY 2010 forward includes the following:
• Requested funding of approximately $1.1 billion for FY 2012 FYDP PB from FY 2010 through FY 2016 for the SBX development and support program, and
• Sustainment funding for operating and maintaining the SBS radar system over a 20-yr service life.
INTERCEPTOR UNIT PRODUCTION COST DETAILS
Aegis SM-2
Even though the first 71 SM-3 Block 1A interceptors were produced using RDT&E funds, the average missile unit costs are based on reported annual procurement budgets and lot quantity buys beginning in FY 2009. By the end of FY 2010, 41 SM-3 Block IAs were expected to be in inventory. The cumulative average unit cost of the last two lots of the SM-3 Block IA missiles is estimated at $9.6 million in FY 2010 dollars.
SM-3 Block IA provides [greater] capability over [Block I] to engage short- to intermediate-range ballistic missiles. [The design] incorporates rocket motor upgrades and computer program modifications to improve sensor performance, and missile guidance and control…. It … includes producibility and maintainability features required to qualify the missile as a tactical fleet asset.64
Even though the first 34 SM-3 Block IB interceptors were produced using RDT&E funds, the average missile unit costs are based on reported annual procurement budgets and lot quantity buys beginning in FY 2011 and going forward through FY 2015. The projected cumulative average unit cost for the total quantity buy of 290 missiles over the 5-yr production is estimated at $9.3 million.
SM-3 Block IB incorporates a two-color, all-reflective IR seeker, enabling longer range acquisition and increased threat discrimination. The missile is configured with a throttleable DACS (TDACS) to provide a more flexible and lower cost alternative to the solid DACS.
Table E-47, a repeat of Table E-31, provides the detailed estimates by fiscal year for these two blocks of Aegis missile interceptors.
Figure E-8 plots cumulative average unit procurement cost as a function of production quantity for the SM-3 Block IA missiles along with the computed best-fit learning, or CIC slope for this missile block build extended forward for a total buy quantity of 134. The CIC slope is computed at 94.5 percent, with a first unit or T1 cost of $13.7 million in FY 2010 dollars.
TABLE E-47 SM-3 Average Unit Procurement Cost Summary (FY 2010 million dollars)
| Cumulative Average Unit Cost | Total Quantity | Fiscal Year | Annual Lot Quantities | Average Unit Cost per Lot | |
| SM-3 Block IA | 9.6 | 41 | FY 2009 | 23 | 9.3 |
| (last two lots) | FY 2010 | 18 | 10.0 | ||
| SM-3 Block IB | 9.3 | 290 | FY 2011 | 8 | 11.6 |
| FY 2012 | 66 | 10.3 | |||
| FY 2013 | 72 | 9.4 | |||
| FY 2014 | 72 | 8.8 | |||
| FY 2015 | 72 | 8.5 | |||
_____________
64See Raytheon news release: “Raytheon Missiles Engage Ballistic Missile and Airborne Targets Over the Pacific Ocean,” April 26, 2007.
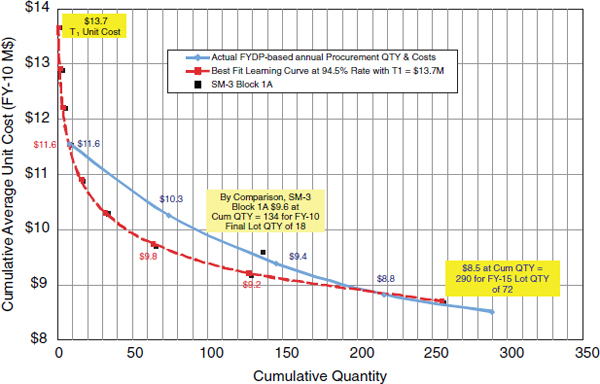
FIGURE E-8 Aegis SM-3 Block IA missile. Cumulative average unit cost learning curve.
Terminal High-Altitude Area Defense
Each THAAD battery consists of a basic load of 48 interceptors, 6 launchers, TFCC housed in 2 TSGs, and peculiar and common support equipment.
Even though the first 50 THAAD interceptors were produced using RDT&E funds, the average missile unit costs are based on reported annual procurement budgets and lot quantity buys beginning in FY 2010 and continuing at the rate of 72 per year from FY 2013 through FY 2015. The FY 2011 budget plans were based on having 26 THAAD (operational) interceptors in inventory by the end of FY 2010. Table E-48 provides detailed estimates by fiscal year for the THAAD missile interceptors.
Figure E-9 plots cumulative average unit procurement cost as a function of production quantity for the THAAD missile, along with the best-fit CIC slope for the missiles block build extended forward for a total buy quantity of 134. The CIC slope is computed at 94.5 percent with a first unit, or T1, cost of $13.7 million in FY 2010 dollars.
TABLE E-48 THAAD Missile Average Unit Procurement Cost Summary (FY 2010 million dollars)
| Cumulative Average Unit Cost | Total Quantity | Fiscal Year | Annual Lot Quantities | Average Unit Cost per Lot | |
| THAAD interceptor | 9.2 | 161 | FY 2010 | 26 | 10.5 |
| FY 2011 | 63 | 9.3 | |||
| FY 2012 | 72 | 8.6 | |||
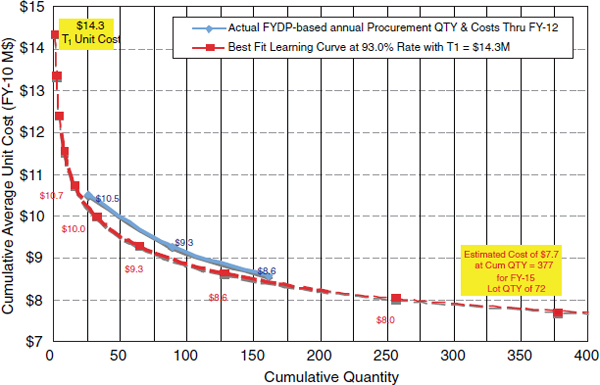
FIGURE E-9 THAAD missile. Cumulative average unit cost learning curve.


