
3
Aviation Safety and Pilot Commuting
The concern about the potential effects of pilot commuting on fatigue is rooted in concerns that increased pilot fatigue might increase the risk of an airline accident. As discussed in Chapter 4, there is extensive scientific evidence on the negative effects of fatigue on the performance of many cognitive tasks, including those essential for safely operating a commercial aircraft. This chapter provides the context in which to consider that evidence.
This chapter begins with a review of the airline safety record in the United States and then turns to the sources of improvement in aviation safety. Of particular importance for the focus of this report is a discussion of those features of the aviation system that can mitigate the risk of individual pilot fatigue for flight safety. In the third section the chapter examines investigations of the National Transportation Safety Board (NTSB) for accidents that occurred from 1982 to 2010 in order to determine how often fatigue is found to be a probable cause or contributing factor for an accident and the extent to which there is evidence that commuting might have contributed to that fatigue. Finally, the chapter examines what is known about the current patterns of pilot commuting.
Figure 3-1 confirms that airline travel is the safest form of passenger travel in the United States. Measured on the basis of fatalities per 100 million passenger miles, the fatality rate for both buses and trains was about 4 times higher than for airlines while the fatality rate for automobiles was about 75 times higher.
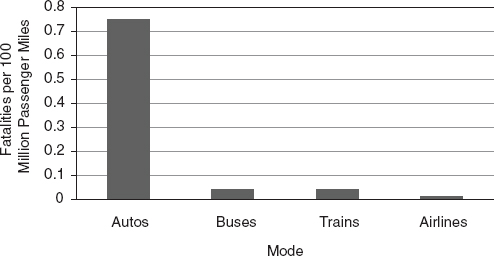
FIGURE 3-1 Safety of travel in the United States: 1989-2007.
SOURCE: Derived from data, used with permission, from Air Transport Association of America, Inc. (n.d.). See http://www.airlines.org/Economics/DataAnalysis/Pages/SafetyRecordofUSAirCarriers.aspx [August 2011]. 1927-1937: AA Statistical Handbook (December 1945). 1938-1971: CAB Handbook of Airline Statistics (1973), Part VIII, Items 19c, d, pp. 595-596; NTSB Safety Studies Division. 19721982: FAA Statistical Handbook (1972-1982), Table 9.3, p. 161, citing NTSB for totals; 1983-present: NTSB Aviation Accident Statistics, Table 6. Fatal Accident Rate excludes incidents resulting from illegal acts, consistent with NTSB practice.
Although measuring safety in terms of fatalities per passenger mile is a useful way of comparing safety across different modes of road travel, it is not the most useful way to measure airline safety.1 For automobile travel, for example, the risk of an accident varies across the types of roads used. Travel on interstate highways is much safer than travel on arterial highways, which in turn are much safer than travel on local roads (National Research Council, 2010, Figure 3-10). Travel on rural roads is more dangerous than travel on urban roads for all highway types. But in all of these categories of highway travel, the risk is roughly proportional to the distance traveled, so that the risk of a fatal accident on a 200-mile trip is about twice the risk on a 100-mile trip. Thus, for highway travel, measuring safety on a passenger-mile basis is a reasonable portrayal of the risk a traveler faces.
___________________
1Transportation safety is usually measured as the ratio of some adverse outcome, such as an accident or fatality, to a measure of exposure such as the number of trips taken or the distance traveled.
The safety of airline travel is different. With airline flights, the risk of accident is largely confined to the landing and takeoff phases of flight, including the climb, descent, and approach phases.2 Thus, for airline travel, the risk of an accident on a 1,000-mile flight is virtually the same as on a 500-mile flight since the only difference is the amount of time spent in cruise. When looking at airline travel, either across segments of the industry or over time, it is better to measure safety on a departure basis rather than on a mileage basis.
A common way to do this is to measure fatal accidents per million aircraft departures. One shortcoming of this measure, however, is that a fatal accident is defined as one in which at least one passenger was killed. In this measure, an accident in which one passenger of 200 passengers on board was killed is treated the same as one in which all 200 passengers were killed. So fatal accidents per 1 million departures, although better than a distance-based measure, is still not a good measure of the risk a passenger faces when taking an airline flight. However, this measure is often used when looking at worldwide safety trends because there is often limited information available about enplanements in some countries, some ambiguity about the number of passengers killed in an accident, or the definition of what constitutes a fatality may differ slightly. In the United States and throughout much of the rest of the world a fatality is considered to be from the accident if the passenger dies within 30 days of the accident from injuries suffered in the accident. To reflect the risk to a passenger from taking an airline flight, a commonly used measure is passenger fatalities per million enplanements.
Figure 3-2 shows the aviation safety record from 1959 through 2009 for U.S. and Canadian operators (combined) and for operators in the rest of the world. Canadian operators have generally had comparable safety to U.S. operators, and the two countries are often grouped together.3 Two things are apparent in the figure. First, the safety record both in the United States and Canada and in the rest of the world has improved considerably since the 1960s and 1970s. Second, the safety record in the United States and Canada has been markedly better than the combined record for the rest of the world. It is important to note, however, that the safety record in the rest of the world varies considerably both by region and by individual airline: consequently, although the combined safety record is worse than for the United States and Canada, there are individual airlines in the rest of the world that have amassed excellent safety records.
___________________
2For commercial jet service between 1999 and 2008, only 10 percent of fatal accidents occurred during the cruise phase of flight according to the Boeing Commercial Airplanes Statistical Summary of Commercial Jet Airplane Accidents (Boeing Commercial Airplanes, 2011).
3For more discussion of U.S. and Canadian aviation safety, see Oster et al. (1992, Ch. 4).
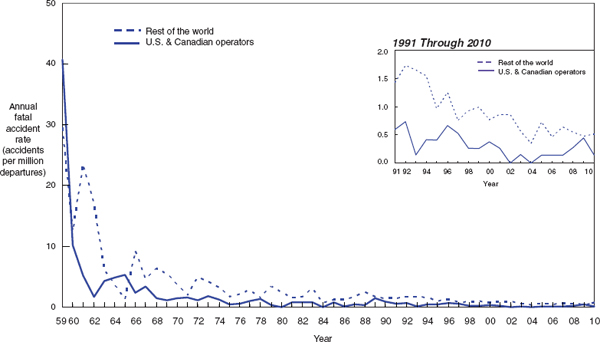
FIGURE 3-2 U.S. and Canadian operators accident rates by year.
SOURCE: Boeing Commercial Airplanes (2011, p. 18). Reprinted with permission.
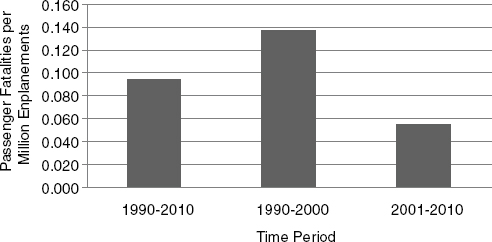
FIGURE 3-3 U.S. air carrier safety record: 1990-2010.
SOURCE: Data on passenger fatalities and enplanements calculated from information from the National Transportation Safety Board (n.d.) and the Bureau of Transportation Statistics (n.d.-a).
Figure 3-3 shows the U.S. Air Carrier Safety record over the 1990 to 2010 period. As can be seen in the figure, the safety record for the second half of this period is notably better than for the first half.4 However, looking at aviation safety records over time must be done with care. Airline accidents are rare events, but when an accident happens, large numbers of people can be killed, so the passenger fatality rates from year to year show considerable variation. Therefore, one needs to be cautious in drawing inferences about airline safety getting better or worse when looking at only a few years of data.
IMPROVEMENTS IN AVIATION SAFETY
Commercial aviation involves complex interactions and coordination among equipment, information, and people. As a result it is not surprising that the reasons aviation safety has improved over time involve a variety of factors. One source of improvement has been the improved performance and reliability of critical equipment such as aircraft, engines, and avionics. Equipment failures have decreased dramatically and system redundancy has typically enabled safe landings when these failures do occur. Similarly, more accurate air traffic control procedures have improved safety margins
___________________
4Fatalities from accidents involving illegal acts (sabotage, suicide, and terrorism) have been excluded from this analysis.
both in the air and on the ground. Airline pilot training has benefited from the widespread use of improved training programs and advanced flight simulators in which pilots can learn to manage both normal and non-normal events safely (Helmreich et al., 1999). Many of these and other improvements have resulted from the combined efforts of many people and organizations—including the National Transportation Safety Board, the Federal Aviation Administration, airframe and aircraft component manufacturers, airlines, pilots, and many others—to understand the causes of accidents and to take steps to reduce the risk of future accidents.
A particularly important component of aviation safety improvement for the purpose of the committee’s work has been the joint application of procedural, social, and technological systems to identify crew errors on the flight deck and to facilitate their correction or mitigation. Such errors can stem from a variety of human factors including fatigue. One approach known to reduce risks from errors is crew resource management (CRM) (see Helmreich and Foushee, 2010). CRM training is mandated by the Federal Aviation Administration (FAA) for the pilots of all Part 121 operators to facilitate effective crew communication, coordination, and the use of appropriate resources to prevent error. This systematic training is designed to enhance the ability of crews to perform as a team in order to reduce the potential for human error and improve safety on the flight deck. Such training emphasizes the importance of communication and consultation with each other regarding potential safety threats (including crew members’ own fatigue state), managing such threats, confirming actions being taken, and cross-checking information from both instruments and external sources. The intention is to improve situational awareness, problem solving, and decision making.
If an individual crew member is fatigued and thus more likely to make errors, CRM can help mitigate the effects of fatigue so that the errors are made less frequently or are caught quickly before they lead to an increased safety risk. Specifically, the practice of CRM requires a crew member to monitor other crew members, aircraft automation, and the overall flight situation and to identify any suspected errors with a verbal challenge that must be acknowledged. Such crew coordination practices have been shown in observational studies to be effective in identifying, trapping, and correcting pilot errors due to fatigue (Foushee et al., 1986; Thomas et al., 2006; Petrilli et al., 2007; Helmreich and Foushee, 2010; Thomas and Ferguson, 2010).
Checklists are another highly reliable error-trapping mechanism (Boorman, 2001; Pronovost et al., 2006) that can help pilots avoid missing key actions for successfully completing important safety-related tasks. Similarly, the use of callouts can help maintain attention both for the person making the callout and the person receiving it. The use of standard operat-
ing procedures and the annual training that reinforces their use provides highly structured, routinized processes that can facilitate reliable and repeatable cognitive performance. In addition, social interaction among the crew members can help maintain alertness on the flight deck and, through exchanging relevant information, can help reorient a pilot to focus on task performance. Taken together, these forms of crew interaction can help mitigate fatigue risk in individual pilots as well as fatigued crews. A potential downside is that they may mask a pilot’s awareness of his or her actual level of fatigue.
For very long flights of more than 8 hours, crew augmentation, adding one or two additional crew members, can help mitigate fatigue risk particularly when inflight rest facilities such as bunks are provided for crew members to sleep when they are not on duty. Even on shorter flights, research has shown that short, controlled naps are a well-established fatigue-mitigation strategy (Rosekind et al., 1994; Werfelman et al., 2009) that can enhance all cognitive and physiological processes.5 However, in considering naps, one has to take account of sleep inertia so that recovery time is provided before the crew member has to perform.
Flight deck technologies can also help mitigate the effects of fatigue. Onboard map displays have greatly enhanced crews’ cognitive situation awareness regarding airplane navigation (Wiener and Nagel, 1988). A range of systems such as stall and wind shear warnings, Traffic Collision Avoidance Systems, and Ground Proximity Warning Systems (now part of the Terrain Awareness and Warning System) have been shown to be highly effective in helping crews manage safety risks even when tired at the end of a long flight or series of flights (see, e.g., Kuchar and Drumm, 2007). More generally, when designed properly, automation can support and supplement the cognitive capacity crews need to operate safely, while enabling a pilot to transition back to taking over the aircraft manually when necessary. Air traffic control flight monitoring can also trap and help correct errors both by monitoring by human controllers and with automated systems such as Minimum Safe Altitude Warning Systems.
Each of these systems and processes can be effective in mitigating risks to safety from an individual’s fatigue but none is completely reliable and some introduce other cognitive loads. Taken together, however, they help mitigate potential safety risks of fatigue.
FATIGUE-RELATED AVIATION ACCIDENTS
A complication in understanding past accidents and in preventing future ones is that airline accidents rarely have a single cause. Rather, accidents are
___________________
5Napping is discussed further in Chapter 4.
usually the culmination of a sequence of events that involve multiple causes and contributing factors. It is often difficult to determine what happened that led to an accident and what the contributing factors were, particularly when the flight deck crew is killed in the accident and cannot provide input to the investigation. Although there is usually information about what they were saying from the cockpit voice recorder and information about what was happening to the aircraft from the flight data recorder, there can often be some doubt about whether all of the things that may have contributed to the accident were identified and understood.
Assessing the role that pilot fatigue may have played in an accident is a challenge because of other potential contributing factors. In some cases, the cockpit voice recorder may reveal that pilots talked about being fatigued during the flight or there may have been other signs of fatigue from the cockpit voice recorder. In other cases, the record may be clear that a pilot received very little sleep prior to the flight.
Beyond assessing the role of fatigue in an accident, assessing the role that pilot commuting may have played in pilot fatigue may be an even greater challenge. A pilot who lives close to the domicile and has a short commute may not necessarily arrive for duty well rested depending on the pilot’s activities prior to the commute. If the pilot did not sleep well the night before reporting for duty or if the pilot engaged in physically tiring activity prior to reporting for duty, then the pilot may be fatigued even if the commute was very short. Conversely, if the pilot commutes to the domicile by air from a distant point, that pilot will not necessarily report for duty fatigued. The pilot may fly to the domicile city the day before the duty cycle begins and get a good night’s sleep in a hotel before reporting for duty. It is important to realize that the length of the commute, measured either by distance or time spent commuting, does not necessarily determine whether or not the pilot reports for duty fit and well rested.
As discussed in Chapter 4, fatigue can be exacerbated by cumulative sleep debt, the situation when sleep obtained over multiple days is too short in duration to maintain alertness. If a commute prior to the start of duty contributes to cumulative sleep debt from inadequate sleep throughout a multiday trip, then it is conceivable that commuting may have contributed to fatigue that built during the multiday trip and subsequently contributed to an accident. In the analysis of NTSB accident reports discussed below, the committee was unable to assess whether this might have happened in any of the fatigue-related accidents.
Although there is strong evidence that fatigue can result in deteriorated pilot performance (discussed below), even in such cases, the fact that a pilot is likely to have been fatigued does not necessarily mean that the pilot’s fatigue resulted in errors made during the accident sequence or contributed to the cause of the accident. Well-rested pilots have been involved in airplane
crashes and fatigued pilots have completed flights without accidents. However, because the contribution of fatigue can be difficult to detect during an accident investigation, it is quite possible that fatigue may have contributed to accidents even when there is no clear evidence of pilot fatigue in the accident record.
Committee’s Method of Analysis
Recognizing these challenges, the committee examined NTSB reports of recent accidents6 to try to assess the roles that pilot fatigue and commuting may have played as risks to aviation safety. Between 1982 and 2010, there were 863 accidents in the Part 121 portion of the industry where the NTSB had determined the probable cause and contributing factors7 to the accident.
One approach would have been to look at the accident reports for all 863 accidents to determine how often pilot fatigue or commuting might have played a role in the accident. Unfortunately, the committee did not have the time or the resources to conduct such an analysis. Instead, the committee did an electronic search of the NTSB Aviation Accident and Incident Data System, which contains information collected during NTSB investigations of accidents and incidents involving civil aircraft within the United States, its territories and possessions, and in international waters. This system contains both the NTSB “probable cause reports,” which provide the NTSB findings as to the probable cause and contributing factors of the accident, and the NTSB “factual reports,” which provide descriptions of the sequence of events that culminated in the accident.8
One limitation of this analysis is that it provides no information about how often pilots were fatigued during their flights but were not involved in an accident. A second limitation of this approach is that accidents in which
___________________
6An aircraft accident is defined in Title 49 Section 830.2 as “an occurrence associated with the operation of an aircraft which takes place between the time any person boards the aircraft with the intention of flight and all such persons have disembarked, and in which any person suffers death or serious injury, or in which the aircraft receives substantial damage.”
7“The NTSB determines the probable cause or causes of accidents. The objective of this determination is to discern the cause-and-effect relationships in the accident sequence. This could be described as why the accident happened. In determining probable cause, the NTSB considers all facts, conditions, and circumstances associated with the accident. Within each accident occurrence, any information that helps explain why that event happened is designated as either a ‘cause’ or ‘factor.’The term ‘factor’ is used to describe situations or circumstances that contribute to the accident cause” (National Transportation Safety Board, 2010a, p. 52).
8The database was accessed through the FAA’s Aviation Safety Information Analysis and Sharing System (ASIAS) (see http://www.asias.faa.gov/portal/page/portal/asias_pages/asias_home/datainfo:databases:k-o) [June 2011] by using the NTSB Query Tool. The database can be accessed directly through the NTSB website, but the ASIAS website provides easier and quicker access to the same data.
fatigue may have played some role in the accident but in which the NTSB determined that the role was not sufficient for fatigue to be considered a probable cause or contributing factor will not be included. For example, considerable attention was paid to the first officer’s commute and possible fatigue following the 2009 Colgan Air crash in Buffalo, New York. However, this accident was the culmination of a series of events and errors by the flight crew and the NTSB did not find that fatigue was either a probable cause or a contributing factor in that accident, so that accident was not included in our analysis as a fatigue-related accident.
Both fatigue and commuting were discussed in the NTSB report on the Colgan accident. In the wake of that accident, the NTSB made 25 safety recommendations. One of those recommendations was related to fatigue and recommended that the FAA:
Require all 14 Code of Federal Regulations Part 121, 135, and 91K operators to address fatigue risks associated with commuting, including identifying pilots who commute, establishing policy and guidance to mitigate fatigue risks for commuting pilots, using scheduling practices to minimize opportunities for fatigue in commuting pilots, and developing or identifying rest facilities for commuting pilots. (National Transportation Safety Board, 2010b, pp. 112-113)
To carry out its analysis, the committee did an electronic search of the NTSB’s online accident database for Part 121 accidents between 1982 and 2010 where the probable cause or contributing factor contained any of the words “fatigue” or “tired” or “sleep” or “commute” or “commuting.” Each record found in the search was reviewed to see if the reference was to pilot fatigue. (Many of the references were to component failure due to metal fatigue.)
Table 3-1 shows the number of accidents in each injury category and how many of those accidents had references to pilot fatigue, including the statements on probable cause and contributing factors.9 Of the 863 Part 121 accidents that occurred during this period, nine of the accidents made some reference to pilot fatigue as a contributing factor.
Table 3-2 lists each of the nine accidents with fatigue as a probable cause or contributing factor. Each accident report was examined individu-
___________________
9The NTSB injury categories are defined as follows: Fatal—Any injury that results in death within 30 days of the accident; Serious—Any injury that (1) requires the individual to be hospitalized for more than 48 hours, commencing within 7 days from the date the injury was received; (2) results in a fracture of any bone (except simple fractures of fingers, toes, or nose); (3) causes severe hemorrhages, nerve, muscle, or tendon damage; (4) involves any internal organ; or (5) involves second- or third-degree burns, or any burns affecting more than 5 percent of the body surface; Minor—Any injury that is neither fatal nor serious; None—No injury (taken from CFR, Title 49, Transportation, Part 830).
___________________
TABLE 3-1 Total Accidents and Fatigue Accidents by Injury Category, 1982-2010
| Injury Category | Total Accidents | Fatigue Accidents |
| Part 121 Fatal | 95 | 2 |
| Part 121 Serious | 423 | 4 |
| Part 121 Minor | 78 | 0 |
| Part 121 None | 337 | 3 |
| Total | 863 | 9 |
SOURCE: National Transportation Safety Board Accident and Incident Data System, accessed through the Federal Aviation Administration’s Aviation Safety Information Analysis and Sharing System (ASIAS).
TABLE 3-2 Fatigue-Related Accidents, 1993-2009
| Event Date | Operator Name | Category of Operation | Flight Phase | Fatal/Nonfatal |
| Aug 18-93 | Connie Kalitta Services | Nonscheduled | Approach | Serious |
| May 8-99 | American Eagle | Scheduled | Landing-Roll | Serious |
| June 1-99 | American Airlines | Scheduled | Landing | Fatal |
| July 26-02 | Federal Express Corp | Nonscheduled | Approach | Serious |
| Oct 19-04 | Corporate Airlines | Scheduled | Approach | Fatal |
| Feb 18-07 | Shuttle America Corporation | Scheduled | Landing-Roll | None |
| Apr 12-07 | Pinnacle Airlines | Scheduled | Landing | None |
| Jan 27-09 | Empire Airlines | Nonscheduled | Landing | Serious |
| May 6-09 | World Airways | Nonscheduled | Landing-Flare | Serious |
SOURCE: National Transportation Safety Board Accident and Incident Data System, accessed through the Federal Aviation Administration’s Aviation Safety Information Analysis and Sharing System (ASIAS).
ally to determine if commuting by the pilots appears to have been a major contributor to that fatigue.
Connie Kalitta Services
The NTSB Aircraft Accident Report provides the following flight history factual information for an uncontrolled collision with terrain on August 18, 1993: “A Douglas DC-8-61 freighter … registered to American International Airways (AIA) Inc., [doing business as] Connie Kalitta Services, Inc., and operat[ed] as AIA flight 808, collided with level terrain ap-
proximately ¼ mile from the approach end of runway 10, after the captain lost control of the airplane while approaching the Leeward Point Airfield at the U.S. Naval Air Station (NAS), Guantanamo Bay, Cuba. The airplane was destroyed by impact forces and a post-accident fire, and the three flight crew members sustained serious injuries” (National Transportation Safety Board, 1994a, p. 1).
Prior to the accident, on August 16 at 2300 (start of the duty day), the captain and first officer originated their 4-day flight sequence in Atlanta, Georgia (ATL). Their duty day ended at 1200 August 17 at the Dallas/Fort Worth airport, where they were allowed an 11-hour rest period (relieved of flight duty and provided with a hotel room) (National Transportation Safety Board, 1994a). It does not appear to the committee that commuting prior to the start of the flight sequence contributed to the fatigue on the day of the accident.
The NTSB determined “that the probable causes of this accident were the impaired judgment, decision-making, and flying abilities of the captain and flight crew due to the effects of fatigue; the captain’s failure to properly assess the conditions for landing and maintaining vigilant situational awareness of the airplane while maneuvering onto final approach; his failure to prevent the loss of airspeed and avoid a stall while in the steep bank turn; and his failure to execute immediate action to recover from a stall.
Additional factors contributing to the cause were the inadequacy of the flight and duty time regulations applied to 14 CFR, Part 121, Supplemental Air Carrier, international operations, and the circumstances that resulted in the extended flight/duty hours and fatigue of the flight crew members. Also contributing were the inadequate crew resource management training and the inadequate training and guidance by American International Airways, Inc., to the flight crew for operations at special airports, such as Guantanamo Bay; and the Navy’s failure to provide a system that would assure that the local tower controller was aware of the inoperative strobe light so as to provide the flight crew with such information” (National Transportation Safety Board, 1994a, p. 78).
American Eagle
The FAA’s Aviation Safety Information Analysis and Sharing (ASIAS) Brief Report, based on information from the NTSB Aviation Accident/ Incident Database, provides the following flight history on a runway overrun and collision on May 8, 1999: “A Saab 340B … sustained substantial damage during landing at John F. Kennedy International Airport (JFK), Jamaica, New York. The airplane was owned by AMR Leasing Corporation, and operated by American Eagle Airlines Inc. as flight 4925. There were no injuries to 3 crew members [two pilots and the flight attendant] and 26
passengers, while 1 passenger sustained a serious injury [while exiting the airplane]” (National Transportation Safety Board, 1999, p. 4).
The report describes the flight crew’s sleep and duty time prior to the accident: “The flight crew was working a continuous duty overnight schedule. The previous day, they both awoke during the morning hours, did not sleep during the day, and reported for duty about 2200 for a flight scheduled at 2246. The flight was delayed, and arrived at Baltimore/Washington International Airport (BWI) about 0100. They were asleep about 0130, and awoke about 0445 for the accident flight, which was scheduled to depart at 0610” (National Transportation Safety Board, 1999, p. 10). The accident report does not contain any information on pilot’s commutes prior the start of the flight sequence, but it does not appear to the committee that commuting was the primary contributor to fatigue on the accident flight.
The NTSB determined that the probable cause of this accident was the “pilot-in-command’s failure to perform a missed approach as required by his company procedures. Factors [contributing to the accident] were the pilot-in-command’s improper in-flight decisions, the pilot-in-command’s failure to comply with FAA regulations and company procedures, inadequate crew coordination, and fatigue” (National Transportation Safety Board, 1999, p. 10).
American Airlines
The NTSB describes the flight history of a June 1, 1999, aircraft accident: “American Airlines flight 1420, a McDonnell Douglas DC-9-82 (MD-82), … crashed after it overran the end of runway 4R during landing at Little Rock National Airport in Little Rock, Arkansas. … The captain and 10 passengers were killed; the first officer, the flight attendants, and 105 passengers received serious or minor injuries” (National Transportation Safety Board, 2001, p. 1).
The report goes on to describe the flight crew’s commute and sleep patterns prior to the accident: “Flight 1420 was the third and final leg of the first day of a 3-day sequence for the flight crew. The flight sequence began at O’Hare International Airport, Chicago, Illinois [where the captain was domiciled]” (p. 1). “On May 30, 1999, the first officer traveled from his home outside Los Angeles, California, to Chicago. The first officer indicated that he had been commuting from his home to the Chicago-O’Hare base for about 3 months and that, as a result, he was adjusted to the central time zone. The first officer indicated that he was involved in routine activities while in the Chicago area” (p. 11). “The captain and the first officer reportedly received a normal amount of sleep the night before the accident; both went to sleep about 2200 and awoke about 0730. Also, there was no evidence that either pilot had experienced cumulative sleep loss in the days
before the accident” (pp. 143-144). Thus, it doesn’t appear to the committee that commuting was a contributing factor to the fatigue the pilots experienced on the accident flight.
The NTSB determined “that the probable causes of this accident were the flight crew’s failure to discontinue the approach when severe thunderstorms and their associated hazards to flight operations had moved into the airport area and the crew’s failure to ensure that the spoilers had extended after touchdown.
Contributing to the accident were the flight crew’s (1) impaired performance resulting from fatigue and the situational stress associated with the intent to land under the circumstances, (2) continuation of the approach to a landing when the company’s maximum crosswind component was exceeded, and (3) use of reverse thrust greater than 1.3 engine pressure ratio after landing” (National Transportation Safety Board, 2001, pp. 169-170).
Federal Express
The NTSB describes the flight history of a July 26, 2002, aircraft accident: “Federal Express (FedEx) flight 1478, a Boeing 727-232F (727), … struck trees on short final approach and crashed short of runway 9 at the Tallahassee Regional Airport (TLH), Tallahassee, Florida. … The captain, first officer, and flight engineer were seriously injured, and the airplane was destroyed by impact and resulting fire” (National Transportation Safety Board, 2004, p. 1). The captain lived in Memphis, Tennessee, and the first officer stayed in an apartment in Memphis on July 23 and 24 and a hotel in Winnipeg, Manitoba, Canada, on July 25. The flight engineer commuted from Albany, New York, to Memphis on July 24. He spent the night of July 25 in a hotel in Ottawa, Ontario, Canada, while on another flight sequence. It does not appear to the committee that commuting played a role in the fatigue that contributed to the accident.
The NTSB determined “that the probable cause of the accident was the captain’s and first officer’s failure to establish and maintain a proper glidepath during the night visual approach to landing. Contributing to the accident was a combination of the captain’s and first officer’s fatigue, the captain’s and first officer’s failure to adhere to company flight procedures, the captain’s and flight engineer’s failure to monitor the approach, and the first officer’s color vision deficiency” (National Transportation Safety Board, 2004, p. 68).
Corporate Airlines
The NTSB describes the flight history of an October 19, 2004, aircraft accident: “Corporate Airlines (doing business as American Connection)
flight 5966, a BAE Systems BAE-J3201, … struck trees on final approach and crashed short of runway 36 at Kirksville Regional Airport (IRK), Kirksville, Missouri. … The captain, first officer, and 11 of the 13 passengers were fatally injured, and 2 passengers received serious injuries” (National Transportation Safety Board, 2006, p. 1).
“The flight crew was on a regularly scheduled 4-day sequence that began on Sunday, October 17, 2004. The accident occurred on the last flight of the third day, which departed from STL [St. Louis, Missouri] about 1842” (National Transportation Safety Board, 2006, p. 1). Because the accident occurred on the third day of the trip sequence, it does not appear to the committee that the commutes the pilots experienced prior to the start of the trip sequence contributed to their fatigue on the accident flight.
The NTSB determined “that the probable cause of the accident was the pilots’ failure to follow established procedures and properly conduct a non-precision instrument approach at night in instrument meteorological conditions, including their descent below the minimum descent altitude (MDA) before required visual cues were available (which continued unmoderated until the airplane struck the trees) and their failure to adhere to the established division of duties between the flying and nonflying (monitoring) pilot.
Contributing to the accident were the pilots’ failure to make standard callouts and the current Federal Aviation Regulations that allow pilots to descend below the MDA into a region in which safe obstacle clearance is not assured based upon seeing only the airport approach lights. The pilots’ failure to establish and maintain a professional demeanor during the flight and their fatigue likely contributed to their degraded performance” (National Transportation Safety Board, 2006, p. 58).
Shuttle America
The NTSB describes the flight history of a February 18, 2007, runway overrun and subsequent collision: “Delta Connection flight 6448, an Embraer ERJ-170, … operated by Shuttle America, Inc., was landing on runway 28 at Cleveland Hopkins International Airport (CLE), Cleveland, Ohio, during snow conditions when it overran the end of the runway, contacted an instrument landing system (ILS) antenna, and struck an airport perimeter fence. The airplane’s nose gear collapsed during the overrun. Of the 2 flight crew members, 2 flight attendants, and 71 passengers on board, 3 passengers received minor injuries” (National Transportation Safety Board, 2008b, p. 1).
During the first two flights of the accident trip sequence, the captain flew with a different first officer than the accident first officer. The captain had been on vacation for 7 days prior to the accident and “was not originally scheduled
to work on the day of the accident (he was scheduled to continue his vacation through the following days), but he had called crew scheduling on the night of February 17, 2007, to request a trip. He was offered and then accepted a 2-day trip assignment” (p. 9).
The NTSB report goes on to describe the commuting and flight schedule of the captain: “On the day of the accident, the captain traveled as a nonrevenue passenger on a flight from Louisville International Airport-Standiford Field (SDF) Louisville, Kentucky, to ATL [Atlanta International Airport, Atlanta, Georgia] to report for a scheduled 2-day trip. The captain was scheduled to report to SDF at 0525, and the flight to ATL had a scheduled arrival time of 0733. The first flight leg, from ATL to Sarasota-Bradenton International Airport (SRQ), Sarasota, Florida, was delayed because of weather. The flight departed ATL at 0914 and arrived at SRQ at 1042. The second flight leg departed SQR at 1108 and arrived at ATL at 1242. The third flight leg, the accident flight, departed on time (with a different first officer) from ATL at 1305 and had an expected arrival time at CLE of 1451” (p. 1).
In the accident investigation, “the captain reported that he was unable to sleep later that night [February 17], stating that he received 45 minutes to 1 hour of sleep. He went to bed at 2000 but did not fall asleep until 0000 on February 18 and then awoke at 0100. He tossed in bed until about 0200, at which time he decided to get up and prepare for the 0525 report time in SDF [to travel to ATL]” (p. 9).
The report documents additional concerning facts regarding the captain: “At the time of the accident, the captain had been on duty for 9 hours 40 minutes with a total flight time of 5 hours 2 minutes. Also, the captain had been awake for all but about 1 hour of the previous 32 hours; he stated that his lack of sleep affected his ability to concentrate and process information to make decisions” (pp. 9-10). “The captain also reported that he had insomnia, which began 9 months to 1 year before the accident and lasted for several days at a time, and a 10-year chronic cough” (p. 10). “In addition, the captain reported that, for breakfast on the day of the accident, he ate graham crackers and drank orange juice while traveling as a nonrevenue passenger and then drank coffee and ate peanuts and chips later on. The captain stated that he was planning to eat lunch in ATL before the accident flight leg but was unable to do so because of the delays from the earlier flight legs and the change in first officers” (p. 10).
The captain’s prior attendance record fear of corrective action may have also contributed to accident: “On January 16, 2007 (about 1 month before the accident), the Shuttle America assistant chief pilot notified the captain, in writing, that his attendance had reached an unacceptable level—nine absence occurrences (seven sick and two unavailable attendance marks) totaling 18 days within the previous 12 months—and that future occurrences would result in corrective action, which could include termination
from the company. (According to the company’s policy, eight absence occurrences would result in termination.) The captain had not received previous notification from Shuttle America about his attendance. The captain stated that, even though he was tired on the day of the accident, he did not cancel his trip because he thought that could result in his termination” (p. 11).
For this accident, it appears to the committee that fatigue likely resulted from a combination of the captain’s inability to sleep the night before the accident flight, the commute from Louisville to Atlanta, and the flight delays that reduced the captain’s time between flights and extended his time awake. While the commute appears to have contributed to the fatigue, the committee notes that even without the time spent commuting, the pilot would have still had a period of more than 24 hours in which he only had about an hour’s sleep.
The NTSB determined “that the probable cause of this accident was the failure of the flight crew to execute a missed approach when visual cues for the runway were not distinct and identifiable. Contributing to the accident were (1) the crew’s decision to descend to the instrument landing system decision height instead of the localizer (glideslope out) minimum descent altitude; (2) the first officer’s long landing on a short contaminated runway and the crew’s failure to use reverse thrust and braking to their maximum effectiveness; (3) the captain’s fatigue, which affected his ability to effectively plan for and monitor the approach and landing; and (4) Shuttle America’s failure to administer an attendance policy that permitted flight crew members to call in as fatigued without fear of reprisals” (National Transportation Safety Board, 2008b, p. 67).
Pinnacle Airlines
The NTSB describes the flight history of an April 12, 2007, aircraft accident: “A Bombardier/Canadair Regional Jet (CRJ) CL600-2B19, … operated as Pinnacle Airlines flight 4712, ran off the departure end of runway 28 after landing at Cherry Capital Airport (TVC), Traverse City, Michigan. There were no injuries among the 49 passengers (including 3 lap-held infants) and 3 crew members, and the aircraft was substantially damaged” (National Transportation Safety Board, 2008a, p. 1).
The NTSB reports that the accident occurred on the flight crew’s first day of a 4-day scheduled trip; the accident flight was the fifth and final flight segment for the day. The captain’s home was near Pensacola, Florida, and he commuted to his base at Memphis International Airport (MEM, Memphis, Tennessee). The pilot commuted to Memphis on April 10 and conducted training on a flight to Minneapolis-St. Paul International (Wold-Chamberlain) Airport (MSP). The captain spent the night before the accident at a hotel in Minneapolis-St. Paul, arriving at the hotel at 2200. The
captain stated that he had slept soundly the night before the day of the accident flight. Thus, it does not appear to the committee that the commute was a major contributor to the captain’s fatigue during the accident flight.
The NTSB determined “that the probable cause of this accident was the pilots’ decision to land at Cherry Capital Airport (TVC), Traverse City, Michigan without performing a landing distance assessment, which was required by company policy because of runway contamination initially reported by TVC ground operations personnel and continuing reports of deteriorating weather and runway conditions during the approach. This poor decision making likely reflected the effects of fatigue produced by a long, demanding duty day and, for the captain, the duties associated with check airman functions. Contributing to the accident were (1) the Federal Aviation Administration pilot flight and duty-time regulations that permitted the pilots’ long, demanding duty day and (2) the TVC operations supervisor’s use of ambiguous and unspecific radio phraseology in providing runway braking information” (National Transportation Safety Board, 2008a, p. 55).
Empire Airlines
The NTSB describes the flight history of an January 27, 2009, aircraft accident: “An Avions de Transport Regional (ATR) Aerospatiale Alenia ATR 42-320 (ATR 42), … operating as Empire Airlines flight 8284, was on an instrument approach when it crashed short of the runway at Lubbock Preston Smith International Airport (LBB), Lubbock, Texas. The captain sustained serious injuries, and the first officer sustained minor injuries. The airplane was substantially damaged. The airplane was registered to FedEx Corporation (FedEx) and operated by Empire Airlines, Inc., as a 14 Code of Federal Regulations (CFR) Part 121 supplemental cargo flight. The flight departed from Fort Worth Alliance Airport (AFW), Fort Worth, Texas, about 0313” (National Transportation Safety Board, 2011, p. 1).
The captain commuted from his home in Portland, Oregon, to Midland International Airport (MAF), in Midland, Texas, on January 24, 2 days before the start of the trip sequence that culminated in the accident. The first officer commuted from her home in Salt Lake City, Utah, to MAF on January 18, 8 days before the start of the trip sequence that culminated in the accident. The first officer flew a trip sequence ending January 23, and she spent the weekend in Midland, Texas (off duty for over 72 hours prior to beginning the accident flight). Thus, it does not appear to the committee that either pilot’s commute from their home to their domicile contributed to their fatigue at the time of the accident.
The NTSB determined “that the probable cause of this accident was the flight crew’s failure to monitor and maintain a minimum safe airspeed
while executing an instrument approach in icing conditions, which resulted in an aerodynamic stall at low altitude. Contributing to the accident were (1) the flight crew’s failure to follow published standard operating procedures in response to a flap anomaly, (2) the captain’s decision to continue with the unstabilized approach, (3) the flight crew’s poor crew resource management, and (4) fatigue due to the time of day in which the accident occurred and a cumulative sleep debt, which likely impaired the captain’s performance” (National Transportation Safety Board, 2011, p. 83).
World Airways
The FAA’s ASIAS Brief Report, based on information from the NTSB Aviation Accident/Incident Database, provides the following flight history on a May 6, 2009, abnormal runway contact that resulted in significant damage to the aircraft: “A Boeing DC-10-30, operated by World Airways as flight 8535, experienced a hard landing on runway 10 at Baltimore/ Washington-Thurgood Marshall International Airport, Baltimore, [Maryland] (BWI). … The captain, flight engineer and 9 flight attendants reported minor injuries” (National Transportation Safety Board, 2009, p. 5).
The report indicates that the captain had been on a multiday trip sequence prior to the accident flight that included flights as captain and as a passenger. On May 3 (3 days prior to the accident), while piloting a flight from the Philippines, the captain reported feeling ill, probably from food poisoning. During the accident flight, the captain reported digestive system discomfort. The report does not contain any information on pilot’s commute prior the start of his flight sequence on April 27, but because the captain was at the end of a multiday trip sequence, it does not appear to the committee that commuting prior to the beginning of the trip sequence contributed to the pilot’s fatigue.
The NTSB determined that the probable cause of this accident was “the captain’s inappropriate control inputs following a firm landing, resulting in two hard nose-gear impacts before executing a go-around. Contributing to the inappropriate control inputs was the captain’s fatigue and physical discomfort; and a possible lack of practical consolidation of skills and experience due to a protracted and fragmented training period” (National Transportation Safety Board, 2009, p. 7).
Conclusion
Of the nine accidents examined by the committee during the 1982 through 2010 period and for which NTSB concluded that fatigue was either a probable cause or contributing factor, there was only one in which it appeared that commuting might have contributed to the fatigue on the
accident flight. In that accident, the February 18, 2007, Shuttle America runway overrun, it appeared to the committee that fatigue likely resulted from a combination of the captain’s inability to sleep the night before the accident flight, followed by the commute as a nonrevenue passenger from Louisville to Atlanta, in turn followed by the flight delays during the duty cycle that extended the captain’s time awake.
CURRENT PILOT COMMUTING PATTERNS
The committee was charged to “review the available information related to the prevalence and characteristics of commuting.” Unfortunately, the committee was not able to find any systematic or comprehensive data on the frequency of pilot commuting, the lengths of pilot commutes, or the characteristics of their commutes, such as the modes used of commuting by pilots.10 In the absence of such information, one approach would have been to conduct a survey to acquire systematic reliable data about the prevalence and characteristics of pilots and their commutes. However, developing, testing, implementing, and analyzing a pilot survey to acquire such data would have required time and resources that were not available to the committee.
In the absence of systematic data about actual pilot commutes and in order to gain some insight into likely commuting patterns, the committee requested information about the locations of pilot homes (residences) and domiciles from all Part 121 airlines, using a list of airlines provided by the FAA. Specifically, airlines were asked to provide the zip code of each pilot’s home of record (i.e., those designated by the pilots on IRS forms and for the receipt of official notices from the airlines) and the domicile from which that pilot begins his or her duty cycle. The committee received this information for 30,171 pilots. The committee then calculated the straight-line distance from the center of the home zip code to the center of the domicile zip code for each pilot. The straight line distances between zip codes are referred to as “home-to-domicile distances” for convenience, but these calculated home-to-domicile distances have several limitations and are only suggestive of pilot commuting patterns for several reasons. First, the pilots’ home zip codes were for their homes of record. Some pilots may have multiple homes, including seasonal residences, and may not always start their commutes from their homes of record. Second, some pilots may arrange for temporary accommodations at or near their domiciles (or at an intermediate location for a multistop commute) and sleep there the night
_______________
10The only published information appears to be data included in the NTSB report that followed the Colgan Air crash, which reported that 68 percent of the Colgan pilots based at Newark were commuting, with the commutes being various distances (National Transportation Safety Board, 2010, pp. 47-48).
prior to the start of their duty cycles. Third, commutes may be circuitous, particularly those involving multiple connecting flights, so that the actual distances traveled are likely to be longer and may be much longer than the calculated home-to-domicile distances. Fourth, these data are for a single point in time and provide no insight into how commuting patterns might change in response to a pilot’s career progression or changes in the patterns of airline operations resulting from mergers, bankruptcies, or changing economic or competitive conditions (see Chapter 2). Finally, the committee does not know the extent to which this sample of pilots is representative of the larger pilot population.
Notwithstanding these limitations and recognizing that the data were not provided by all airlines, the committee believes that the home-to-domicile distance patterns described below provide some insight into pilot commuting patterns found in each of four segments of the industry: Mainline airlines were defined as those that predominately operate scheduled passenger operations in jet aircraft with more than 90 seats (under Part 121 rules). Zip code data were provided by four airlines for 17,519 pilots in this segment. Regional airlines were defined as those that predominately operate scheduled service in aircraft, both jet and turboprop, with 90 or fewer seats (under Part 121 rules). Zip code data were provided by 11 airlines for 7,533 pilots in this segment. Cargo airlines defined as those that conduct scheduled or nonscheduled cargo operations (under Part 121 supplemental rules). Zip code data were provided by four airlines for 4,488 pilots in this segment. Charter airlines were defined as those that conduct nonscheduled passenger operations (under Part 121 supplemental rules). Zip code data were provided by five airlines for 631 pilots in this segment.
To preserve the confidentiality of the pilots, the individual airlines that provided the data were not identified. Not identifying the airlines prevented the committee from examining any relationships between the characteristics and policies of an individual airline and the patterns of home-to-domicile distances for that airline’s pilots and thus may limit the lessons that can be drawn from these data. However, the airlines were categorized by the four industry segments—mainline, regional, cargo, and charter.
Table 3-3 summarizes the home-to-domicile patterns by industry segment. When viewing Table 3-3 and the following figure and tables in this section, it’s important to keep in mind that a pilot making a short commute may or may not arrive rested and fit for duty depending on what that pilot’s activities were prior or during the commute. For example, if the pilot did not sleep well the night prior to reporting for duty or was involved in tiring physical activity earlier in the day, or even was awake since early morning before leaving home to commute to the domicile, the pilot might be fatigued even if the commute was very short. Similarly, a long commute does not necessarily mean that the pilot reported for duty fatigued. The pilot may
TABLE 3-3 Distribution of Home-to-Domicile Distances by Industry Segment (in percentage)
| Operation | Less Than 30 Miles | 31-90 Miles | 91-150 Miles | 750-1,500 Miles | 1,501-2,250 Miles | Greater Than 2,250 Miles |
| Mainline | 31 | 14 | 4 | 16 | 4 | 2 |
| Regional | 37 | 9 | 4 | 16 | 5 | 1 |
| Cargo | 37 | 4 | 1 | 17 | 7 | 2 |
| Charter | 29 | 9 | 4 | 27 | 2 | 1 |
SOURCE: Data from stakeholders’ input to committee.
have made the commute the day prior to reporting for duty and may have had a full night’s sleep in a hotel following the commute, prior to reporting for duty. The first column of Table 3-3 shows the percentage of pilots in each of the four industry segments whose home-to-domicile distance is less than 30 miles. This distance is admittedly arbitrary but is intended to represent a relative short commute similar to that experienced by much of the nonpilot workforce. The second column shows the percentage of pilots in each industry segment whose home-to-domicile distance is between 31 and 90 miles while the third column shows the percentage whose home-to-domicile distance is between 91 and 150 miles. These columns represent longer home-to-domicile distances but still ones where a commute is likely to be made by surface transport. By adding the numbers in the first three columns, one can see the percentage of pilots whose home-to-domicile distance is less than or equal to 150 miles. For mainline pilots, this sum is 49 percent; for regional pilots, this sum is 50 percent; for cargo pilots, this sum is 42 percent; and for charter pilots, this sum is also 42 percent.
The fourth, fifth, and sixth columns in Table 3-3 show the percentages of pilots whose home-to-domicile distances are, respectively, between 750 and 1,500 miles, 1,501 and 2,250 miles, and greater than 2,250 miles. These columns represent home-to-domicile distances where one might expect pilots to commute by air transport. To provide some perspective of these distances, the straight-line distance between Dallas and Indianapolis is about 768 miles, the straight-line distance between Salt Lake City and Detroit is 1,487 miles, and the straight-line distance between San Diego and Miami is 2,265 miles. Again, by adding these three columns, one can see that 22 percent of both mainline pilots and regional pilots have home-to-domicile distances of greater than 750 miles while 26 percent of cargo pilots and 30 percent of charter pilots have these longer home-to-domicile distances.
Looking more broadly at the data in Table 3-3, several things stand out. First, the distributions appear to be very similar for mainline and regional pilots even though these two segments of the industry differ in many respects. Second, the distributions for the cargo and charter segments of the industry are different from both each other and from the scheduled passenger segments. Given their differences in operating and basing policies (see Chapter 2), this is not surprising. Finally, looking at the right-most column, it appears that the proportion of pilots who have extremely long home-to-domicile commutes—coast to coast or international—is in about 1-2 percent across these four industry segments.
Figure 3-4 shows the distributions of home-to-domicile distances for mainline and regional pilots. The similarity of these distributions seen in Table 3-3 is even more apparent when the entire distributions are examined. So in spite of differences in average age, pay, average flight length, and industry structure, it appears that the home-to-domicile commuting patterns of mainline and regional pilots are very similar.
Table 3-4 shows the distribution of home-to-domicile distances for mainline pilots by airline. (The total sample line is the same as the line for the mainline airlines in Table 3-3.) The four mainline airlines that provided data included both large, well-established airlines and smaller, more recently established airlines. As can be seen in the table, the top two airlines, both large established carriers, have similar distributions, while the bottom
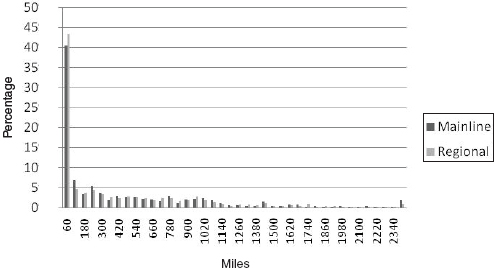
FIGURE 3-4 Distribution of home-to-domicile distances for mainline and regional pilots.
SOURCE: Data from stakeholders’ input to committee.
TABLE 3-4 Distribution of Home-to-Domicile Distances for Mainline Pilots by Airline (in percentage)
| Mainline Airlines | Less Than 30 Miles | 31-90 Miles | 91-150 Miles | 750-1,500 Miles | 1,501-2,250 Miles | Greater Than 2,250 Miles |
| A | 33 | 12 | 5 | 15 | 3 | 1 |
| J | 34 | 18 | 3 | 18 | 4 | 3 |
| N | 18 | 17 | 4 | 20 | 6 | 3 |
| W | 8 | 6 | 3 | 13 | 23 | 19 |
| Total Sample 17,519 Pilots | 31 | 14 | 4 | 16 | 4 | 2 |
NOTE: For all home-to domicile distance tables the de-identified airlines have coded alphabetically based on the order in which the input was received.
SOURCE: Data from stakeholders’ input to committee.
TABLE 3-5 Distribution of Home-to-Domicile Distances for Regional Pilots by Airline (in percentage)
| Regional Airlines | Less Than 30 Miles | 31-90 Miles | 91-150 Miles | 750-1,500 Miles | 1,501-2,250 Miles | Greater Than 2,250 Miles |
| C | 24 | 6 | 4 | 25 | 7 | 2 |
| D | 27 | 4 | 1 | 27 | 3 | 0 |
| E | 47 | 12 | 3 | 6 | 3 | 1 |
| F | 34 | 6 | 13 | 15 | 2 | 2 |
| H | 42 | 12 | 4 | 6 | 3 | 1 |
| K | 22 | 12 | 3 | 18 | 10 | 0 |
| O | 34 | 9 | 4 | 22 | 6 | 1 |
| R | 40 | 6 | 5 | 12 | 4 | 1 |
| T | 100 | 0 | 0 | 0 | 0 | 0 |
| U | 80 | 11 | 0 | 3 | 0 | 2 |
| X | 11 | 16 | 10 | 25 | 5 | 7 |
| Total Sample 7,533 Pilots | 37 | 9 | 4 | 16 | 5 | 1 |
SOURCE: Data from stakeholders’ input to committee.
two, both smaller, more recently established airlines, are different both from the two larger airlines and from each other.
Table 3-5 shows the distribution of home-to-domicile distances for regional pilots by airline. The 11 regional airlines that provided data included airlines of varying size and operating in different regions of the country. The data show that there is variation in home-to-domicile patterns across the airlines. One might infer that differences in various characteristics of the airlines are associated with different home-to-domicile patterns.
TABLE 3-6 Distribution of Home-to-Domicile Distances for Cargo Pilots by Airline (in percentage)
| Cargo Airlines | Less Than 30 Miles | 31-90 Miles | 91-150 Miles | 750-1,500 Miles | 1,501-2,250 Miles | Greater Than 2,250 Miles |
| B | 36 | 3 | 1 | 17 | 8 | 3 |
| M | 87 | 13 | 0 | 0 | 0 | 0 |
| P | 81 | 7 | 2 | 3 | 0 | 0 |
| S | 90 | 0 | 3 | 0 | 0 | 3 |
| Total Sample 4,488 Pilots | 37 | 4 | 1 | 17 | 7 | 2 |
SOURCE: Data from stakeholders’ input to committee.
TABLE 3-7 Distribution of Home-to-Domicile Distances for Charter Pilots by Airline (in percentage)
| Charter Airlines | Less Than 30 Miles | 31-90 Miles | 91-150 Miles | 750-1,500 Miles | 1,501-2,250 Miles | Greater Than 2,250 Miles |
| G | 59 | 24 | 6 | 6 | 0 | 0 |
| I | 4 | 0 | 4 | 46 | 3 | 2 |
| L | 20 | 8 | 10 | 32 | 0 | 0 |
| Q | 67 | 25 | 3 | 2 | 0 | 0 |
| V | 57 | 7 | 1 | 8 | 3 | 0 |
| Total Sample 631 Pilots | 29 | 9 | 4 | 27 | 2 | 1 |
SOURCE: Data from stakeholders’ input to committee.
Table 3-6 shows the distribution of home-to-domicile distances for cargo pilots by airline. The four cargo airlines that provided data included airlines of varying size and operating patterns. The data show that there is variation in home-to-domicile patterns across the airlines. One might infer that differences in various characteristics of the airline are to be associated with different home-to-domicile patterns.
Table 3-7 shows the distribution of home-to-domicile distances for charter pilots by airline. The five charter airlines that provided data included airlines of varying size and operating patterns. The data show that there is variation in home-to-domicile patterns across the airlines. One might infer from the table that differences in various characteristics of the airline are to be associated with different home-to-domicile patterns.
Although the data the committee received are neither a complete accounting nor a randomly drawn sample, the committee believes that they
provide useful information and some insight into the home-to-domicile patterns of pilots in the Part 121 portion of the industry.
The home-to-domicile patterns of the mainline and regional airlines appear, in aggregate, to be very similar even though these segments of the industry have markedly different operations and industry structure. In all four segments of the industry, however, a breakdown of the home-to-domicile distances by airline suggests that there is considerable variation across individual airlines. Policies directed at addressing concerns about the potential impact of commuting on pilot fatigue should recognize this heterogeneity in the industry.
Time Zone Considerations
The implications of crossing one or more time zones for potential fatigue during duty are complex as such crossings involve the time of day of flight, the direction of travel (whether traveling east to west where time is “gained” or west to east where it is “lost”) as well as the standard considerations related to characteristics of the commute. For example, the implications of crossing multiple time zones would be lessened if the pilot was able to plan and implement a commute that enabled him or her to obtain adequate sleep prior to duty (e.g., by arriving the night before). In addition, crossing time zones in and of itself, particularly a single time zone, is not an indicator of potential fatigue as the distance traveled can be quite short or very far. Recognizing these caveats, the committee analyzed the available zip code data to obtain additional descriptive information related to pilot residences and domiciles specific to time zones.
The majority of pilots (73.5 percent) reported a residence in the same time zone as their domicile. A significant additional percentage (18.8 percent) reported a residence one time zone away from their domicile, with much smaller percentages travelling two time zones (5 percent), three time zones (2.3 percent), or four or more time zones (.4 percent) time zones. A similar pattern emerges by type of carrier, particularly when comparing mainline and regional airlines: see Figure 3-5. However, proportionally fewer pilots who work for cargo and charter airlines report residences and domiciles in the same time zone and more report distances that cross one or two time zones.
When looking at time zones in combination with distance, the scenario is more complex. The distance between home and domicile for pilots in the same time zone ranged from less than a mile to 1,288 miles; for pilots who cross a single time zone, the distance ranged from 14 to 2,439 miles. In other words, there are long commutes that stay in a single time zone and short commutes that cross into a different time zone. Similarly, a relatively small percentage of pilots (11.1 percent) who travel across a time zone
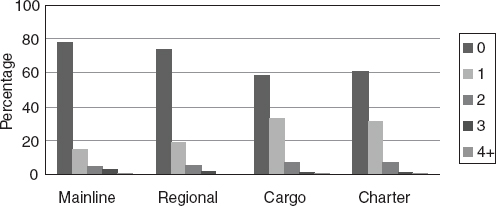
FIGURE 3-5 Share of pilots with home-to-domicile time zone differences.
SOURCE: Data from stakeholders’ input to committee.
travel a greater distance than the pilots who have a residence and domicile in the same time zone and some pilots who crossed three time zones reported a shorter distance between domicile and residence than pilots who crossed only one or two time zones. The greatest distances travelled obviously involve travel across multiple time zones. The shortest distance for pilots travelling across two, three, or four or more time zones, respectively, are 1,004, 1,656, and 2,890 miles. Table 3-8 shows detailed data for all pilots as well as by carrier type.
There is little conclusive that can be said about the number of time zones crossed given wide variation in distances travelled and lack of information about how the commute is actually conducted. It is possible that pilots who commute across multiple time zones are fatigued when they arrive for work. It is also possible that these pilots fly to their domicile the night before they are expected to report for duty and obtain adequate sleep prior to duty. Without information about actual commuting practices, these data serve merely a descriptive purpose and should not be used to make any conclusions about the likelihood of fatigue as a result of the corresponding commute.
Additional Considerations
The committee also reviewed data from NASA’s Aviation Safety Reporting System (ASRS). ASRS collects, processes, and analyzes voluntarily submitted aviation safety incident reports of unsafe occurrences and hazardous situations from pilots, air traffic controllers, dispatchers, flight
| MILES | No Time Zones | One Time Zone | ||||||||
| ALL | ML | Reg’l | Cargo | Chart. | ALL | ML | Reg’l | Cargo | Chart. | |
| 0-60 | 55.8 | 52.1 | 58.8 | 67.8 | 58.9 | 0.1 | 0.1 | 0.1 | ||
| 60-120 | 7.3 | 8.6 | 6.1 | 2.8 | 9.4 | 0.7 | 1.1 | 0.9 | ||
| 120-180 | 3.8 | 4.0 | 4.3 | 1.8 | 3.1 | 1.6 | 1.7 | 3.2 | 0.1 | |
| 180-240 | 5.8 | 6.5 | 4.9 | 4.3 | 4.2 | 2.1 | 2.1 | 4.4 | 0.1 | 0.5 |
| 240-300 | 3.4 | 3.6 | 3.1 | 2.1 | 4.5 | 4.3 | 5.9 | 5.3 | 0.5 | 3.0 |
| 300-360 | 2.2 | 1.8 | 2.6 | 3.2 | 3.4 | 4.4 | 2.8 | 4.1 | 8.3 | |
| 360-420 | 3.4 | 3.4 | 3.1 | 4.0 | 0.8 | 3.0 | 2.6 | 0.9 | 6.0 | 0.5 |
| 420-480 | 3.0 | 2.6 | 3.4 | 4.7 | 1.3 | 2.9 | 3.8 | 2.2 | 2.6 | |
| 480-540 | 2.6 | 2.6 | 2.8 | 2.2 | 3.1 | 4.0 | 4.4 | 3.2 | 4.0 | 3.0 |
| 540-600 | 2.1 | 2.1 | 2.0 | 1.8 | 4.7 | 5.4 | 3.5 | 5.2 | 8.4 | 8.1 |
| 600-660 | 1.8 | 1.8 | 1.4 | 2.1 | 2.9 | 5.7 | 4.3 | 4.2 | 9.4 | 7.6 |
| 660-720 | 0.9 | 0.7 | 0.8 | 1.8 | 1.0 | 8.5 | 8.2 | 10.0 | 7.5 | 8.6 |
| 720-780 | 1.1 | 1.3 | 0.8 | 0.3 | 0.3 | 10.4 | 12.6 | 10.0 | 7.2 | 6.1 |
| 780-840 | 0.6 | 0.6 | 0.9 | 0.3 | 0.5 | 5.4 | 4.5 | 5.7 | 6.9 | 5.1 |
| 840-900 | 0.9 | 1.1 | 0.8 | 0.2 | 0.3 | 8.5 | 7.5 | 6.8 | 12.4 | 4.0 |
| 900-960 | 1.8 | 2.1 | 2.0 | 0.1 | 5.3 | 4.2 | 7.0 | 4.1 | 16.7 | |
| 960-1,020 | 1.4 | 1.8 | 0.8 | 0.3 | 0.5 | 5.7 | 7.0 | 6.5 | 2.0 | 9.6 |
| 1,020-1,080 | 1.4 | 1.9 | 0.9 | a | 0.8 | 3.3 | 2.9 | 3.9 | 2.4 | 9.6 |
| 1,080-1,140 | 0.6 | 0.8 | 0.4 | 3.1 | 3.1 | 3.0 | 2.6 | 6.6 | ||
| 1,140-1,200 | 0.1 | 0.2 | a | 2.0 | 1.6 | 1.9 | 2.2 | 7.1 | ||
| 1,200-1,260 | 0.1 | 0.1 | a | 0.3 | 2.7 | 1.3 | 3.4 | 4.7 | 1.5 | |
| 1,260-1,320 | a | 2.0 | 1.8 | 2.2 | 2.2 | 1.0 | |||||
| 1,320-1,380 | 1.3 | 2.0 | 0.9 | 0.3 | 1.5 | ||||||
| 1,380-1,440 | 4.5 | 7.4 | 3.4 | 1.2 | |||||||
| 1,440-1,500 | 1.0 | 1.1 | 0.8 | 1.4 | |||||||
| 1,500-1,560 | 0.8 | 1.0 | 0.2 | 1.1 | |||||||
| 1,560-1,620 | 0.7 | 1.0 | 0.2 | 0.5 | |||||||
| 1,620-1,680 | 0.1 | 0.2 | 0.1 | 0.1 | |||||||
| 1,680-1,740 | 0.1 | 0.1 | |||||||||
| 1,740-1,800 | a | ||||||||||
| 1,800-1,860 | |||||||||||
| 1,860-1,920 | 0.1 | ||||||||||
| 1,920-1,980 | 0.1 | a | 0.3 | ||||||||
| 1,980-2,040 | 0.2 | 0.7 | |||||||||
| 2,040-2,100 | |||||||||||
| 2,100-2,160 | 0.1 | ||||||||||
| 2,160-2,220 | 0.1 | ||||||||||
| 2,220-2,280 | |||||||||||
| 2,280-2,340 | 0.1 | 0.2 | |||||||||
| 2,340-8,400b | 0.1 | 0.1 | 0.3 |
| MILES | No Time Zones | One Time Zone | ||||||||
| ALL | ML | Reg’l | Cargo | Chart. | ALL | ML | Reg’l | Cargo | Chart. | |
| 0-60 | ||||||||||
| 60-120 | ||||||||||
| 120-180 | ||||||||||
| 180-240 | ||||||||||
| 240-300 | ||||||||||
| 300-360 | ||||||||||
| 360-420 | ||||||||||
| 420-480 | ||||||||||
| 480-540 | ||||||||||
| 540-600 | ||||||||||
| 600-660 | ||||||||||
| 660-720 | ||||||||||
| 720-780 | ||||||||||
| 780-840 | ||||||||||
| 840-900 | ||||||||||
| 900-960 | ||||||||||
| 960-1,020 | 0.2 | 0.3 | 2.3 | |||||||
| 1,020-1,080 | 0.5 | 16.3 | ||||||||
| 1,080-1,140 | 1.2 | 1.1 | 2.2 | 2.3 | ||||||
| 1,140-1,200 | 3.1 | 4.6 | 2.2 | 0.7 | ||||||
| 1,200-1,260 | 4.7 | 6.7 | 3.0 | 0.3 | 16.3 | |||||
| 1,260-1,320 | 3.8 | 4.1 | 5.5 | 11.6 | ||||||
| 1,320-1,380 | 4.6 | 4.6 | 7.2 | 0.3 | 9.3 | |||||
| 1,380-1,440 | 7.2 | 7.5 | 8.5 | 4.3 | 11.6 | |||||
| 1,440-1,500 | 4.4 | 5.5 | 5.0 | 0.3 | 9.3 | |||||
| 1,500-1,560 | 6.4 | 5.1 | 6.5 | 8.3 | 14.0 | |||||
| 1,560-1,620 | 12.4 | 13.1 | 11.7 | 12.3 | 7.0 | |||||
| 1,620-1,680 | 13.6 | 15.1 | 7.7 | 19.6 | 0.4 | 0.4 | 0.7 | |||
| 1,680-1,740 | 6.2 | 1.2 | 16.7 | 6.0 | 1.0 | 1.2 | 0.7 | |||
| 1,740-1,800 | 5.6 | 4.9 | 5.2 | 8.6 | 2.7 | 3.9 | ||||
| 1,800-1,860 | 6.9 | 5.8 | 6.7 | 11.0 | ||||||
| 1,860-1,920 | 6.6 | 2.1 | 4.5 | 21.6 | 6.7 | 5.9 | 12.2 | |||
| 1,920-1,980 | 2.1 | 3.5 | 0.7 | 0.7 | 8.6 | 9.8 | 7.5 | 16.7 | ||
| 1,980-2,040 | 1.5 | 2.1 | 1.7 | 5.3 | 5.3 | 6.8 | 16.7 | |||
| 2,040-2,100 | 0.7 | 0.4 | 2.0 | 6.0 | 6.3 | 7.5 | ||||
| 2,100-2,160 | 4.3 | 6.7 | 3.0 | 0.7 | 3.4 | 3.1 | 6.1 | |||
| 2,160-2,220 | 0.5 | 0.9 | 5.1 | 5.1 | 7.5 | |||||
| 2,220-2,280 | 0.3 | 0.5 | 0.3 | 4.9 | 4.3 | 8.8 | ||||
| 2,280-2,340 | 0.3 | 0.7 | 3.9 | 3.5 | 6.8 | |||||
| 2,340-8,400b | 2.8 | 3.5 | 5.0 | 52.0 | 51.3 | 35.4 | 100.0 | 66.7 | ||
aLess than .05 percent.
bThe distance between domicile and residence for all pilots who travelled across four time zones were all in this range.
attendants, maintenance technicians, and others.11 There was limited information available in the reports to determine the degree to which commuting was a factor in the reported incidents. Also, since these reports are voluntarily submitted, in some cases to gain immunity from punishment, it is not clear the extent to which these reports are representative of the experiences of the entire Part 121 pilot population. The committee did not find that these data were useful in the context of the committee’s charge, and these data are not discussed in the report.
CONCLUSION: There is potential for pilots to become fatigued from commuting. However, there is insufficient evidence to determine the extent to which pilot commuting has been a safety risk in part because little is known about specific pilot commuting practices and in part because the safety checks, balances, and redundancies in the aviation system may mitigate the consequences of pilot fatigue.
___________________
11For details, see http://asrs.arc.nasa.gov/overview/summary.html [May 2011].


