
Representation of Underrepresented Minorities
NIH TRAINING GRANTS1
Associating training grants with the universities to which a program belongs, the panel investigated two questions about the relationship of training grant awards to underrepresented minority (URM) students and to international students.
Do institutions with heavy dependence on training grants recruit more students who are from underrepresented minority groups (URMs) than schools with less dependence?
To explore this question, the number and percentage of URM students were plotted against the number of training grants for each institution. Data showing the numbers of URM’s as well as the percentage by institution are given in Figures 5-1a and 5-1b. Numbers were used in Figure 5-1a to test the hypothesis that the more training grants an institution has, the more URMs it will recruit. Figure 5-1b, using the percentage of URMs, shows that, even in institutions with a large number of training grants, the representation of URMs is about average, and is similar to institutions with fewer grants.
It is true that the programs with more URM students also are the larger departments and the ones with higher research productivity. Hence, while a higher number of NIH training grants go to programs with a larger number of minority Ph.D. students, it is not necessarily true that the proportion of support going to minorities is greater because of the training grants. Program specific data would be important for an analysis that addresses this more challenging question.
______________
1 A note on the data: Using NIH data, we were unable to associate training grant funding with particular programs. We were, however, able to tie them to particular institutions, and this is the approach we take in the analysis that follows. MARC training grants were not included.
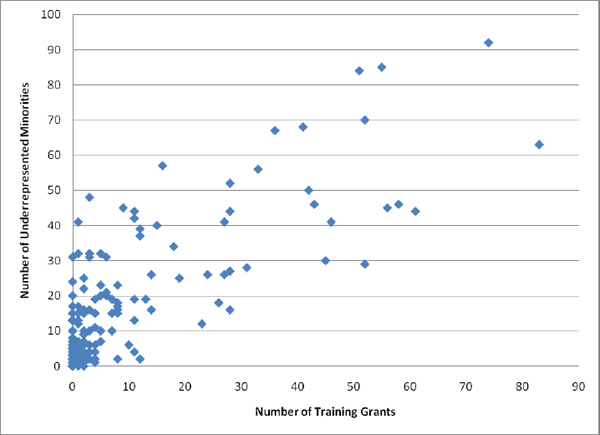
FIGURE 5-1a Comparison of the Number of Training Grant Awards and the Number of Underrepresented Minorities by Institution. The correlation between training grants and number of URM students is 0.748.
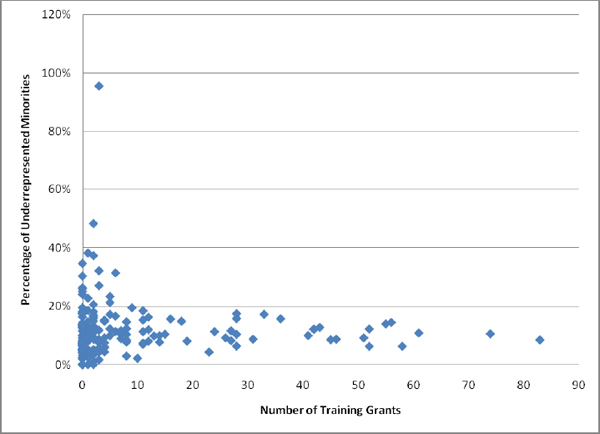
FIGURE 5-1b Comparison of the Number of Training Grant Awards and the Percentage of Underrepresented Minorities by Institution. The correlation between training grants and the percentage of URM students is 0.000.
The above notwithstanding, there are some institutions that stand out as having a high percentage of URM students, regardless of the number of training grants (see Table 5-1).
TABLE 5-1 Institutions with programs having 20 percent or more URM students and the number of their training grant awards
| Institution Name | Average Percent of URM Students |
Average of Number of Training Grant Awards |
| Howard University | 95% | 3 |
| New Mexico State University Main Campus | 48% | 2 |
| City University of New York Grad. Center | 38% | 1 |
| University of North Texas Health Science Center | 37% | 2 |
| Loma Linda University | 35% | 0 |
| University of Georgia | 32% | 3 |
| University of New Mexico Main Campus | 31% | 6 |
| University of Southern Mississippi | 30% | 0 |
| University of Miami | 27% | 3 |
| Auburn University | 26% | 0 |
| Florida International University | 26% | 0 |
| University of North Carolina at Greensboro | 25% | 0 |
| University of South Carolina Columbia | 24% | 0 |
| University of Louisville | 23% | 5 |
| Oklahoma State University Main Campus | 23% | 1 |
| University of California-Santa Cruz | 21% | 5 |
| University of Maryland Baltimore County | 21% | 2 |
More analysis is needed to identify the characteristics of these institutions that make them particularly successful in recruiting URM doctoral students.
Do institutions with heavy dependence on training grants enroll fewer international students?
Here we looked at the percentage of international students in a program related to the number of training grants the institution holds. As shown in Figure 5-2, institutions with greater than 15 training grant awards had an average of about 25 percent international students in their biomedical sciences programs, compared to about 35 percent at institutions with smaller numbers of grants. Since international students cannot be supported on NIH training grants, this difference is not surprising.
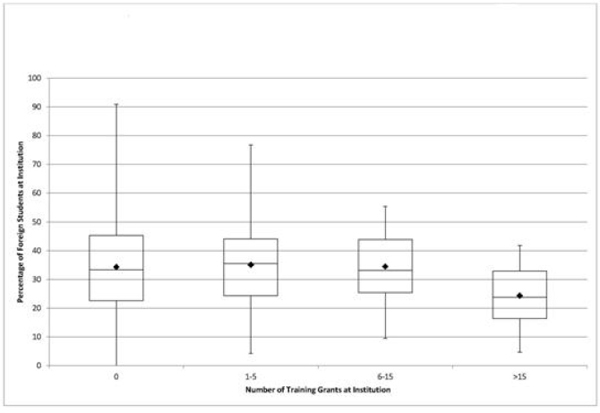
FIGURE 5-2 Percent of International Students at an Institution Grouped by Number of Training Grants (All Institutions) The correlation between training grants and the percentage of international students is -0.240
A STATISTICAL APPROACH
Another approach to issues relating to underrepresented minorities is to develop a model of enrollment by URM’s that relates enrollment to other program characteristics, in order to better understand how to expand their enrollment and graduation from Ph.D. programs. Toward that end, the biomedical sciences data of the Assessment can identify factors associated with higher URM enrollment among the participating programs. The panel addressed three questions in turn:
- How many URM graduates are expected per year across all programs?
- What factors predict higher URM enrollment in a PhD program?
- Having controlled for these factors, to what extent does URM enrollment cluster within universities, and which universities exceed URM enrollment expectations?
URM Ph.D. Students and Graduates
There are close to 40,900 Ph.D. students in the 982 biomedical sciences programs in the Assessment. Of these, approximately 4,700 (11.5 percent) are from underrepresented minority groups (URMs). Figure 5-3 shows the distribution of the percentage of URM Ph.D. students across the programs (0 = no URM students; 100% = all are URMs). The median percent of URMS is 10 percent; the middle half of programs have between 4 and 16 percent of URM Ph.D. enrollments, which corresponds to 1 to 7 URM students.
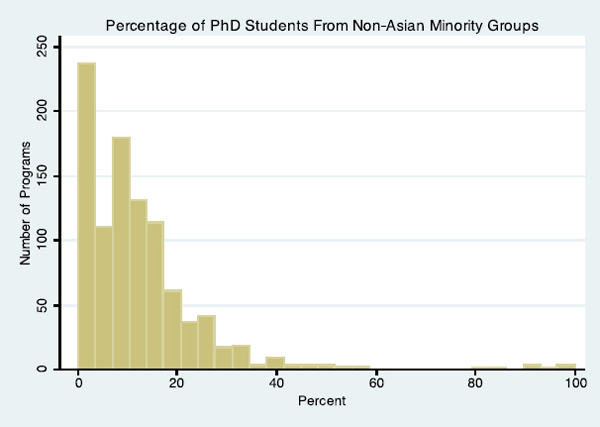
FIGURE 5-3 Histogram Describing the Percentage of URM Ph.D. Students for 981 Bioscience Programs2
Figure 5-4 shows the distribution of the expected number of URM graduates per year. This measure for a program is estimated by multiplying the share of enrolled URM students by the average number of graduates over the previous 3 years. Seventeen percent of programs are expected to graduate more than one URM student per year; three percent of programs are
______________
2 One of the 982 programs did not have data for URMs.
expected to graduate two or more. Of the approximately 4,700 new Ph.D.’s per year over the 982 departments, roughly 550 were URM graduates.
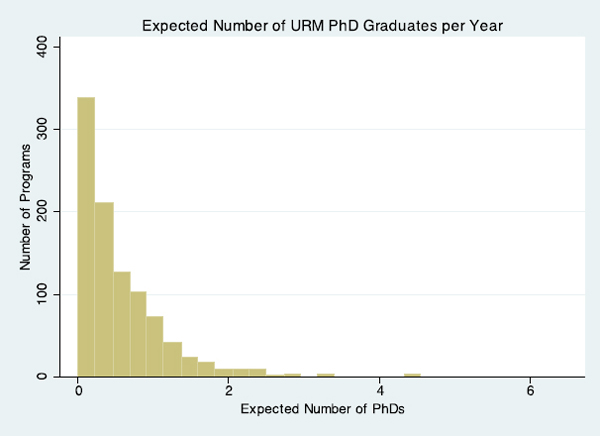
FIGURE 5-4 Histogram Describing the Expected Number of URM PhD Graduates per Year for 982 Bioscience Programs
Factors that Predict URM Enrollments
To identify key factors that predict the number of URM graduate students in a program, the panel used Poisson log-linear regression to predict the expected rate of enrolled URM students (number URM per total enrolled students) as a function of the following factors:
- number of URM faculty;
- research productivity as measured by the 5th percentile of the NRC “research productivity” ranking3; and
- biomedical science field.
______________
3 Other variables (e.g., completion rate or percent of first year students with full financial support) could be used in this analysis.
The model also includes a random effect for each university to account for the correlation among URM enrollments among programs from the same university (see below). The regression coefficients are estimates of log relative rates of URM enrollment per unit change of the predictor, other variables held fixed. For example, the exponential of the coefficient for the URM faculty fraction is the factor that multiplies the expected URM student enrollments if the fraction of URM faculty increases from 0 to 100 percent. A factor of 1.0 = exp(0) means that the percentage of URM faculty has no effect on the fraction of URM PhD students; a factor of 3 means that an increase in URM faculty members from 10 to 20% is associated with an increase in the fraction of URM enrolled students from 10 to 40%. Table 5-2 shows a subset of the results of this log-linear regression.
TABLE 5-2 Predictor, Estimated Relative Rate (RR) and t-Statistic for Null
| Predictor | Relative Rate | t-statistic |
| Biochemistry, Biophysics, and Structural Biology+ | 1 | ------- |
| Biomedical Engineering and Bioengineering | 1.17 | 2.26 |
| Cell and Developmental Biology | 1.16 | 2.44 |
| Genetics and Genomics | 1.09 | 1.09 |
| Immunology and Infectious Diseases | 1.32 | 3.56 |
| Integrated Biological and Biomedical Sciences | 0.97 | -0.42 |
| Microbiology | 1.35 | 4.15 |
| Neuroscience and Neurobiology | 1.25 | 3.45 |
| Nutrition | 1.35 | 2.91 |
| Pharmacology, Toxicology, and Environmental Health | 1.48 | 6.08 |
| Physiology | 1.28 | 2.71 |
| URM Faculty Fraction | 2.96 | 3.160 |
| Research Productivity | 1.0015 | 1.73 |
NOTE: RR=1 from log-linear regression of the number of URM PhD students on the indicators of field; biochemistry, biophysics, and structural biology is the reference program with RR assigned to be 1.0, fraction of URM (0-1), and for the 5th percentile of the research productivity (0-100).
The relative rate estimates for biochemistry, biophysics, and structural biology and for integrated biological and biomedical sciences are the smallest, indicating that among the observed data, they are the least well-subscribed biomedical science departments by URM students, all else being equal. Pharmacology, toxicology, and environmental health, microbiology, immunology and infectious disease, and nutrition have the largest estimates, which range from 35 to 48 percent higher rates of enrollment than in biochemistry, biophysics, and structural biology.
Research productivity of the program faculty is not a strong predictor of URM Ph.D. student enrollment, once the number of PhD students is taken into account. However, as would be expected, the fraction of URM faculty is a very strong predictor. For a 10 percentage point increase, say from 5 to 15 percent of URM faculty, the fraction of URM Ph.D. enrollments is expected to increase by 26.1 percentage points, nearly a 3-to-1 ratio. This is by far the most important predictor among those considered.
Clustering of URM Students
Many universities have a large number of Ph.D. programs (ranging from 1 to 18) in the Assessment. Therefore, it is possible to ask whether there are unmeasured characteristics of each university that attract URM Ph.D. students beyond the predictors considered above. Because such factors are common to all programs from a university, their influence can be detected as correlation or “clustering” among the rates of URM enrollments for programs from the same university.
A simple extension of the log-linear model above can be used to estimate the degree of clustering by adding a random “university effect” that is common to all the programs within that institution. We have added a random intercept to the Poisson regression described above. With this model, we have estimated the multiplicative factor that indicates how each university’s URM enrollment is increased or decreased across all of its programs using empirical Bayes estimation as implemented in the software package Stata (Rabe-Heckesh, Skronda, and Picles (2002).4Table 5-3 lists the estimated relative rates for the 10 universities with the highest values.
______________
4 Rabe-Heckesh, S., A. Skronda, and A. Picles. 2002. Reliable estimation of generalized mixed models using adaptive quadrature. The Stata Journal, Vol. 2, (1), 1-21.
TABLE 5-3 Listing of the Universities with Highest “University Relative Rates”
|
|
|
| Institution | Relative Rate |
|
|
|
| Howard University | 3.98 |
| City University of New York | 3.52 |
| New Mexico State University | 3.44 |
| University of New Mexico Main | 3.29 |
| University of North Texas HSC | 3.25 |
| Loma Linda University | 2.36 |
| University of Texas HSC | 2.36 |
| University of Maryland Baltimore | 2.12 |
| University of Georgia | 2.10 |
| University of Miami | 2.09 |
|
|
|
NOTE: These rates indicate the attractiveness of the university’s programs beyond what is predicted by the field, percent of URM faculty, and research productivity.
The degree of clustering of URM graduate students is substantial, even after controlling for the clustered URM faculty. The standard deviation of the university effect is estimated to be 0.50 (95 percent confidence interval 0.43 to 0.59). A standard deviation of 0.5 for a Gaussian distribution means that roughly 1 of 3 universities would have relative rates below 0.6 or above 1.6, a demonstration of important variation among institutions in their ability to attract URM PhD students, even after controlling for variation among them in their fractions of URM faculty, research productivity, and field.


