
There is growing recognition that individuals need a wide array of skills in order to meet the needs of the modern workplace. Gone are the days when a multitude of jobs were available that required workers to perform simple manual tasks. The introduction of technology, particularly the use of computers, has changed the way that workers perform their tasks and the types of training and skills that workers need in order to complete these tasks. Research has shown that the use of computers has eliminated the need for humans to perform tasks that involve solving routine problems or communicating straightforward information (Autor, Levy, and Murnane, 2003; Levy and Murnane, 2004). Nonroutine problem-solving and complex communication and social skills are becoming increasingly valuable in the labor market. The modern workplace requires workers to have broad cognitive and affective skills. Often referred to as “21st century skills,” these skills include being able to solve complex problems, to think critically about tasks, to effectively communicate with people from a variety of different cultures and using a variety of different techniques, to work in collaboration with others, to adapt to rapidly changing environments and conditions for performing tasks, to effectively manage one’s work, and to acquire new skills and information on one’s own.
The National Research Council (NRC) has convened two prior workshops on the topic of 21st century skills. The first, held in 2007, was designed to examine research on the skills required for the 21st century workplace and the extent to which they are meaningfully different from
earlier eras and require corresponding changes in educational experiences. One theme from that workshop was that across the entire labor market—from high-wage biotechnology scientists and computer sales engineers to low-wage restaurant servers and elder caregivers—five skills appear to be increasingly valuable: adaptability, complex communication skills, nonroutine problem-solving skills, self-management/self-development; and systems thinking (National Research Council, 2008).
The second workshop, held in 2009, was designed to explore demand for these types of skills, consider intersections between science education reform goals and 21st century skills, examine models of high-quality science instruction that may develop the skills, and consider science teacher readiness for 21st century skills. A message that emerged from this workshop was that although some new assessments incorporate items that appear promising as potential measures of students’ 21st century skills, additional research may be needed in order to more clearly define the constructs and to develop frameworks for assessment of these skills (National Research Council, 2010).
The present workshop was intended to delve more deeply into the topic of assessment. The goal for this workshop was to capitalize on the prior efforts and explore strategies for assessing the five skills identified earlier. The Committee on the Assessment of 21st Century Skills was asked to organize a workshop that reviewed the assessments and related research for each of the five skills identified at the previous workshops, with special attention to recent developments in technology-enabled assessment of critical thinking and problem-solving skills.
In designing the workshop, the committee collapsed the five skills into three broad clusters as shown below:
Cognitive skills: nonroutine problem solving, critical thinking, systems thinking
Interpersonal skills: complex communication, social skills, teamwork, cultural sensitivity, dealing with diversity
Intrapersonal skills: self-management, time management, self-development, self-regulation, adaptability, executive functioning
The committee commissioned a set of papers to examine the research on assessing skills within each of these broad clusters and identified examples of assessments of the skills to feature at the workshop. The workshop was held in two parts. The first, convened in Irvine, California, in January 2011, was more technical in focus. The second, held in Washington, DC, in May 2011, was more policy focused. This report provides an integrated summary of the presentations and discussions from both parts of the workshop.
The remainder of this chapter is intended to provide context for the report, describing the changes in both the labor force and the workplace over the past few decades and discussing the skills that workers need to adequately perform in the currently available jobs. Chapter 2 discusses the skills included within the cognitive cluster. The chapter first explores issues related to defining these constructs, then presents four examples of assessments of these constructs, and concludes with a discussion of the strengths and weaknesses of these assessments. Chapters 3 and 4 follow the same format for skills within the interpersonal and intrapersonal clusters, respectively. Chapter 5 summarizes two workshop presentations that focused on key measurement issues to consider when developing assessments of 21st century skills. Chapter 6 concludes with workshop participants’ synthesis of important points raised over the course of the two workshops and a discussion of the policy implications.
It is important to be specific about the nature of this report, which is intended to document the information presented in the workshop presentations and discussions and lay out the key ideas that emerged from the workshop. As such, the report is confined to the material presented by the workshop speakers and participants. Neither the workshop nor this summary is intended as a comprehensive review of what is known about assessing 21st century skills, although it is a general reflection of the literature. The presentations and discussions were limited by the time available for the workshop.
This summary was prepared by an independent rapporteur, and it does not represent findings or recommendations that can be attributed to the steering committee. The steering committee was responsible only for the quality of the agenda and the selection of participants. The workshop was not designed to generate consensus conclusions or recommendations but focused instead on the identification of ideas, themes, and considerations that contribute to an understanding of assessing 21st century skills.
THE CHANGING NATURE OF THE WORKPLACE
Richard Murnane, an economist with the Harvard School of Education, opened the workshop with a presentation about the changes that are occurring in the workplace and the types of skills workers will need to perform these tasks. He began by presenting two graphs—one for men and one for women—that displayed average hourly wages from 1979 through 2007 for individuals grouped by their education level.1 These graphs, reproduced as Figures 1-1 and 1-2, show wage informa-
________________
1Murnane’s presentation is available at http://www7.nationalacademies.org/bota/21st_Century_Workshop_Murnane.pdf [August 2011].
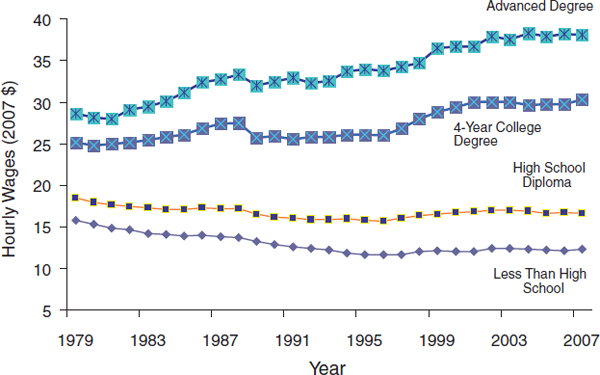
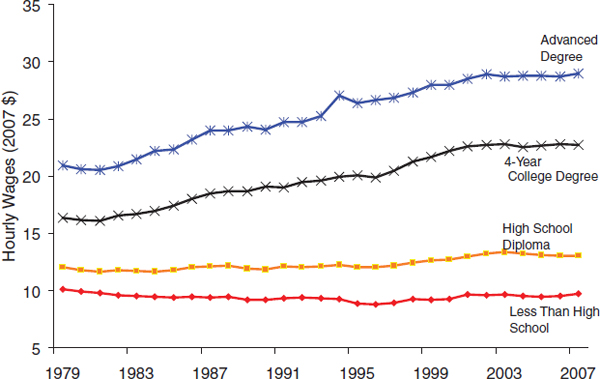
tion for individuals with less than a high school diploma (bottom line, marked with diamonds), a high school diploma (next line up, marked with squares), an undergraduate college degree (4 years of college, line marked with x’s), and advanced degrees (top line). The graphs reveal a steady increase in the differences in wages by education level for both men and women.
Over the years, the average hourly wages for men with high school diplomas or less changed very little, and by 2007, were slightly lower than in 1979. However, average hourly wages for men with at least a college degree steadily increased over the years to nearly $30 for those with college degrees and nearly $40 for those with advanced degrees. In 2007, men with advanced degrees made more than 2½ times as much per hour as men with less than a high school diploma. The same pattern holds for women, although women averaged lower hourly pay at each education level than their male counterparts. Murnane interpreted this information as indicating that educational attainment appears to play a larger role today in explaining average earnings than it did in 1979, noting “the gap between the premium [that] employers pay college graduates relative to high school graduates” has grown.
Economists tend to think in terms of supply and demand. In this context, “supply” refers to the characteristics and qualifications of individuals available to work, in other words, the characteristics of the labor force. Likewise, “demand” refers to the characteristics and qualifications that employers are looking for in their employees. In the labor force the two work together to influence wages. When demand for certain types of skills is high but the supply of workers with these skills is low, employers will pay more to get the workers they need. When there is a large supply of workers with certain skills but little demand for these skills, employers will pay less. Murnane suggested one explanation for the trends seen in the graphs is that the demand-side of what employers wanted did not change, while the supply-side of the available labor force did. That is, it could be that the labor force includes fewer college graduates relative to high school graduates than in the past, creating a situation where employers needed to pay higher wages to the relatively small proportion of available individuals with the needed qualifications. The data do not support this explanation, however.
To explain, Murnane displayed a graph comparing the educational attainment of the U.S. labor force in 1980 and 2000. Figure 1-3 shows the percentage of the labor force that dropped out of high school, graduated from high school, completed some college, and completed 4 years or more of college. For each education level, the left-most bar shows the percent for 1980 and the right-most bar shows the percent for 2000. As Figure 1-3 shows, the percentage of the labor force with at least some college
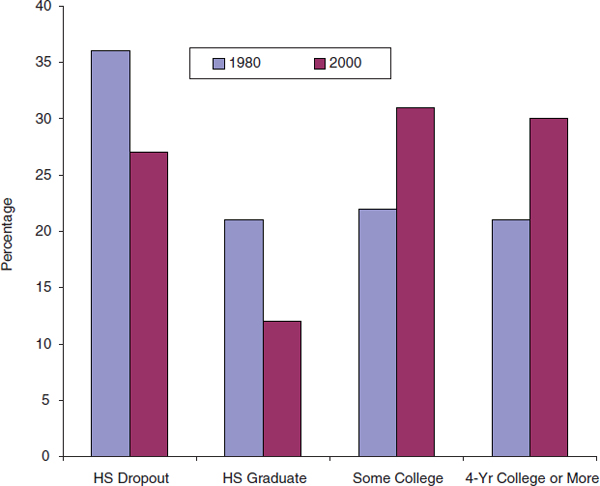
FIGURE 1-3 Educational attainment of the U.S. labor force, 1980 (left bar) and 2000 (right bar).
SOURCE: Richard Murnane’s presentation. Used with permission.
has increased since 1980; thus, it does not appear to be that the supply of college-educated people has decreased. Instead, Murnane believes the pay differences are more likely related to changes on the demand-side of the equation: employers are increasingly interested in individuals not just with a college education but who have certain types of skills.
If this is indeed the explanation, what changes have occurred on the demand-side that would help to account for it? Murnane suggested two related factors. First, there is increased use of computers and other forms of technology, and workers need training in order to make use of these technologies. Those who have this training are more suited to the available jobs, more attractive to employers, and more likely to obtain the higher-paying jobs.
Second, the use of computers interacts with the kinds of jobs available. Computers are particularly good at performing some types of jobs,
such as those that require routine tasks, rely on rule-based logic, and can be programmed. Increasingly, computers are replacing humans in performing these types of jobs. For instance, Murnane explained, airline passengers rarely get boarding passes from humans any longer, the use of automated self-checkout lines at the grocery store is growing, and most people do their banking with automated teller machines. Computers are not appropriate for other types of jobs, however, such as those that do not follow rule-based logic, those that require on-the-spot judgments, and those in which human interaction is essential. Some of these kinds of jobs—such as personnel managers and classroom teachers—require advanced training. Others—such as waiting on tables, caring for the elderly, and serving as a short order cook—require little advanced training.
Murnane said the growing income difference is due to an increased need for individuals to work in jobs that require technological skills, while, at the same time, there is a decreased need for individuals to perform routine tasks that can be computerized. Individuals without advanced training are employed in service jobs for which pay has been steady over time. Individuals with advanced training are working in the other jobs, in which pay has steadily increased.
Murnane argued that data on the types of jobs available supports this hypothesis. Figure 1-4 shows the percentage of people working in seven major job categories in 1979 and 2009. The job categories are arranged in order (left to right) from lowest paying to highest paying. In 1979, nearly 50 percent of the labor force was employed in blue collar and administrative support jobs. By 2009, the occupational distribution had shifted con-
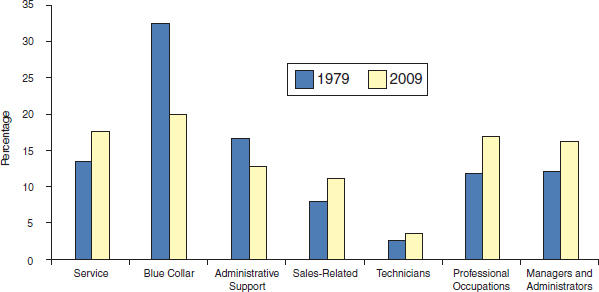
FIGURE 1-4 Distribution of occupations in the United States, 1979 and 2009.
SOURCE: Richard Murnane’s presentation. Used with permission.
siderably, with large declines in the percentage of individuals employed in blue color or administrative work and increases in the percentages of individuals employed in service occupations, professional occupations, and as managers or administrators.
So, which skills do people need in order to be attractive to employers and to perform well in these jobs? With his colleagues Autor and Levy, Murnane has studied the tasks required for various jobs. The researchers group the tasks into four categories:
- Routine cognitive tasks, such as bookkeeping and filing
- Routine manual tasks, such as assembly line work
- Tasks that require expert thinking, such as identifying and solving new problems
- Tasks that require complex communication, such as eliciting critical information and conveying a convincing interpretation of it
The researchers compiled data on the percentage of available jobs that require these four types of tasks and tracked the trends over a 30-year period (from 1969 to 1998). This information is displayed in Figure 1-5. In this figure the x-axis notes the years studied. The y-axis notes the change in the percentage of jobs that require the tasks, using 1969 as the
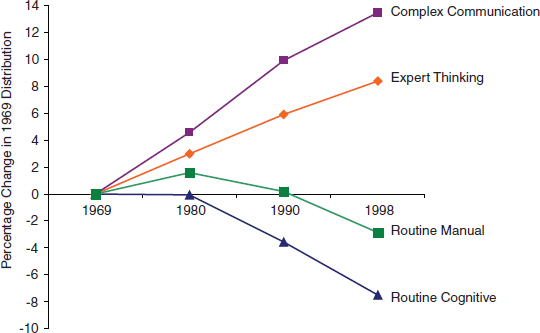
FIGURE 1-5 Economy-wide measures of routine and nonroutine task input: 1969-1998 (1969 = 0).
SOURCE: Levi and Murnane (2004). Reprinted with permission of Princeton University.
base year. Thus, the figure shows that the percentage of jobs that require routine cognitive tasks (line marked with black triangles) was steady from 1969 to 1980 and then began a steady decline. Likewise, the percentage of jobs that require routine manual tasks (line marked with gray squares) was relatively steady until 1990 and then began to decline. The top two lines show that the percentages of jobs that require expert thinking (line marked with gray diamonds) and complex communication (line marked with black squares) have steadily increased since 1969. Murnane interpreted this information as demonstrating that expert thinking and complex communication are clearly tasks that are increasingly in demand by employers.
Murnane has done additional work to explore the components of expert thinking and complex communication in order to better understand the attributes that are most important for the available jobs. His studies reveal that the components of expert thinking include the following:
- Within a domain, workers need a deep understanding of the domain and relationships within it
- Pattern recognition
- A sense of initiative (i.e., when you see a new task, is this a challenge you are anxious to take on or one you shy away from?)
- Metacognition (i.e., monitoring your own problem solving)
Likewise, the components of complex communication include the following:
- Observing and listening
- Eliciting critical information
- Interpreting the information
- Conveying the interpretation to others
At the workshop, Deborah Boisvert, a researcher with the Boston Advanced Technological Education Connection (BATEC), presented survey results that provide additional insight on the skills workers need in the current job market.2 In 2007, BATEC conducted a survey designed to learn more about the skills employers sought in their employees. The skills rated most highly by the survey respondents included the following:
________________
2Boisvert’s presentation is available at http://www7.national-academies.org/bota/21st_Century_Workshop_Boisvert.pdf [August 2011]. Additional information about BATEC is available at http://www.BATEC.org [August 2011].
- Communication skills (oral and written)
- Ability to work productively in teams and groups (teamwork skills)
- Customer and business focus (understanding the big picture)
- Ability to listen for meaning and comprehension
- Ability to prioritize work and self-evaluate (self-reflection and
- time management)
- Development of original solutions to novel problems (problem solving)
- Ability to lead and act responsibility (leadership and ethics)
Boisvert said that in follow-up interviews, survey respondents told her and her colleagues “while technical skills may help someone get an interview, it is the soft skills [such as those listed above] that get the person the job.”
Further evidence of the importance of these skills is documented in a recent study that Murnane discussed. Lindqvist and Westman (2011) conducted a study on the labor market outcomes for men in Sweden using a large sample of 18-year-old males enlisted in the country’s military. The study examined the relationships between cognitive and noncognitive skills and labor market outcomes. The noncognitive skills assessed were
- Willingness to assume responsibility
- Independence
- Outgoing character
- Persistence
- Emotional stability
- Initiative
- Social skills
Their research findings indicated that compared to measures of cognitive skills, measures of noncognitive skills were stronger predictors of wages,3 stronger predictors of employment status,4 and stronger predictors of annual earnings.5
________________
3A one standard deviation increase in the measure of noncognitive skills predicted an increase in wages by 9 percent, or one third of a standard deviation, compared to 5 percent for cognitive ability.
4A one standard deviation increase in the measure of noncognitive skills predicted a decrease in the probability of receiving employment support by 3.3 percentage points, compared to 1.1 percentage points for cognitive skills. Men with higher scores on the measure of noncognitive skills had shorter periods of unemployment, while cognitive ability had no statistically significant effect on the duration of unemployment.
5A one standard deviation increase in the measure of noncognitive skills predicted a
Murnane concluded his remarks by noting that he had focused his presentation on the relationships between 21st century skills and labor market outcomes, in part because labor market research provides a rich source of evidence about the importance of these skills. Nevertheless, he said he would argue that 21st century skills are needed in many aspects of life besides the workplace. As he put it, these skills are essential for “leading a contributing life in a pluralistic democracy.” He enumerated the complex set of problems that the country faces, including such issues as immigration, global warming, and proliferation of nuclear weapons. In his view, understanding these problems and participating in their solutions requires a well-educated citizenry adept at expert thinking and complex communication.
PREPARING STUDENTS FOR THE MODERN WORKPLACE
Are students graduating from high school with adequate preparation in these 21st century skills? At the workshop, representatives from the cosponsors of the project—the National Science Foundation (NSF) and the National Institutes of Health (NIH)— provided some insight on this issue. Gerhard Salinger, program director with the Directorate for Education and Human Resources at NSF, discussed his work with the advanced technological education program, an effort focused on technician education at the 2-year college level. This program is intended to educate students for middle skill jobs, occupations that require more than a secondary education but not necessarily 4 years of higher education. Middle skill jobs account for 50 percent of all jobs in the United States, Salinger said. He noted that the feedback he and his colleagues routinely receive from employers is that employees are lacking in 21st century skills. Furthermore, industry representatives have advised Salinger that these skills are not easily learned on the job. Based on his research and discussions with faculty members, Salinger judges that these skills are best learned in an academic setting. Salinger advocates for ensuring that students learn these skills before they leave high school. In part, this is because he believes that these are skills that everyone needs—not just for the workplace, higher education, or vocational/technical training—–but for dealing with all aspects of life.
Bruce Fuchs, director of the Office of Science Education at NIH, presented data on the problem-solving skills of students in the United States. The Programme for International Student Assessment (PISA) has rou-
________________
decrease in the probability that annual earnings fall short of the tenth percentile of the earnings distribution by 4.7 percentage points. The corresponding figure for cognitive ability fell from 1.5 to 0.2 percentage points.
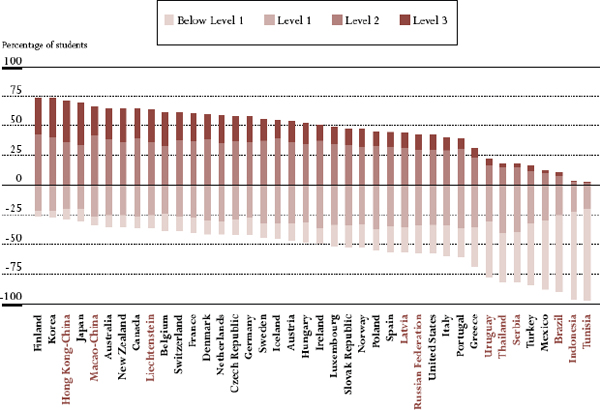
FIGURE 1-6 Percentage of students at each level of proficiency on the problem-solving scale of PISA 2003.
SOURCE: Organisation for Economic Co-operation and Development (2005). Problem Solving for Tomorrowís World: First Measures of Cross-Curricular Competencies from PISA 2003, http://dx.doi.org/10.1787/9789264006430-en.
tinely conducted assessments in mathematics, reading, and science. In 2003 an assessment of problem-solving skills was included. Fuchs said that he was “stunned” at the results for U.S. students, which he characterized as much lower than he had expected.
PISA results are reported using four performance levels: “Level 3” (highest), “Level 2,” “Level 1,” and “below Level 1” (lowest). Figure 1-6 shows the percentage of students from each participating country that scored at each performance level. The solid horizontal line at zero on the y-axis indicates the percentage of students at or below Level 1 (below the line) and at or above Level 2 (above the line). On the x-axis, the countries are ranked in descending order by the percentage of 15-year-olds in Levels 2 and 3. Fuchs highlighted three pieces of information on the graph. First, he noted that U.S. students rank ordered 29th compared to students in other countries. Second, he pointed out that 57 percent of the U.S. students taking the test scored below Level 2 (below the solid black line). Third, he called attention to the small percentage of students scoring
at Level 3, which he described as only one-third to one-half of that for the top scoring countries on the assessment.6
To exemplify the types of skills that are assessed, he described one of the items that was administered to the 15-year-olds taking the assessment. The item presented students with a map in which six fictional towns were noted (Kado, Lapat, Angaz, Megal, Piras, and Nuben), and a mileage legend that indicated the road distance of the towns from each other. The item presented students with two tasks:
1. Calculate the shortest distance by road between Nuben and Kado.
2. Zoe lives in Angaz. She wants to visit Kado and Lapat. She can only travel up to 300 kilometers in any one day but can break her journey by camping overnight anywhere between towns. Zoe will stay for two nights in each town so that she can spend one whole day sightseeing in each town. Show Zoe’s itinerary by completing the following table to indicate where she stays each night.
| Day | Overnight Stay |
| 1 | Camp site between Angaz and Kado |
| 2 | |
| 3 | |
| 4 | |
| 5 | |
| 6 | |
| 7 | Angaz |
Fuchs said that the sample item was one of the more complicated items on the assessment and was classified as a Level 3 item. Given that few of the U.S. students scored at a Level 3, most U.S. students would not have been able to answer this question correctly.
During discussion sessions, participants commented that the workshop was being held at an opportune time. Several commented about two reform movements currently underway. First, the National Gover-
________________
6Results from more recent administrations of PISA are similar. For results from the 2006 assessment, see the Organisation for Economic Co-operation and Development (2007) PISA 2006: Science Competencies for Tomorrow’s World Executive Summary, available at http://www.oecd.org/dataoecd/15/13/39725224.pdf [July 2011]. For results from the 2009 assessment, see the Organisation for Economic Co-operation and Development (2010), PISA 2009 Results: Executive Summary, available at http://www.oecd.org/dataoecd/34/60/46619703.pdf [July 2011]. Also see, ACT (2011) Affirming the Goal, available at http://www.act.org/research/policymakers/pdf/AffirmingtheGoal.pdf [July 2011].
nors Association (NGA) and the Council of Chief State School Officers (CCSSO) have led an effort by the states to change the standards for educating K-12 students in reading and math. Known as the “Common Core Standards Initiative,” this effort is working first to identify the skills that students need and have all states in the country adopt these standards and second to develop assessments of these skills.7 Second, the Race to the Top initiative sponsored by the U.S. Department of Education is capitalizing on this effort in supporting consortia of states in their work to design assessments to measure these standards.8 The focus of both efforts is to ensure that students graduate from high school with skills that make them college and career ready. Participants also pointed out that the National Assessment of Educational Progress (NAEP) has been working to define and develop an assessment of college and career readiness, and assessing college readiness has been a prime focus of organizations such as ACT, the College Board, and the Educational Testing Service (ETS). Thus, there is considerable work underway on this issue.
Developing assessments of these skills was an issue that several participants highlighted as critical. As one workshop participant put it, “what is tested is taught and what is not tested is not taught.” Assessments often serve the purpose of defining the standards and laying out priorities for instruction. If assessments focus solely on students’ achievements in factual knowledge, this type of information will be the focus of teaching. To ensure that students acquire and show progress in 21st century skills, assessments need to be available to evaluate their performance in these areas. Participants noted that this should include assessments designed for both summative and formative uses.9 The remaining chapters of this report focus on developing assessments of these skills. Specifically: How can these skills be assessed? What assessments are currently available and how well do they work? What needs to be done in order to develop these types of assessments? And how should the results be used?
________________
7Further information can be found at http://www.corestandards.org/ [June 2011].
8Authorized under the American Recovery and Reinvestment Act of 2009 (ARRA), the Race to the Top Assessment Program provides funding to consortia of states to develop assessments that are valid, support and inform instruction, provide accurate information about what students know and can do, and measure student achievement against standards designed to ensure that all students gain the knowledge and skills needed to succeed in college and the workplace. (See http://www2.ed.gov/programs/racetothetop-assessment/index.html [May 2011].)
9See Chapter 5 for an explanation of formative and summative assessment.


