
Uranium Occurrences,
Resources, and Markets
Key Points
• Of the localities in Virginia where existing exploration data indicate that there are significant uranium occurrences, predominantly in the Blue Ridge and Piedmont geological terrains, only the deposits at Coles Hill in Pittsylvania County appear to be potentially economically viable at present.
• Because of their geological characteristics, none of the known uranium occurrences in Virginia would be suitable for the in situ leaching/in situ recovery (ISL/ISR) uranium mining/processing technique.
• In 2008, uranium was produced in 20 countries; however, more than 92 percent of the world’s uranium production came from only eight countries.
• In general, uranium price trends since the early 1980s have closely tracked oil price trends. The Chernobyl (Ukraine) nuclear accident in 1986 did not have a significant impact on uranium prices, and it is too early to know the long-term uranium demand and price effects of the Fukushima (Japan) accident.
• Existing known identified resources of uranium worldwide, based on present-day reactor technologies and assuming that the resources are developed, are sufficient to last for more than 50 years at today’s rate of usage.
This chapter contains a brief description of the wide variety of geological settings that host uranium deposits worldwide, and then a more specific description of known uranium occurrences in the Commonwealth of Virginia. This latter section also notes the exploration status and a first-order indication of the exploitation potential of existing uranium resources in Virginia. The final section in this chapter describes uranium resource and reserve concepts, and reviews global and national uranium market trends.
WORLDWIDE OCCURRENCES OF URANIUM
Uranium deposits are known to occur as a result of a wide range of processes, from magmatic and fluid fractionation deep in continental crust to evaporation at the Earth’s surface (Box 3.1; Figure 3.2). The resulting concentrations of uranium within different rock types have an equally broad range, from a fraction of a part per million in ultramafic rocks up to 76 ppm in phosphorites (Lassetter, 2010; see Table 3.1). Uranium deposits have been mined with the most extreme range of grade (from about 1 × 10² grams/tonne of uranium for the phosphates of Florida, to nearly 2 × 10⁵ grams/tonne of uranium in the unconformity-related McArthur River deposit in Canada) and tonnage (from a few tonnes for some intragranitic veins in the French Massif Central to nearly 2 million tonnes of uranium (tU) in Australia’s Olympic Dam deposit).
IAEA Classification of Uranium Deposits
The International Atomic Energy Agency (IAEA) has classified uranium resources—on the basis of their geological setting and morphology—into a number of ore deposit types (IAEA, 2009). These are presented here in order of their approximate global economic significance:
Unconformity-Related Deposits
These deposits are spatially related to an unconformable contact separating crystalline basement from an overlying thick siliciclastic sediment sequence, with the deposits occurring at the contact level, and/or below or above the contact. Two subtypes of unconformity-related deposits are recognized (IAEA, 2009):
• Fracture controlled, dominantly basement-hosted deposits (e.g., McArthur River, Rabbit Lake, and Eagle Point in Canada; Jabiluka, Ranger, Nabarlek, and Koongarra in Australia)
• Clay bounded, massive ore developed along and just above, or immediately below, the unconformity in the overlying cover sandstones (e.g., Cigar Lake and Key Lake in Canada)
BOX 3.1
Chemical and Physical Properties of Uranium
and Geological Processes
Uranium is the heaviest and last naturally occurring element in the periodic table, with an atomic number of 92 and an atomic mass of 238. Because of its large ionic radius and high charge, uranium does not enter in the structure of major rock-forming minerals, and consequently is continuously enriched in melts either during magmatic processes such as partial melting or fractional crystallization. As a result, the most fractionated magmas—which are generally the richest in silica—are the most enriched in uranium; granites and rhyolites are much richer in uranium than mafic igneous rocks such as basalts or gabbros. In igneous rocks, uranium is associated with enriched thorium (Th), zirconium (Zr), titanium (Ti), niobium (Nb), tantalum (Ta), and rare earth elements (in minerals such as zircon, apatite, monazite, titanite, allanite, uraninite, etc.), particularly in peralkaline rocks but less so for metaluminous rocks and much less for peraluminous rocks.
Levels of uranium in common sedimentary rocks are closely related to the oxidation-reduction conditions. The highest concentrations (tens to hundreds of parts per million [ppm]a) are found in sediments that are rich in organic matter or phosphate. Lower uranium contents are generally recorded in coarse-grained sediments, and higher values in clay-rich sediments.
Uranium in nature occurs in two main oxidation states, U4+ and U6+. The U4+ state is stable in reducing conditions, weakly soluble in most geological conditions, and is the main valence occurring in uranium ore minerals (dominantly tetravalent uranium minerals). U6+ forms the uranyl UO22+ species, which is stable in oxidizing conditions and forms a large series of complexes (hydroxides, carbonates, sulfates, phosphates, etc.) which are very soluble in geological fluids. The uranyl species enters into the structure of hexavalent uranium minerals, which are also called secondary uranium minerals because they commonly result from the oxidation of tetravalent uranium minerals by interaction with oxygen-bearing surficial waters.
Uranium minerals are extremely diverse. Approximately 5 percent of all known minerals contain uranium as an essential structural constituent (Burns, 1999), although many of the hundreds of uranium-bearing minerals are rarely encountered mineral “curiosities.” Among the tetravalent uranium minerals, the two principal ones occurring in ore deposits are uraninite, with a UO2+x composition (called pitchblende when occurring with a colloform texture), and coffinite (USiO4).
Other common tetravalent minerals that generally contain several percent to several tens of percent of uranium are uranothorite (Th,U)SiO4, brannerite (U,Ca,Ce) (Ti,Fe)2O6, ningyoite (U,Ca,Ce)2(PO4)2·1.5H2O, Nb-Ta-Ti minerals such as uran-microlite (U,Ca,Ce)2(Nb,Ta)2O6(OH,F), uranpyrochlore (U,Ca,Ce)2(Ta,Nb)2O6(OH,F), euxenite (Y, Er, Ce, La, U)(Nb, Ti, Ta)2(O,OH)6 and can be also associated with organic matter in thucolite. Hexavalent uranium minerals are less abundant in ore deposits, but are the most diverse. They are highly colored and can be deposited either as primary ore minerals such as carnotite K2(UO2)2(VO4)2·3H2O, tyuyamunite Ca(UO2)2(VO4)2·3H2O, or more commonly as alteration products of tetravalent uranium minerals such as autunite Ca(UO2)2(PO4)2·10H2O or uranophane Ca(UO2)2SiO3(OH)2·5H2O.
Uranium also occurs as a minor constituent in accessory minerals such as zircon (Zr,U)SiO4, monazite (LREE,Th,U)PO4, xenotime (Y,HREE,U) PO4, bastnaesite (LREE)CO3F, and others. More comprenhensive information about uranium minerals is provided in Burns (1999), Finch and Murakami (1999), and Krivovichev et al. (2006).
Aqueous Geochemistry of Uranium
Uraninite and most other common uranium minerals are only sparingly soluble in water at neutral pH, low temperatures, and reducing conditions. The solubility of uraninite increases markedly in oxidizing conditions in the presence of anions such as OH–, F–, Cl–, CO32– SO42–, and PO43–, which form strong complexes with UO22+ (e.g., Langmuir, 1978; Guillaumont et al., 2003). These complexes considerably enhance the mobility of uranium in groundwater. For example, uranium is readily soluble in the strongly acidic, oxidizing water commonly associated with acid mine drainage because UO22+ sulfate complexes are stable below pH 4 (for a recent review of available data, see Kyser and Cuney, 2008). In oxidized fluids between pH 4 and 7.5, uranyl phosphate complexes become the important species with concentrations of only 0.1 ppm PO4. At higher pH, uranyl hydroxide or uranyl carbonate complexes predominate. As a result, sulfuric acid with pH of about 1 is used for in situ recovery in roll-front-type deposits (e.g., in Kazakhstan) and sodium carbonate solutions with an oxidant are used for in situ leaching of uranium in sandstone deposits in the Unites States. In reduced groundwater, at very low pH, only fluoride complexes of U4+ are significant; only at very high pH are uranyl hydroxides the dominant species, whereas at intermediate pH (between 4 and 8) uraninite solubility is extremely low (Langmuir, 1978).
Eh-pHa diagrams are a convenient way of visually summarizing the dominant aqueous speciation and mineralogy of redox-sensitive elements, such as uranium. The diagrams are constructed in a systematic way using a defined set of assumptions, initial conditions, chemical reactions for the system of interest, and the accompanying thermodynamic data. The final diagram depends on all of these factors; therefore, a very large number of Eh-pH diagrams could be constructed for uranium alone. They only depict equilibrium relationships, and the user must bear in mind that natural waters are commonly not at equilibrium. Nevertheless, these diagrams are a useful and enduring tool in the study and interpretation of natural waters.
A generic example of an Eh-pH diagram for the U–O2–H2O–CO2 system at 25°C is shown in Figure 3.1, assuming PCO2 = 10–35 atm (equilibrium with atmospheric CO2) and the median major ion composition of groundwater (Table 8.8 in Langmuir, 1997). The thermodynamic data were from the extensive reviews of Grenthe et al. (1992) and Guillaumont et al. (2003). Fields represent the range of Eh and pH conditions where each form dominates, that is, constitutes more than 50 percent of the uranium in the system, but neighboring forms will also be present. The boundaries separating the fields indicate where neighboring forms are present at equal concentration (strictly speaking, equal activity). The diagonal dashed lines at the top and bottom of the figure delineate the stability field of liquid water as a function of Eh and pH. In the large blue field in the upper left, the uranyl cation (UO22+)
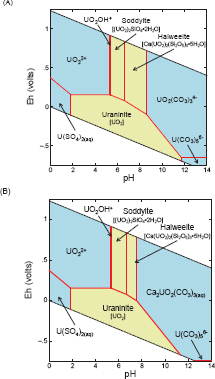
FIGURE 3.1 Eh-pH diagram for the U–O2–H2O–CO2 system at 25°C assuming PCO2 = 10–3.5 atm (equilibrium with atmospheric CO2) and the median major ion composition of groundwater (Table 8.8 in Langmuir, 1997). The fields shaded blue represent species dissolved in water (aqueous species) while the fields shaded tan represent solid mineral phases. The diagonal dashed lines at the top and bottom of the figure delineate the stability field of liquid water. Thermodynamic data are from Grenthe et al. (1992) and Guillaumont et al. (2003). UIV–SII species were not considered in this diagram. SOURCE: Committee-generated using The Geochemist’s Workbench® (Bethke, 2010).
would dominate uranium speciation at equilibrium. In that same field, some of the hydrolysis product UO2OH+ would also be present, but at lower concentrations than UO22+. Uraninite, a poorly soluble mineral of tetravalent—or reduced—uranium, occupies the large tan stability field at the bottom center of the diagram.
_________________
aEh represents the oxidation-reduction potential of a solution.
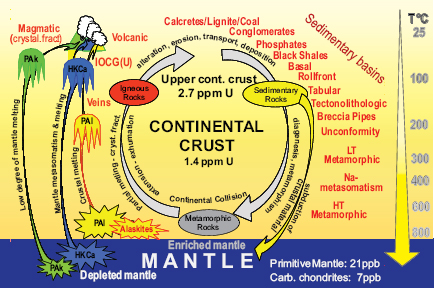
FIGURE 3.2 Schematic diagram illustrating the very wide range of geological processes that have resulted in uranium deposits. Average uranium concentrations of the main uranium reservoirs—the mantle (in blue), the crust (in yellow), and the upper crust are given. The circular arrows indicate the evolution of the geological cycle from surficial processes (alteration, erosion, transport by river and deposition) that produce sedimentary rocks, to deeper processes (burial of sedimentary rocks with increasing temperature and pressure) that produce metamorphic rocks; some of these rocks may be injected into the mantle during subduction. Increasing temperature leads to melting of the rocks in the continental crust and/or in the mantle and the genesis of plutonic and volcanic rocks that are injected in the Earth’s crust. Three main types of magmas can be enriched in uranium: Pal: per-aluminous magmas resulting from the partial melting of sedimentary rocks (Pal); highly potassic calc-alkaline magmas resulting from the partial melting of a mantle contaminated by subducted sediments (HKCa); and peralkaline magma resulting from very low degree of partial melting of a mantle, which can be contaminated (Pak). The main message in the schematic is the extreme variability of possible host rocks and concentration processes that can lead to potentially exploitable uranium deposits. SOURCE: Modified from Cuney (2009).
TABLE 3.1 Global Averaged Uranium and Thorium in Different Rock Types
| Rock Type | Uranium Content (ppm) | Thorium Content (ppm) | Thorium/Uranium Ratio |
| Ultramafic | 0.01 | 0.05 | 3.6 |
| Basalt | 0.4 | 1.6 | 4.0 |
| Gabbro | 0.8 | 3.8 | 4.7 |
| Granite | 4.8 | 21.5 | 4.5 |
| Nepheline syenite | 14 | 48 | 3.4 |
| Granulite | 1.6 | 7.2 | 4.5 |
| Granitic gneiss | 3.5 | 12.9 | 3.7 |
| Sandstone | 1.4 | 5.5 | 3.9 |
| Shale | 3.2 | 11.7 | 3.7 |
| Carbonate | 2.2 | 1.2 | 0.5 |
| Carbonaceous shale | 8.0 | 1.7 | 0.2 |
| Marine phosphorite | 76 | <1 | |
| Upper Crust Average | 2.5 | 10 | 4 |
| Seawater | 0.003 | 10-5 | 0.0002 |
SOURCE: Modified from Lassetter (2010); compiled from Rogers and Adams (1969), Woodmansee (1975), Gabelman (1977), and Rose et al. (1979).
These are the highest grade deposits in the world (generally higher than 1 percent uranium, and up to 20 percent for the McArthur River deposit). Their tonnages vary from some thousands of tonnes of uranium (tU) to more than 200,000 tU.
Sandstone Deposits
These deposits occur in medium- to coarse-grained sandstones deposited in continental fluvial or marginal marine sedimentary environments. The uranium is precipitated under reducing conditions associated with carbonaceous material, and/or sulfides, and/or hydrocarbons, and/or iron-magnesium minerals, disseminated within the sandstone. Four main subtypes are distinguished:
• Roll-front deposits. Uranium mineralized zones are crescent-shaped in cross section, sinuous horizontally, and localized between reduced sandstone on the hydrological gradient downside and oxidized sandstone on the hydrological gradient upside. Resources range from a few hundred tonnes to several tens of thousands of tonnes of uranium, at grades from 0.015 percent to 0.25 percent. Examples are Moynkum, Inkay, and Mynkuduk in Kazakhstan; and Crow Butte and Smith Ranch in the United States.
• Tabular deposits. Uranium minerals impregnate the sandstone matrix within tabular, irregularly shaped, lenticular masses within reduced sediments.
Individual deposits contain several hundreds of tonnes up to 200,000 tonnes of uranium, at average grades ranging from 0.05 percent to 0.5 percent, and occasionally up to 1 percent. Examples of such deposits include the Colorado Plateau in the United States; and Akouta, Arlit, and Imouraren in Niger.
• Basal channel deposits (paleovalleys). Uranium minerals are deposited within permeable alluvial-fluvial sediments that fill channels incised into uranium-rich basement granites, and generally sealed by basalt flows. Individual deposits can range from several hundreds to 20,000 tonnes of uranium, at grades ranging from 0.01 percent to 3 percent. Examples are the deposits of Dalmatovskoye (Transural Region) and Khiagdinskoye (Vitim district) in Russia.
• Tectonic/lithologic deposits. Uranium mineral precipitation is controlled both by the lithology and by tectonic structures. Individual deposits contain a few hundreds to 5,000 tonnes of uranium at grades of 0.1 percent to 0.5 percent. An example is the deposit of Mas Laveyre in France.
Hematite Breccia Complex Deposits
These deposits occur in hematite-rich breccias, where the uranium minerals are associated with copper, gold, silver, and rare earths. The only representative of this type of deposit presently being mined is Olympic Dam in South Australia. This is the largest mined uranium deposit in the world, with reasonably assured resources (defined below) recoverable at less than US$80/kg U of more than 1.2 million tU (GA/ABARE, 2010).
Quartz Pebble Conglomerate Deposits
Detrital uraninite is deposited, together with pyrite and gold, in monomictic (only quartz pebbles) conglomerates that are the basal units of fluvial to lacustrine braided stream systems older than 2.4 Ga. Examples include the Witwatersrand Basin in South Africa, where uranium is mined as a byproduct of gold (0.02 to 0.05 percent uranium grade), and the Blind River/Elliot Lake area in Canada which has higher grades (0.1 to 0.15 percent uranium), where only uranium was mined.
Vein Deposits (Granite-Related Deposits)
The major component of the mineralization fills fractures associated with strike-slip extension. The veins consist of gangue material (e.g., carbonates, quartz) and uranium minerals. Typical examples range from pitchblende veins (e.g., Pribram in the Czech Republic, Schlema-Alberoda in Germany), to stock-works and episyenite columns (e.g., Bernardan in France), to narrow cracks in granite or metamorphic rocks (e.g., Mina Fe in Spain, Singhbhum in India). Individual deposits contain from a few hundreds of tonnes to 80,000 tonnes of uranium at grades of 0.05 percent to 0.6 percent.
Intrusive Deposits
These deposits are associated with intrusive or anatectic rocks (alaskite, granite, monzonite, peralkaline syenite, carbonatite, and pegmatite). Examples include the Rossing alaskites in Namibia, very-low-grade uranium as a byproduct of porphyry copper deposit mining (such as Bingham Canyon in the United States), the Ilímaussaq lujavrites in Greenland, and the Palabora carbonatite in South Africa.
Volcanic- and Caldera-Related Deposits
These deposits are associated with volcanic caldera that are infilled with mafic to felsic volcanic complexes and intercalated clastic sediments. Mineralization is largely structural-controlled (minor stratabound), occurs at several stratigraphic levels of the volcanic and sedimentary units, and extends into the basement where it is found in fractured granite and in metamorphic rocks. Uranium minerals are commonly associated with molybdenite and fluorite. Individual deposits contain from a few hundreds of tonnes to 37,000 tonnes of uranium at grades of 0.1 percent to 0.3 percent. The most significant deposits of this type are located in Russia (Streltsovska district), China (Xiangshan), and Mongolia (Dornot).
Metasomatic Deposits
The largest deposits of this type occur in Precambrian shields, where they are related to crustal-scale shear zones along which different types of basement rocks—granites, migmatites, gneisses, and banded iron formations—are desilicified and subject to sodium-metasomatism with production of albitites, aegirinites, and carbonaceous-ferruginous rocks. Ore lenses and stocks are a few meters to tens of meters thick, and some are hundreds of meters long. The vertical extent of ore mineralization, mostly brannerite and uraninite, can be more than 1.5 km. Individual deposits contain from a few hundreds of tonnes to 80,000 tonnes of uranium at grades of 0.08 percent to 0.3 percent. Examples include the Michurinskoye and Zheltorechenskoye deposits in Ukraine, and Lagoa Real and Itataia in Brazil.
Surficial Deposits
Surficial uranium deposits result from young (Tertiary to Recent) near-surface uranium mineral deposition in sediments and soils. The largest deposits are paleovalleys filled with poorly sorted siliciclastic rocks in which calcretes (carbonate concretions) are formed in arid to semiarid climatic conditions as a result of evaporation. Individual deposits contain from a few hundreds of tonnes
to 65,000 tonnes of uranium at grades of 0.012 percent to 0.13 percent. The main deposits are in Australia (Yeelirrie) and Namibia (Langer Heinrich and Trekopjje). Surficial uranium deposits also can occur in peat bogs and soils.
Collapse Breccia Pipe Deposits
The breccia pipes are vertical, circular, and result from karst limestone dissolution; they are infilled with fragments derived from the gravitational collapse of overlying formations. The uranium minerals occur in the permeable breccia matrix and in the arcuate, ring-fracture zone surrounding the pipe. Individual deposits contain from a few hundreds of tonnes to a few thousands of tonnes of uranium at grades of 0.16 percent to 0.85 percent. Type examples are the deposits in the “Arizona Strip” north of the Grand Canyon.
Phosphorite Deposits
These deposits consist of synsedimentary stratiform marine phosphorites deposited on the continental shelf. The uranium is hosted by apatite, and can be recovered as a byproduct of phosphoric acid production. Phosphorite deposits constitute large uranium resources, but at a very low grade. Individual deposits contain from tens of thousands of tonnes to more than 3 million tonnes of uranium at grades of 0.01 percent to 0.03 percent. Examples include the pebble phosphate deposit of New Wales in Florida, and Gantour in Morocco. Some phosphorite deposits consist of argillaceous marine sediments rich in uraniferous fish remains (e.g., Melovoe in Kazakhstan).
Other Deposits
The following deposits are of lesser importance
• Metamorphic deposits. The concentration of uranium directly results from metamorphic processes. The age of uranium deposition and the temperature and pressure at which it occurred are similar to those of the enclosing rocks. Examples include the Forstau deposit in Austria and the Mary Kathleen deposit in Australia.
• Limestone andpaleokarst deposits. An example includes uranium mineralization in the Jurassic Todilto Limestone in the Grants district of New Mexico, where uranium oxides occur in intraformational folds and fractures.
• Coal deposits. Elevated uranium contents occur in lignite/coal and in clay and sandstone immediately adjacent to lignite/coal. Examples are the Serres Basin in Greece, and occurrences in North Dakota. Uranium grades are very low, averaging less than 50 ppm of uranium.
Rock Types with Elevated Uranium Contents
Rock types with elevated uranium content include granites and black shales. No deposits have been mined commercially in these types of rocks; grades are very low, and it is unlikely that these types of uranium accumulations would become economic in the foreseeable future on their own, although uranium can be extracted as a byproduct if other associated elements reach economic concentrations (see below).
“Unconventional” Uranium Deposits
The IAEA has defined uranium “unconventional resources” as resources from which uranium can only be recovered as a minor byproduct, such as the uranium associated with phosphorites, nonferrous ores, carbonatites, black shales, lignite, and seawater. However, this definition may evolve depending on uranium prices and technological improvements, and some of these resources—such uranium in black shales or phosphorites—may become a significant resource in the future.
Other major nonconventional resources are the following:
• Several projects are being developed (many in South Africa, and also in the Czech Republic, Kyrgyzstan, and Tajikistan) for reprocessing the tailings produced during previous uranium or other metal extraction. For example, Rand Uranium is currently determining the feasibility of reprocessing tailings to extract gold and uranium in the Randfontein/Westonaria region, Witwatersrand, South Africa.
• About 1,100 tU have been recovered from lignite ash produced from 1964 to 1967 in North Dakota. In China, there is testing of uranium extraction from coal ash produced by the burning of lignite coal.
• Uranium may be extracted from monazite recovered from sand placers, if rare earth elements (REE) and thorium production from this resource restart in the future. Monazite from sand placers typically contains several thousand parts per million of uranium.
• Uranium has been recovered from porphyry copper operations in the United States and Chile that have very low uranium grade (tens of parts per million), and it is likely that other ore deposits that are presently being mined also contain significant levels of uranium. Recently, the Talvivaara nickel-zinc mine in Finland, with 15-20 ppm uranium in the ore, announced production of about 350 tU per year from the leach solution.
• Tens of tonnes of uranium are produced each year from water treatment processes associated with the management of former uranium mines and tailings.
Classification of Uranium Deposits Based on Ore Formation Processes
Although there have been a number of classifications published for uranium deposits (e.g., Dahlkamp, 1993, 2009), the IAEA classification described above is the most commonly used, based principally on the nature of the enclosing rocks and the morphology of the uranium deposits. One disadvantage of the IAEA classification is that deposits resulting from very different genetic processes and occurring in very different geological environments can end up being grouped in the same category, and this is especially true for vein deposits and uranium deposits disseminated in plutonic rocks. In the case of plutonic rocks, this category contains deposits resulting from partial melting in deep structural settings within high grade metamorphic rocks (e.g., the alaskite dykes of Rössing, in Namibia), as well as deposits resulting from extreme fractional crystallization occurring in very surficial settings at the apex of peralkaline complexes (e.g., the Ilímausaq peralkaline complex in Kvanfjeld, Greenland).
During the past 60 years, there has been tremendous progress in knowledge concerning the physical and chemical processes controlling the formation of uranium deposits, and it is now possible to classify uranium deposits based on their genesis, mainly reflecting differences in the physical and chemical fractionation processes acting during different stages of the geological cycle (Cuney and Kyser, 2008; Cuney, 2010). In comparison to other metals, scientific knowledge of uranium fractionation mechanisms is uniquely helped by its natural radioactive properties. These allow abundance to be estimated from the smallest scale, at less than the part-per-million level using fission tracks analyses, to the crustal scale using heat flow/heat production relations. In addition, uranium accumulation can be dated directly using geochronometers (206Pb/238U and 207Pb/235U) for million to billion year timescales, or by using isotopes from the decay chain of the two uranium isotopes for timescales less than a million years.
The metal accumulation in a given ore deposit depends on the combined efficiency of the successive fractionation processes that occurred, including metal extraction from the source, metal transport, and metal deposition. Each of these processes is represented in the following genetic classification of uranium deposits, based on the most effective metal concentration mechanism in a given deposit, and is used below in the description of potential uranium deposits in Virginia:
1—Fractional crystallization, for example, Ilímausacq in Greenland, Bokan Mountain in Alaska. Corresponds to part of the IAEA’s intrusive type of deposits, but is always associated with the most extremely fractionated magmas in peralkaline magmatic association. They are located at very high levels in continental crust.
2—Partial melting, for example, Rössing in Namibia. Also corresponds to part of the IAEA’s intrusive type of deposits, but in this case results from the partial melting of uranium-rich sediments deep in continental crust.
3—Hydrothermal high-level post-orogenic. Corresponds mostly to the IAEA’s vein-type deposits, but here is classified as deposits resulting from the circulation of hot fluids at high levels in continental crust (either in volcanic or plutonic rocks), and occurring after the formation of a mountain belt (post orogenic).
3A—Volcanic–hydrothermal, for example, Streltsovska in Russia. Equivalent to the IAEA’s volcanic- and caldera-related deposits; results from hot fluid circulation in volcanic rocks.
3B—Granitic–hydrothermal, for example, French Variscan, Erzgebirge in southeastern Germany and the Czech Republic. Equivalent to the IAEA’s vein-type deposits (granite-related deposits); results from hot fluid circulation in plutonic rocks.
4—Diagenetic hydrothermal systems. Corresponds to many of the IAEA deposit types, but all are generated by the circulation of hot brines (highly saline solutions) circulating in more or less buried sedimentary basins. Three main subtypes are distinguished according to the location of the reduction-oxidation (redox) boundary that controls uranium deposition:
4A—Basin/basement redox control (IAEA’s unconformity-related deposit); the redox boundary is located at the base of the sedimentary basin.
4B—Interformational redox control, for example, Oklo, Gabon (included in the IAEA’s sandstone type); the redox boundary is located between two formations within the sedimentary basin.
4C—Intraformational redox control; the redox boundary is located within a permeable sedimentary formation; these are divided into three subtypes according to their morphology:
4C1—Tabular, for example, Grants Mineral Belt in the United States, Beverly in Australia (same as the IAEA classification)
4C2—Tectonolithologic, for example, Akouta, Niger (same as the IAEA classification)
4C3—Karsts (breccia pipes), for example, Colorado in the United States (collapse breccias pipes in the IAEA classification)
5—Hydrothermal metamorphic, for example, Shinkolobwe in the Democratic Republic of Congo, Mistamisk in Quebec, Canada (IAEA’s metamorphic deposits); resulting from the circulation of metamorphic fluids.
6—Hydrothermal metasomatic (IAEA’s metasomatite deposits):
6A—Alkali-metasomatism, for example, Lagoa Real in Brazil, Krivoi Rog in Ukraine; resulting from regional-scale circulation of fluids of unknown origin, with dissolution of quartz and replacement of most other minerals by albite.
6B—Skarns, for example, Mary Kathleen in Australia, Tranomaro in Madagascar; resulting from fluid and element exchange between a granitic magma and enclosing marbles.
7—Synsedimentary (corresponds to a range of IAEA deposit types); deposits resulting from uranium concentration occurring simultaneously with deposition
of the sediment that formed the sedimentary rock, although by different processes:
7A—Mechanical sorting: quartz pebble conglomerates, for example, Witwatersrand, Elliot Lake (IAEA quartz pebble conglomerates); uranium concentration results from a purely physical (mechanical) process.
7B—Redox trapping: black shales, for example, alum shales, Sweden (marine and continental) (IAEA black shale unconventional deposits), resulting from the reduction of uranium contained in sea or lake water by the organic matter deposited with the shales.
7C—Crystal-chemical/redox trapping, phosphates, for example, Maroc (IAEA phosphorite deposits); uranium from seawater is incorporated into the crystal structure of apatite in reducing conditions. Apatite is the main component of fish bones that are locally accumulated on epicontinental platforms under favorable conditions.
8—Intraformational meteoric fluid infiltration, deposits formed by the infiltration of meteoric water at low temperature in permeable sedimentary rocks:
8A—Along sealed paleovalleys, for example, Vitim in Transbaikalia (IAEA’s basal channel deposits)
8B—As roll fronts, for example, Powder River Basin in Wyoming (IAEA’s roll-front deposits)
9—Weathering and evaporation, calcretes, for example, Yeleerie in Australia (IAEA’s surfical deposits; more specifically calcretes)
10—Other types, breccia complex, for example, Olympic Dam in Australia (IAEA’s hematite breccia complex), here classified as “other” because the conditions of formation are insufficiently known for precise classification.
VIRGINIA OCCURRENCES AND PROSPECTIVITY STATUS
Lassetter (2010) recently presented a compilation of uranium occurrences in the Commonwealth of Virginia, using published reports, unpublished geochemical data, and field scintillometer measurements, and this compilation forms much of the basis for this section. More than 55 uranium occurrences were identified by Lassetter (2010) (Figure 3.3), based on the presence of uranium-bearing minerals, the detection of elevated natural radioactivity, and/or geochemical data indicating elevated uranium content when compared with the expected natural background concentrations. These occurrences represent uranium concentrations in seven of Virginia’s geological terrains (Lassetter, 2010): (1) Tertiary-age marine phosphatic sedimentary rocks, (2) Late Jurassic–Early Cretaceous alkalic igneous rocks, (3) Triassic-Jurassic carbonaceous sedimentary strata and contact metamorphic aureoles, (4) Late Paleozoic pegmatites and late magmatic-stage granitic rocks, (5) Late Devonian and Early Mississippian black shales and sandstones, (6) Middle and Late Proterozoic alkali-rich plutonic rocks, and (7) major cataclasite/mylonite zones.
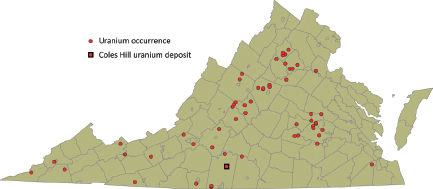
FIGURE 3.3 Map showing uranium occurrences in Virginia; subsequent figures present this information for each of the different types of uranium occurrence. Note that uranium occurrences are not necessarily uranium ore deposits. SOURCE: Modified from Lassetter (2010).
In the mid to late 1970s, the U.S. government took steps to stimulate uranium exploration in response to the 1973 OPEC oil embargo. The National Uranium Resource Evaluation (NURE) program was created with the goal of identifying uranium resources in the United States (Smith, 2006). One of the main components of this program was an airborne gamma-ray spectrometry survey to detect gamma-ray emissions from radioactive decay of uranium (U), thorium (Th), and potassium (K) (Duval et al., 2005). The NURE maps indicate varying levels of surface concentrations of U, Th, and K (Kucks, 2005; see Figure 3.4). In 1977, Marline Uranium Corporation initiated ground surveys in Virginia in search of uranium deposits, and began to acquire mineral leases in Pittsylvania, Fauquier, Orange, Madison, and Culpeper counties. In 1982, Marline announced the discovery of orebodies and formed a joint venture with Union Carbide Corporation to develop the South deposit at what is now called Coles Hill (Reynolds, 2010). That same year, the Virginia legislature instituted a statewide moratorium on uranium mining but left available the right to explore for uranium. In 2007, Virginia Uranium Inc. applied for and received an exploration permit to drill new exploratory drill holes in and around the Coles Hill.
Uranium deposits that are presently known in Virginia, or may potentially occur based on lithological characteristics, are described together with an estimate of discovery and mining potential for the foreseeable future. These are presented according to the deposit types based on genesis presented above, because this type of classification is better suited for predicting the occurrence of uranium deposits in poorly explored areas.
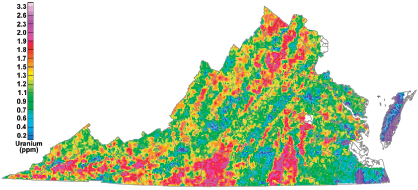
FIGURE 3.4 Aeroradiometric map of Virginia showing the concentration of uranium (eU) in the top few centimeters of rock or soil, derived by reprocessing National Uranium Resource Evaluation (NURE) program aerial gamma-ray data. SOURCE: Kucks (2005).
Granitic Hydrothermal Deposits (3B)
Concentrations of uranium in veins within granites occur in the Blue Ridge, Western Piedmont, and eastern Goochland Raleigh terrains (Figure 3.5). They result from the remobilization by hydrothermal fluids of uranium disseminated in large granite bodies. These granites are anomalously enriched in this element (15-30 ppm uranium) compared with average granites (about 4 ppm uranium) and easily leach-able (i.e., not hosted by insoluble mineral phases). These occur in Virginia in three different geological situations and ages—Middle to Late Proterozoic granites, Late Paleozoic granitic rocks and pegmatites, and Late Jurassic–Early Cretaceous peralkaline intrusive rocks (Lassetter, 2010).
Middle to Late Proterozoic Granites
Middle to Late Proterozoic granites (Crozet, Old Rag, Marshall granites, Robertson River peralkaline complex, Elk Park Plutonic Group) of the Blue Ridge belt (Figures 3.5, 3.6) contain background uranium concentrations up to 25 ppm (Lassetter, 2010), with an average of 5 to 10 ppm uranium. The average Th/U ratio for the granites is about 10:1, suggesting uranium depletion (Baillieul and Daddazio, 1982).
A study of the uranium resource potential of the Blue Ridge and Piedmont areas was undertaken by Bendix Field Engineering Corporation as part of the Department of Energy’s NURE project in the early 1980s. This project led to the discovery of U-Th–enriched cataclastic zones of the Precambrian Lovingston Formation (Figure 3.7) near Charlottesville in the Blue Ridge Belt (Baillieul and
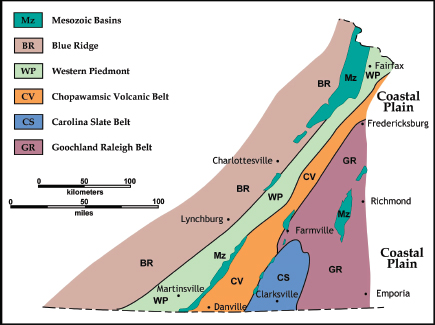
FIGURE 3.5 Generalized structural map showing terrains of the Virginia Piedmont and Blue Ridge areas. SOURCE: Modified from Bailey (1999b).
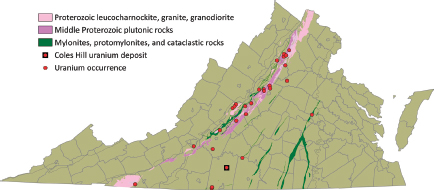
FIGURE 3.6 Distribution of Middle to Late Proterozoic granites and gneisses of the Blue Ridge belt, together with complexly deformed mylonites, shear zones, and cataclasites. SOURCE: Modified from Lassetter (2010).
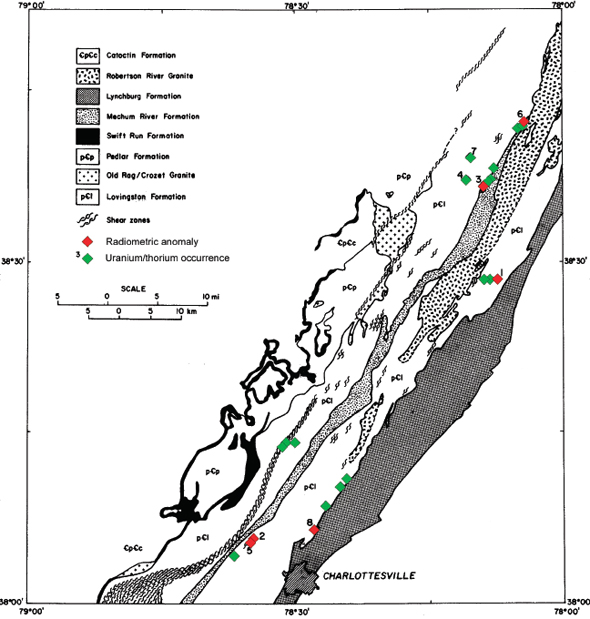
FIGURE 3.7 Uranium/thorium occurrences (green triangles) and radiometric anomalies (red triangles) in the Lovingston Formation, north of Charlottesville. SOURCE: Baillieul and Daddazio (1982).
Daddazio, 1982). The principal radioactive minerals are uranothorite, monazite, and thorogummite occurring with pyrite in the most radioactive rocks. Mineralization has been attributed to magmatic fluids enriched in uranium and thorium during late-stage magmatic differentiation in uranium-rich granitic plutons (Old Rag/Crozet granites) emplaced to the east. With existing economic conditions, this type of mineralization may be of interest for thorium resources but not for uranium.
Late Paleozoic Granites and Pegmatites
Late Paleozoic fractionated granitic rocks include the Petersburg, Leatherwood, Falls Run, Red Oak, and Portsmouth granites (containing up to 16.9 ppm of uranium), and pegmatites with allanite, monazite, autunite, fergusonite, uranophane, and microlite. These deposits occur mostly in the Western Piedmont Belt and eastern Goochland (Figure 3.8).
Anomalous radioactivity from thorium and uranium was detected in a 1974 aeroradiometric survey in an area of crystalline rocks in the Piedmont, just southwest of Powhatan (immediately to the west of Richmond), in the Goochland area of Virginia (Krason et al., 1988). Detailed geological, geochemical (samples of soil, stream sediment, and rock outcrops analyzed for uranium, thorium, cobalt, vanadium, and molybdenum), and ground radiometric surveys of a 3.8-square-mile area were carried out between 1976 and 1978. Total-count ground radioactivity readings defined a distinct northeastward-trending linear anomaly on the axis of the Goochland anticline. In 1986, two core holes were drilled to depths of 140 and 160 ft. The surveys and analyses indicate the radioactivity is mainly caused by thorium present in monazite within the Maidens gneiss (Krason et al., 1988). These two occurrences of radioactive mineralization are dominated by thorium and therefore are not of economic interest in the present market conditions.
Late Jurassic–Early Cretaceous Peralkaline Intrusive Rocks
Late Jurassic–Early Cretaceous nepheline syenite dikes occurring in Augusta County (Figure 3.9) contain up to 22 ppm of uranium. Deposits expected in this geological environment would be Type 1 (fractional crystallization) or Type 3B
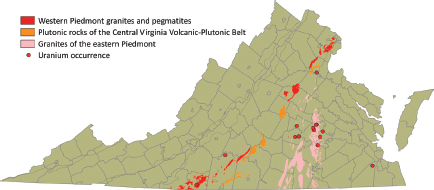
FIGURE 3.8 Distribution of Late Paleozoic fractionated granitic rocks and pegmatites. SOURCE: Modified from Lassetter (2010).
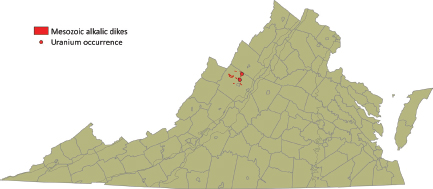
FIGURE 3.9 Location of Late Jurassic–Early Cretaceous peralkaline intrusives in Augusta County. SOURCE: Modified from Lassetter (2010).
(hydrothermal-granitic). Although many of these granitoid massifs initially appear to be favorable targets for uranium exploration of vein-type mineralization, the extensive exploration and coring conducted in these areas during the late 1970s and early 1980s show that the uranium deposits are small, and the discovery of economic uranium deposits would require a considerable effort in new exploration.
Comparable uranium deposits. The most analogous area for the type of deposit (Type 3B) that may exist in such granitoid intrusive rocks occurs in the Variscan belt in France and the southeastern part of Germany, from which about 350,000 tU were extracted from the 1950s to the 1990s, and in the Czech Republic where the Ro![]() ná uranium deposit is still mined. These two countries have climatic conditions very comparable to those of Virginia, with a temperate and relatively humid climate, a strong vegetation cover, extensive farming, and relatively high population density.
ná uranium deposit is still mined. These two countries have climatic conditions very comparable to those of Virginia, with a temperate and relatively humid climate, a strong vegetation cover, extensive farming, and relatively high population density.
Synsedimentary Deposits
These types of deposits include Devonian-Mississippian sedimentary deposits in the Appalachian Plateau area of western Virginia and marine phosphorites occurring in the Coastal Plain.
Devonian-Mississippian Sediments
The Devonian-Mississippian black shales (synsedimentary redox trapping; Type 7B) in the Appalachian Plateau area (Figure 3.10) contain approximately
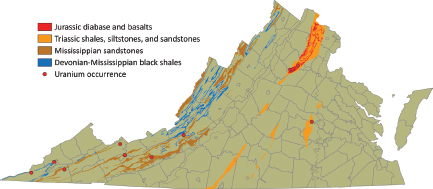
FIGURE 3.10 Distribution of Devonian-Mississippian sedimentary deposits in the Appalachian Plateau area of western Virginia and Triassic sedimentary rocks and Jurassic basalts of the Piedmont. SOURCE: Modified from Lassetter (2010).
70 ppm uranium, and Mississippian sandstones contain up to 140 ppm uranium. Because these sediments have much lower uranium grades than the large resources hosted by the alum shales in Sweden (see below), the development of such a resource in Virginia is unlikely to occur in the foreseeable future.
Comparable uranium deposits. The Cambrian-Ordovician alum shales in southern Sweden represent uranium resources of over 1 million tU, and the Ranstad deposit alone—extending over 490 km2—contains ~254,000 tU at 170 to 250 ppm. Test mining had occurred by the end of the 1970s, but ceased because of the high costs of uranium extraction. These resources are not economic in the present market conditions. Climatic conditions for this part of Sweden are comparable to those of Virginia, except with lower average temperatures.
Marine Phosphorites
Tertiary phosphatic sediments (synsedimentary crystal-chemical/redox trapping deposits, type 7C) cover large parts of the Coastal Plain (Figure 3.11), where they locally contain up to 1,350 ppm uranium.
Comparable uranium deposits. Phosphorites in Florida were mined until 1992, with a production of about 900 tons of uranium per year and average grades close to 100 ppm uranium. Phosphorites in Morocco represent by far the largest resource of this type in the world, with several million tons of uranium
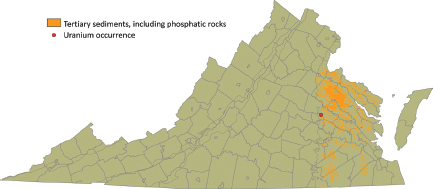
FIGURE 3.11 Distribution of Tertiary sedimentary rocks on the Virginia coastal plain, mostly of Miocene age, that may contain uranium-enriched phosphates. A single sample location with an anomalously high uranium value is shown. SOURCE: Modified from Lassetter (2010).
at an average grade of 100 to 150 ppm uranium (IAEA, 2009). Studies are being undertaken to determine the feasibility of recovering uranium from the Moroccan phosphorites. If uranium production from phosphorites becomes economically attractive, production would start first in Morocco because of the high uranium grades, and the next most economically attractive would be the Florida deposits. Production of uranium from Virginia phosphorites is not expected in the foreseeable future.
Pennsylvanian Coal Ash Deposits (Unconventional Deposit)
Pennsylvanian coal deposits are abundant in the Appalachian Plateau area, where they are extensively mined in open pits and underground. Uranium production from coal ash could occur in the vicinity of the power plants using the coal, but uranium production would not be in the vicinity of the coal mines.
Comparable uranium deposits. Uranium extraction from coal ash is presently being studied in China, to test the extraction of uranium from ash produced by the burning of lignite coal (Morales et al., 1985). This coal has high ash content (20-30 percent) and an average uranium content of 65 ppm (range of 20-315 ppm). With an average uranium content of 125 ppm, annual coal ash produced from three power stations contains about 150 tU. Assuming a uranium recovery rate of 70 percent, 105 tU per year could be produced from this Chinese ash. About 1,100 tU was recovered from lignite ash between 1964 and 1967 in North Dakota.
Synsedimentary Placers (Unconventional Deposit)
Uranium can be a byproduct of thorium–rare earth elements (REE) production from monazite. Monazite itself is recovered as a byproduct of processing heavy mineral sands, mainly for the extraction of ilmenite, rutile, leucoxene, and zircon for the production of titanium and zirconium. Thorium, which averages 6-7 weight percent in monazite, is a byproduct of refining monazite for its REE content. Uranium concentrations in monazite reach several thousand parts per million on average, and thus may represent an additional byproduct of REE and thorium extraction from monazite.
Uranium extraction as a byproduct of REE and thorium recovery from monazite can be expected in the future. However, the extraction of these elements will not be the leading factor for increasing the mining of heavy mineral sands; these driving factors are first titanium and zirconium extraction, and then the REEs, and in last position, thorium. Uranium will be a byproduct with little or no influence on the global extraction of heavy mineral sands.
In 2003, Virginia ranked second in the United States for the production of titanium and zirconium from heavy mineral sands. That year, Iluka Resources produced 360,000 tons of heavy mineral concentrate from Old Hickory placers in Dinwiddie County (Figure 3.12). These placers, up to 50 ft thick, correspond to Pliocene nearshore beach and dune sands deposited 3 million to 4 million years ago when the shoreline of the Atlantic Ocean was near Richmond. The heavy mineral concentration averages 8 weight percent, with about 80 percent of the heavy minerals being ilmenite, leucoxene, rutile, and zircon, and the remaining part containing monazite, REE, Th, U, and phosphate. Note that between 1880 and 1918, almost all domestic production of monazite, for thorium production,
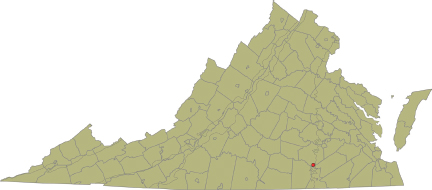
FIGURE 3.12 Location of the Old Hickory placers in Dinwiddie County. SOURCE: VA DMME Division of Geology and Mineral Resources (http://www.dmme.virginia.gov/DMR3/heavyminsand.shtml; accessed October 2011).
came from the heavy minerals sands of the Piedmont area of North Carolina and South Carolina, with resources of 857,000 tonnes of monazite at 5.61 weight percent ThO2 and 0.36 weight percent U3O8 (Overstreet, 1967).
Comparable uranium deposits. Australia and India have considerable uranium resources in placer deposits, but they are not economic to mine in the present market conditions. However, a supply shortage of the REEs as a consequence of recent policy decisions by China may lead to a renewal of REE extraction from monazite. In addition, some countries—India and Russia in association with the United States—are developing thorium reactors that should increase thorium demand and thus may increase the interest of monazite processing for simultaneous REE, thorium, and uranium recovery.
Diagenetic Hydrothermal Deposits (Type 4)
These deposits are sandstone-hosted, and may occur in Pennsylvanian to Mississippian and Triassic age lithological units in Virginia. Some of the fine- to coarse-grained Pennsylvanian to Mississippian continental sandstones (Figure 3.8) contain paleochannels that acted as permeable aquifers for the circulation of uranium-bearing diagenetic fluids, and with reductants that caused uranium precipitation. These sandstones—for example, the Harlan sandstone, intercalated with discontinuous coal beds; the Wise Formation, containing coal beds and volcanic ash that may have been a uranium source; the Gladeville sandstone, with coal beds and plants; and the Lee, Pocahontas, New River, and Hinton Formations—can contain up to 140 ppm uranium.
The Upper Triassic sandstones of the Newark Supergroup contain layers of fine- to coarse-grained continental sandstones with paleochannels, intercalated with carbonaceous shales and coal and bituminous occurrences. These constitute the required elements for the formation of roll-front-type uranium deposits. Moreover, high methane concentrations have been reported in the Richmond and Taylorsville basins, and uranium anomalies associated with phosphate-rich layers represent additional favorable criteria for the occurrence of uranium deposits.1 The airborne radiometric map of the Culpeper and Barboursville Basins (Leavy et al., 1982) shows an area of elevated uranium levels extending through Somerset and Barboursville, between Hardwick and Cowherd mountains. Uranium levels up to six times the regional average that were found in this area attracted exploration activity, and before the moratorium on uranium mining was enacted, some 2,000 acres in Orange County was under lease to uranium exploration companies. Some of these anomalies are the result of radioactive components brought in by fertilizer, but most of the high anomalies south of Herndon are in red-brown silt-stone (Leavy et al., 1982). Austin and D’Andrea (1978) suggest that the fluvial
_________________
1Presentation by J. Beard, Virginia Museum of Natural History, to the committee in Richmond, February 7, 2011.
rocks of the Triassic-Jurassic Culpeper/Barboursville Basin lack the requisite permeability to have acted as hosts for uranium deposits. Most of the sandstones and conglomerates contain a large amount of silt- and clay-sized material, which results in extremely low permeability.
There appears little likelihood that economic uranium deposits associated with these sandstones will be discovered in the foreseeable future. The Pennsylvanian and Mississippian sandstones have been extensively drilled and mined for coal without the discovery of significant uranium mineralization, and the Triassic basin in Virginia does not appear to contain suitable lithologies. Consequently, the use of ISL/ISR technology to mine sandstone-hosted uranium deposits in Virginia is unlikely in the foreseeable future.
Comparable uranium deposits. Roll-front-type deposits in Wyoming (Finch, 1996) represent equivalents of deposits that may occur in Pennsylvanian, Mississippian, or Triassic sandstones. Carboniferous sandstones in the Arlit area of Niger, belonging to the tectonolithologic category of uranium deposits, may also have some similarities to the continental sandstones in Virginia. They contain more than 150,000 tU at grades of 0.2 to 0.5 percent. The climatic conditions in this area are extremely arid, with high average temperature and extremely low rainfall.
Hydrothermal Metasomatic Deposits Associated with Alkali Metasomatism (Type 6A)
The Coles Hill deposit, located in the Pittsylvania County, occurs within a fault-bounded wedge of the sheared and highly potassic calcalkaline Leatherwood Granite (Figures 3.13, 3.14), along the Chatham Fault Zone at the northwest margin of the Triassic age Danville Basin (Jerden, 2001). The Leatherwood Granite, a component of the Martinsville Igneous Complex, was emplaced during the Late Ordovician (~442 Ma) in the Chopawamsic Volcanic Belt (Figure 3.5). Amphibolite layers are common within the granite. The deposit is partly covered by Danville Basin sedimentary rocks (Figure 3.13). The mineralized orebodies are characterized by intense sodium metasomatic alteration associated with quartz dissolution. The ore deposit is mainly contained within two approximately 350-m-long and 250-m-wide cylindrical bodies, within which the orebodies form lenticular layers below the Chatham Fault Zone (Figure 3.14).
The enclosing rocks are dominantly granitoids, with ~30 percent quartz by volume. The mineralized rocks and their alteration envelope are poor in quartz because the hydrothermal processes associated with the genesis of the deposit lead to nearly complete quartz leaching and albitization of these rocks.
Uraninite and coffinite are the main ore minerals—these are easy to leach, but they are hosted by a hard rock (Figure 3.15) that is difficult to crush. The Coles Hill ore contains high concentrations of phosphorus, with most ore grade samples ranging from 1 to 9 weight percent P2O5, but the concentrations of other trace elements are similar to those of the enclosing granitic gneisses (Jerden,

FIGURE 3.13 Geological map and cross section of the Coles Hill region in Pittsylvania County showing the location of the Coles Hill deposit hosted by deformed granitic rocks (augen gneisses and mylonites) of the Leatherwood Granite, west of the Chatham Fault Zone and underlying the Danville Triassic Basin. SOURCE: Jerden (2001).
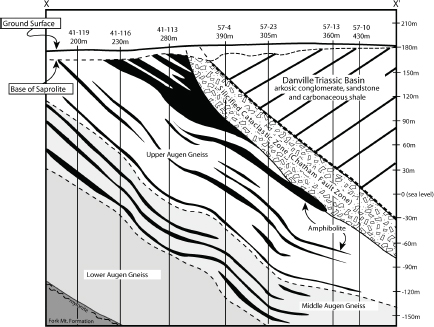
FIGURE 3.14 Detailed geological cross section of the Coles Hill area constructed from Marline Uranium Corporation drill hole data (Marline Uranium Corporation, 1983). Vertical holes drilled within the plane of the cross section are shown as solid lines and are identified by well number and total well depth. SOURCE: Jerden (2001).
2001). Because of the abundance of feldspars and carbonates, extraction of uranium by an alkali leach process may be needed, but acid leaching would also need to be considered.
The Coles Hill deposit contains significant uranium resources at grades comparable to average grades for uranium deposits worldwide, and the main uranium-bearing minerals are easily leachable in acidic or alkaline solutions. Resource calculations for this deposit are shown in Table 3.2.
Comparable uranium deposits. The Cachoera deposit at Lagoa Real in Brazil (Cuney and Kyser, 2008) and the Novokonstantinovka deposit of the Central Ukraine district (Cuney et al., 2012) are both being mined at present, with production rates of several hundreds of tonnes of uranium per year and resources of several hundreds of thousands of tonnes of uranium. The Cachoera deposit in Brazil is an open-pit mine at present, and underground workings are being developed. The mine has been developed recently (<10 years) and therefore uses the best practices for uranium mining and ore processing.
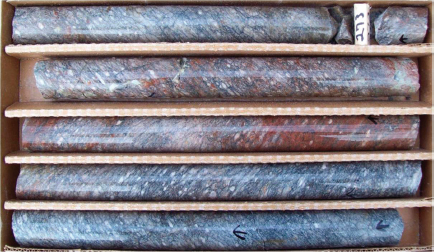
FIGURE 3.15 Drill core from the Leatherwood Granite showing highly sheared and mineralized granite. The average U3O8 percentage in this 10-foot core section is 0.679 percent. SOURCE: Wales (2010).
TABLE 3.2 Uranium Resources of the Cole Hill Deposits
|
|
Measureda |
Indicateda |
Totala |
||||||
|
Cutoff |
|
% |
Poundsd |
|
% |
Poundsd |
|
% |
Poundsd |
|
% U3O8 |
Tonsb |
U3O8c |
U3O8 |
Tonsb |
U3O8c |
U3O8 |
Tonsb |
U3O8c |
U3O8 |
|
0.100 |
0.755 |
0.228 |
3.45 |
6.27 |
0.215 |
26.9 |
7.03 |
0.216 |
30.4 |
|
0.075 |
1.35 |
0.164 |
4.44 |
24.0 |
0.116 |
55.9 |
25.4 |
0.119 |
60.4 |
|
0.050 |
2.28 |
0.124 |
5.65 |
35.4 |
0.101 |
71.7 |
37.7 |
0.103 |
77.4 |
|
0.025 |
6.62 |
0.064 |
8.42 |
92.1 |
0.060 |
111.0 |
98.7 |
0.060 |
119.0 |
aTotal tonnage above cutoff grade and average weight % U3O8 of that tonnage.
bMillions of short tons based on a rock density of 2.56 g/cc.
cWeight %.
dMillions of pounds in place.
SOURCE: NI 43-101 compliant resource estimates prepared by Behre Dolbear and Marshall Miller and Associates, Inc., April 2009 (Available at http://www.santoy.ca/s/ColesHill.asp; accessed August 11, 2011).
URANIUM RESOURCES, RESERVES, AND MARKETS
The global uranium market and uranium prices reflect the fluctuating balance between the demand for uranium for nuclear power generation, and the production from mining/processing and from additional sources such as recycling spent fuel and reprocessing highly enriched uranium and plutonium from decommissioned
nuclear weapons. The global uranium market in the broadest sense consists of uranium resources and reserves, demand for uranium, and uranium production. The United States has the greatest number of nuclear reactors in the world at present, and therefore the greatest demand for nuclear fuel. However, in 2010 the U.S. domestic uranium mining industry only produced 1,660 metric tonnes (tU) of the 18,376 tU needed to operate the 104 nuclear power plants across the nation, amounting to a domestic deficit of approximately 16,716 tU (~90 percent deficit) (WNA, 2011d). Although this deficit is filled at present by uranium imports and by dilution (downblending) of uranium recovered from nuclear warheads (see below). However, with the cessation of the downblending program in 2013, and increased demands for fuel for the more than 60 new nuclear reactors under construction worldwide, additional demand will be placed on the uranium market (WNA, 2011d).
Uranium Demand
Demand for uranium is driven by the electric power industry’s need for fuel for nuclear power generation facilities; in 2009, 435 commercial nuclear reactors were connected to the worldwide electric grid in the 30 countries with nuclear power generation, and another 63 reactors are under construction (WNA, 2011c). In 2011, these reactors will require 81,134 short tons of U3O8 concentrate (yellowcake), equivalent to 68,971 tU, to generate 375 Gigawatts (GWe) of net generation capacity. The Nuclear Energy Agency (NEA) and International Atomic Energy Agency (IAEA) project demand out to 2035, with both low- and high-demand scenarios. The low-demand projection is for 511 GWe, a 37 percent increase compared with 2008 demand. The high-demand scenario projects a nuclear power generation demand for 782 GWe, a 110 percent increase (NEA/IAEA, 2010).
In 2011, the United States will require 18,376 tU of U3O8 concentrate (20,256 short tons) to fuel the nation’s 104 operating nuclear reactors (WNA, 2011c), accounting for 20 percent of U.S. electricity generation (USEIA, 2011c). As of December 2009, the United States had one reactor under construction, 11 planned, and 19 proposed, equivalent to approximately 40 GWe of new capacity (WNA, 2011a). Projections by the NEA/IAEA show a range from modest (low-demand scenario) to dramatic (high-demand scenario) increased demands by U.S. nuclear power generation facilities for U3O8 fuel (NEA/IAEA, 2010) (Figure 3.16).
Uranium Resources
In the United States, reserves of uranium are defined by the U.S. Department of Energy’s Energy Information Administration (USEIA) as “estimated quantities of uranium in known mineral deposits of such size, grade, and configuration
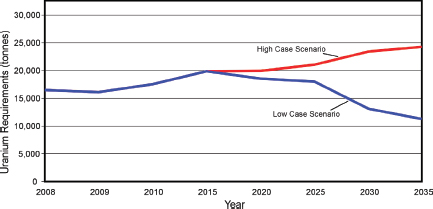
FIGURE 3.16 Projections for U.S. uranium requirements to fuel nuclear reactors through 2035. SOURCE: Compiled from data in NEA/IAEA (2010).
that the uranium could be recovered at or below a specified production cost with currently proven mining and processing technology and under current law and regulations.”2 The U.S. Securities and Exchange Commission (SEC) regulates public disclosure of exploration results and the definition of mineral resource and reserve estimates (Box 3.2).3 The SEC defines a reserve as a “mineral deposit which could be economically and legally extracted or produced at the time of the reserve determination.” Internationally, the IAEA and Nuclear Energy Agency (NEA) define resources based on differing levels of certainty—Identified Resources, which include Reasonably Assured Resources (RAR) and Inferred Resources (EAR), as well as Undiscovered Resources which include Prognosticated Resources (PR) and Speculative Resources (SR).
The NEA/IAEA compilation (NEA/IAEA, 2010) for worldwide uranium resources in a range of resource categories for different cost ranges is presented in Table 3.3, and the RARs in the United States are shown in Table 3.4.
For RAR, WNA estimated that the nuclear energy’s fuel supply infrastructure should be able to meet world demand in the short term, but expansion will be needed across the entire fuel cycle beyond 2020 (Figure 3.18) (WNA, 2009).
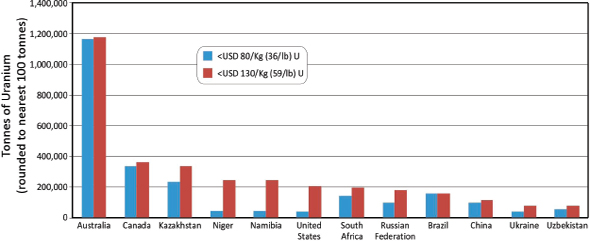
When considered on a country-by-country basis, three countries—Australia, Kazakhstan, and Canada—contain 52 percent of the world’s Identified Resources of uranium at the < $130/kg cost point (NEA/IAEA, 2010), corresponding to 2,810,100 tonnes (3,097,605 short tons). However, a substantial component of these resources are contained in the giant Olympic Dam deposit in Australia
_________________
2 EIA Glossary; see http://www.eia.gov/tools/glossary/index.cfm; accessed September 2011.
3http://www.sec.gov/about/forms/industryguides.pdf; accessed December 2011.
BOX 3.2
International Guidelines for Defining Mineral Resources
The U.S. guidelines for defining mineral materials, such as uranium, differ from other international guidelines and standards. The U.S. Securities and Exchange Commission (SEC) regulates the disclosure of exploration results and the definition of mineralized materials and reserves under its Industry Guide 7 criteria.a The Canadian Securities Administrators have a different mineral resource classification system—the National Instrument 43-101 (NI 43-101).b Australasia adheres to the JORC (Joint Ore Reserves Committee) Code, and compliance is mandatory for companies listed on the Australian Stock Exchange. The Canadian NI 43-101 and JORC Code are similar, as they generally follow international guidelines set by the Committee for Mineral Reserves International Reporting Standards (CRIRSCO),c whereas the SEC guidelines differ from the NI 43-101 and JORC guidelines in some key areas.
In the late 1990s, CRIRSCO developed an International Framework Classification for Mineral Reserves and Mineral Resources. This committee included representatives from Australasia, Canada, Chile, Europe, and the United States. CRIRSCO defined mineral resources and reserves and their respective subcategories, Measured, Indicated, and Inferred Resources, and Proved and Probable Reserves (Figure 3.17). Following the CRIRSCO Agreement, the U.S. Society for Mining, Metallurgy, and Exploration (SME) released guidelines in 1999 (as did equivalent Canadian and Australasian organizations). However, The United States was the one CRIRSCO country whose regulator—the SEC—did not recognize the SME reporting standard and thus the CRIRSCO agreement guidelines.
Instead, the SEC published its own guidelines, delineated in its Industry Guide 7, “Description of Property by Issuers Engaged or to Be Engaged in Significant Mining Operations.” The main differences between the SEC and CRIRSCO guidelines are that the SEC has (1) a requirement of a standardized price based on the prevailing 3 years; (2) a restriction on the disclosure of proved and probable mineral reserves while other mineralized material is permitted (note that “mineralized material” is not clearly defined in the SEC guidelines); (3) a definition of a reserve as a “part of a mineral deposit which could be economically and legally extracted or produced at the time of the reserve determination” d; and (4) no clear
where the primary production is copper from a hydrothermal orebody, with subsidiary production of uranium, gold, and silver. The dominating effect of the Olympic Dam and other Australian uranium resources are also reflected in RAR comparisons (Figure 3.19).
Annual, worldwide requirements for fuel for existing power reactors amounts to about 67,000 tU. The world’s presently known Identified Resources of uranium, exploitable at or below $80 per kilogram of uranium, are some 3.75 million tonnes (Table 3.3) (NEA/IAEA, 2010). Existing known identified resources, based on present-day reactor technologies and if the resources are developed, are
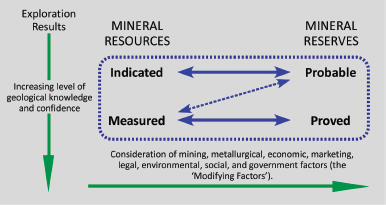
FIGURE 3.17 Mineral resource and reserve flow diagram. Certainty is improved moving down and to the right. SOURCE: Courtesy of Committee for Mineral Reserves International Reporting Standards.
requirement for a competent person to define the resource/reserve. Although there have been discussions between SME and SEC regarding the adoption in the United States of the internationally standardized set of guidelines, at present the Industry Guide 7 remains in effect for public reporting of mineralized materials and reserves.
_________________
ahttp://www.sec.gov/about/forms/industryguides.pdf.
bhttp://www.cim.org/committees/NI_43-101_Dec_30.pdf.
sufficient to last for more than 50 years at today’s rate of usage—a figure higher than for many widely used metals. However for these resources to be developed, a range of challenges will have to be addressed:
• Financial. For example, Australia has by far the largest RAR of uranium in the world (Figure 3.19), but a large part correspond to the huge Olympic Dam deposit where uranium production is relatively small (about 4,000 tU) because it is tied to the production of copper and gold. The grade of the deposit (about 250 ppm U) does not permit uranium to be mined for its own value. A four- to
TABLE 3.3 Worldwide Uranium Resource Quantities for Different Production Cost Ranges and Different Degrees of Confidence, as of January 2009
| Cost | Identified Resources (RAR + Inferred Resources) | Reasonably Assured Resources | Inferred Resources | ||||
| short tons | tonnes | short tons | tonnes | short tons | tonnes | ||
| <$18/lb U | <$40/kg U | 877,881 | 796,400 | 628,207 | 569,900 | 249,784 | 226,600 |
| <$36/lb U | <$80/kg U | 4,124,739 | 3,741,900 | 2,773,525 | 2,516,100 | 1,351,213 | 1,225,800 |
| <$59/lb U | <$130/kg U | 5,956,890 | 5,404,000 | 3,885,537 | 3,524,900 | 2,071,353 | 1,879,100 |
| <$118/lb U | <$260/kg U | 6,951,506 | 6,306,300 | 4,414,206 | 4,004,500 | 2,537,300 | 2,301,800 |
SOURCE: NEA/IAEA (2010).
TABLE 3.4 U.S. Uranium Resources in the Reasonably Assured Resources Category for Different Cost Ranges, as of January 2009
| Cost | Reasonably Assured Resources | ||
| $/lb U | $/kg U | short tons | tonnes |
| <18 | <40 | 0 | 0 |
| <36 | <80 | 42,990 | 39,000 |
| <59 | <130 | 228,619 | 207,400 |
| <118 | <260 | 520,401 | 472,100 |
SOURCE: NEA/IAEA (2010).
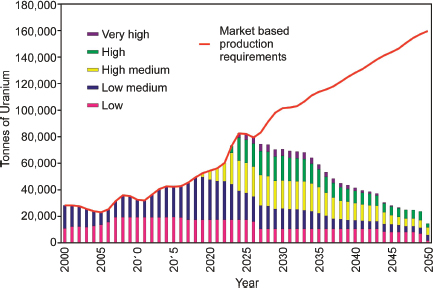
FIGURE 3.18 Increased cost of uranium production over time that will be required to meet projected increases in demand. SOURCE: Modified from IAEA (2001).
fivefold increase in uranium production from the Olympic Dam deposit will require an investment of about 15 billion Australian dollars.
• Technical. Development of improved or new ore processing methodologies will be required for production of uranium from complex ores (e.g., extraction of uranium from phosphates, from refractory minerals in deposits associated with peralkaline rocks).
• Political. Some countries or provinces have established bans on uranium exploration and mining.
• Security. Development of uranium mines in Niger is currently hampered by security issues in the northern part of the country.
• Development duration. The time for development of a mine from the beginning of exploration until initial production has been steadily increasing (now averaging about 15 years). This problem is particularly sensitive at present because of several issues: After nearly 20 years of extremely low exploration rates all over the world and with widespread exploration only restarting since 2004, a new generation of geologists specializing in uranium exploration, as well as mining and metallurgical engineers specializing in uranium processing, will need to be educated; and tighter regulations for uranium mining have considerably increased the duration for the licensing of the new uranium mines.
• Economics. Because of the present economic crisis, uranium spot prices are decreasing and fluctuating while the price of uranium production is continuously increasing.
Uranium Production
Uranium supply is partly from production of new ore from mining, and partly from secondary sources of already mined uranium. World uranium production in 2009 fulfilled 74 percent of world reactor requirements (57,061 short tons of U3O8 or 43,880 tU) out of the total requirement for 59,065 tU (76,808 short tons) of U3O8. The remaining 26 percent came from secondary sources such as existing stockpiles held by government and commercial entities, low enriched uranium from downblending of highly enriched uranium recovered from nuclear warheads (“Megatons to Megawatts”), and reenrichment of depleted uranium tails and spent fuel reprocessing (NEA/IAEA, 2010). Highly enriched uranium is about 97 percent 235U and has to be diluted about 25:1 with depleted uranium (or 30:1 with enriched depleted uranium) to reduce it to about 4 percent 235U for use in power reactors. From 1999 to 2013, when the program is projected to end, the dilution of 30 tonnes of highly enriched uranium is displacing about 9,000 tU mine production per year (NEA/IAEA, 2010).
In the United States and Canada, the nuclear fuel cycle is an “open” or “once-through” system where spent nuclear fuel is not reprocessed. In France, Japan, and a few other countries, a “closed” fuel cycle is used. In a closed fuel cycle, the spent nuclear fuel is sent to reprocessing operations for the separation of waste products so that the plutonium and uranium can be used as recycled fuel in reactors (Dyck and Crijns, 2011). Reprocessed uranium from spent nuclear fuel accounts for approximately 2,000 to 2,500 tonnes (or 3.3 to 4.2 percent) displacement of natural uranium from mines (IAEA, 2007). There are no U.S. reprocessing plants currently in operation, and the one facility in Savannah River, South Carolina, is years away from completed licensing by the U.S. Nuclear Regulatory Commission (USNRC, 2011). The main spent fuel reprocessing plants operate in France and (until August 2011) in the United Kingdom, with capacity of
over 4,000 tonnes of spent fuel per year. Russia, Japan, Belgium, Germany, and Switzerland also recycle plutonium for mixed oxide (MOX) fuel elements, but to a lesser extent. The plutonium for MOX fuel can be obtained from spent fuel rods (as is the case in France) or from weapons-grade surpluses (as is the case in a possible U.S. MOX fuel scenario). About 200 tonnes of MOX are used each year, equivalent to about 1,700 tU from mines.
Although uranium was produced in 20 countries in 2010, eight countries (Kazakhstan 33 percent, Canada 18 percent, Australia 11 percent, Namibia 8 percent, Niger 8 percent, Russia 7 percent, Uzbekistan 4 percent, and the United States 3 percent) account for more than 92 percent of the world’s uranium production. Only two countries—Canada and South Africa—produce enough uranium to meet domestic demand; conversely, other countries having no nuclear power generation capacity produce substantial quantities of uranium.
Overall, world uranium primary production increased steadily for the decade to 2009 (Figure 3.20; Table 3.5), with Kazakhstan, Namibia, Australia, Russia, and Brazil showing marked increases between 2006 and 2009 to offset decreased production in Canada, Niger, the United States, and the Czech Republic (NEA/IAEA, 2010). In North America, production is dominated by Canada, which produced 8,500 tU in 2008.
In the United States, uranium was produced at six locations in the third quarter of 2011. White Mesa Mill, near Blanding, Utah, is the only conventional uranium processing facility currently operating in the United States, processing
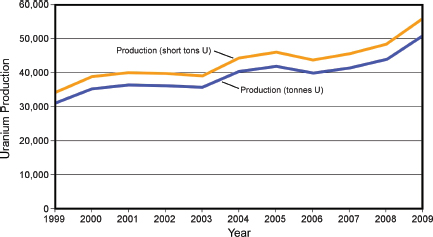
FIGURE 3.20 Production of uranium worldwide in metric tonnes and short tons from 1999 to 2009. SOURCE: WNA (2011b).
TABLE 3.5 Production of Uranium in Tonnes of U3O8 from Mines Between 2003 and 2010
|
Country |
2003 |
2004 |
2005 |
2006 |
2007 |
2008 |
2009 |
2010 |
|
Kazakhstan |
3,300 |
3,719 |
4,357 |
5,279 |
6,637 |
8,521 |
14,020 |
17,803 |
|
Canada |
10,457 |
11,597 |
11,628 |
9,862 |
9,476 |
9,000 |
10,173 |
9,783 |
|
Australia |
7,572 |
8,982 |
9,516 |
7,593 |
8,611 |
8,430 |
7,982 |
5,900 |
|
Namibia |
2,036 |
3,038 |
3,147 |
3,067 |
2,879 |
4,366 |
4,626 |
4,496 |
|
Niger |
3,143 |
3,282 |
3,093 |
3,434 |
3,153 |
3,032 |
3,243 |
4,198 |
|
Russia |
3,150 |
3,200 |
3,431 |
3,262 |
3,413 |
3,521 |
3,564 |
3,562 |
|
Uzbekistan |
1,598 |
2,016 |
2,300 |
2,260 |
2,320 |
2,338 |
2,429 |
2,400 |
|
USA |
779 |
878 |
1,039 |
1,672 |
1,654 |
1,430 |
1,453 |
1,660 |
|
Ukraine (est) |
800 |
800 |
800 |
800 |
846 |
800 |
840 |
850 |
|
China (est) |
750 |
750 |
750 |
750 |
712 |
769 |
750 |
827 |
|
Malawi |
— |
— |
— |
— |
— |
— |
104 |
670 |
|
South Africa |
758 |
755 |
674 |
534 |
539 |
655 |
563 |
583 |
|
India (est) |
230 |
230 |
230 |
177 |
270 |
271 |
290 |
400 |
|
Czech Repub. |
452 |
412 |
408 |
359 |
306 |
263 |
258 |
254 |
|
Brazil |
310 |
300 |
110 |
190 |
299 |
330 |
345 |
148 |
|
Romania (est) |
90 |
90 |
90 |
90 |
77 |
77 |
75 |
77 |
|
Pakistan (est) |
45 |
45 |
45 |
45 |
45 |
45 |
50 |
45 |
|
France |
0 |
7 |
7 |
5 |
4 |
5 |
8 |
7 |
|
Germany |
104 |
77 |
94 |
65 |
41 |
0 |
0 |
0 |
|
Total world |
35,574 |
40,178 |
41,719 |
39,444 |
41,282 |
43,853 |
50,772 |
53,663 |
|
Tonnes U3O8 |
41,944 |
47,382 |
49,199 |
46,516 |
48,683 |
51,716 |
59,875 |
63,285 |
|
Percentage of world demand |
65 |
63 |
64 |
68 |
78 |
78 |
||
NOTE; 1 tonne of uranium = 1.1792 tonnes of U3O8. Estimated production for those countries that do not provide precise numbers to the IAEA are indicated by “est.”
SOURCE: WNA (2011d).
ore from mines in Colorado, Utah, and Arizona.4 There are currently six ISL/ISR operations in the United States—the Alta Mesa Project and the Hobson ISR Plant/La Palangana operation in Texas; the Crow Butte operation in Nebraska; and the Smith Ranch-Highland Operation and the Willow Creek Project in Wyoming (USEIA, 2011b).5 U.S. production increased markedly from 2003 to 2006 (Figure 3.21), but then slowed because of operational challenges and lower uranium prices with total production in 2008 of 1,492 tU (1,910 short tons); by 2010 production had risen to 1,921 tU (2,119 short tons) (USEIA, 2011a; NEA/IAEA, 2010).
Uranium Prices
All mineral commodity markets tend to be cyclical, with sharp price rises and falls as a result of demand variability and perceptions of scarcity. The history of uranium price fluctuations has to be considered in two different periods. Before the 1970s, uranium prices were not controlled by the open market like other resources because the predominant use was by the military for nuclear weapons. As a result, uranium deposits were mined during this time without the economic costs of production being the top priority and with little consideration of the risks associated with uranium mining.
From the early 1980s, uranium prices have essentially followed the fluctuations of oil prices (Figure 3.22). The 1970s’ oil crises led to a sharp increase of uranium prices in the mid-1970s. Then, as oil prices declined in the early eighties, there were depressed uranium prices for the 1980s and 1990s with spot prices well below the cost of production for most uranium mines. The Chernobyl nuclear accident in 1986 occurred during a period of continuous uranium price decline, and does not seem to have had a significant impact on uranium prices. During this time, the uranium market was dominated by the liquidation of inventories—both commercial and military—and by the low oil prices. As a result, the uranium price was depressed and production and exploration efforts were cut back.
Spot uranium prices started to recover strongly late in 2003, coinciding with increased oil prices and dramatic increases in the demand for nuclear energy emerging from China, India, and Russia. Uranium prices reached a maximum during the summer of 2007, in part because of speculation. The economic crisis beginning in September 2007 again led to a decline of oil and uranium prices, but then oil and uranium prices slowly increased again until the Fukushima accident in Japan. Since the Fukushima accident, uranium prices have slowly declined from a maximum of $73 down to $49 per pound at the beginning of September 2011, although they had risen to $54 per pound 2 weeks later. The share prices of
_________________
4Additional information on the White Mesa uranium mill and Dennison Mine operations is available at http://www.denisonmines.com/Document/Details/121; accessed December 2011.
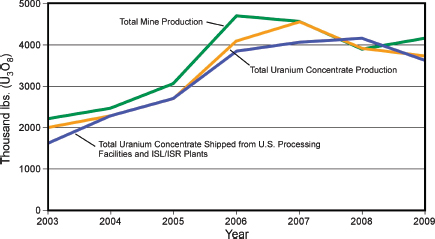
FIGURE 3.21 U.S. uranium production data for 2004-2009, with estimated data for 2003. SOURCE: USEIA (2011a).
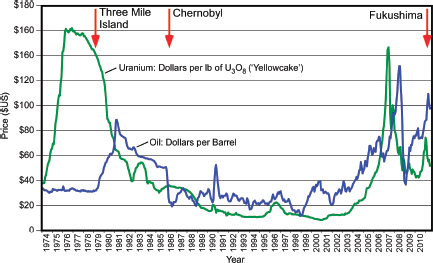
FIGURE 3.22 History of monthly inflation-adjusted spot uranium prices and oil prices from 1974 to 2011, together with the major accidents at nuclear power plants. SOURCES: TradeTech (uranium) and U.S. Energy Information Administration (oil); inflation adjustment from U.S. Department of Labor’s Bureau of Labor Statistics.
smaller uranium companies have also been affected negatively by the Fukishima accident—with an average stock decline of 40 percent—because they are dependent on capital markets to raise money to explore for new deposits. The long-term price of uranium has been less affected, with a decline from pre-Fukushima levels of $70-$73 per pound down to $68 per pound. Short-term growth of the nuclear industry has continued—there were 62 reactors under construction worldwide before the Fukushima accident and there are still the same 62 reactors under construction today. In addition, there have been no reports of operating uranium mines shutting down. Germany has announced a decision to phase out its reliance on nuclear power by 2022, but this decision is very recent and there is uncertainty as to whether Germany will be able to maintain it in the future. For example, Sweden announced in 1980 that it would phase out nuclear energy, but changed its decision in 1997; and Germany’s decision in 2000 to phase out the use of nuclear energy was initially delayed in 2010.
According to WNA (2011a), it is still too early to assess the full impact of the Fukushima accident on the world nuclear fuel market. Despite the permanent closure of a number of reactors in Japan and Germany and slowdowns in some programs in response to Fukushima, the WNA report notes that the global situation for energy supply and demand remains effectively unchanged. Prospects for new nuclear facilities remain strong in China, India, South Korea, and the United Kingdom, and developments in the United States, China, India, and Russia will remain particularly crucial in determining nuclear’s overall role in global electricity supply.
Uranium does not trade on an open market like other commodities. Buyers (states or utilities) and sellers (states or mining companies) negotiate contracts privately and confidentially. Spot uranium prices—usually representing less than 20 percent of supply—are published by the independent market consultants Ux Consulting and TradeTech (e.g., Figure 3.22). Most trade is by 3- to 15-year term contracts with producers selling directly to utilities, although the price in these contracts is often related to the spot price at the time of delivery.
Presently, about 435 reactors with a combined capacity of over 370 GWe require 65,500 tU (77,000 tonnes U3O8). Each GWe of increased capacity requires 400 to 600 tU for the first fuel load, followed by about 200 tU per year. The capacity is growing slowly, and the reactors are being run more efficiently. Also, many utilities are increasing the initial enrichment of their fuel (e.g., from 3.3 percent to more than 4.0 percent 235U), and then burning it longer or harder to have only 0.5 percent 235U left in the spent fuel (instead of 0.8 percent or more). As a consequence of increased efficiency, over the 20 years from 1970 there was a 25 percent reduction in uranium demand per kilowatt-hour output in Europe.
The committee’s analysis of the distribution of uranium deposits in Virginia and worldwide, and uranium markets and reserves, has produced the following findings:
Uranium deposits are formed by a wide variety of geological processes and in a wide range of geological environments. Of the localities in Virginia where existing exploration data indicate that there are significant uranium occurrences, predominantly in the Blue Ridge and Piedmont geological terrains, only the deposits at Coles Hill in Pittsylvania County appear to be potentially economically viable at present. The resources and grades of the Coles Hill deposits appear comparable to deposits that are being mined elsewhere in the world.
Because of their geological characteristics, none of the known uranium occurrences in Virginia would be suitable for the in situ leaching/in situ recovery (ISL/ISR) uranium mining/processing technique. ISL/ISR mining requires specific hydrological and geological characteristics, with porous mineral-bearing rocks enclosed by relatively impermeable surfaces.
In 2008, uranium was produced in 20 countries; however, more than 92 percent of the world’s uranium production came from only eight countries (Kazakhstan, Canada, Australia, Namibia, Niger, Russia, Uzbekistan, and the United States).
In general, uranium price trends since the early 1980s have closely tracked oil price trends. The Chernobyl (Ukraine) nuclear accident in 1986 did not have a significant impact on uranium prices, and it is too early to know the long-term uranium demand and price effects of the Fukushima (Japan) accident.
Existing known identified resources of uranium worldwide, based on present-day reactor technologies and assuming that the resources are developed, are sufficient to last for more than 50 years at today’s rate of usage.


