
Exploring the Budgeting Problem
As noted in Chapter 1, the committee’s first task was to try to determine why annual funding requests from the U.S. Department of Justice (DOJ) have repeatedly turned out to be inadequate. The answer proved to be more complicated than many may suppose.
The accuracy and timeliness of budget estimates—originally prepared up to 2 years in advance of the fiscal year for which appropriations are made—are affected by all the usual limitations of any financial forecast and by some limitations specific to estimating resource needs for immigration enforcement.
Any budget estimation is subject to errors caused by imperfect information about the future. Already observable influences on resource requirements may have lagged effects that are hard to estimate. For partly demand-driven services, such as detaining and processing persons apprehended as alleged illegal immigrants, the services demanded may be subject to rapid, unpredictable changes. An example would be an unexpected surge of illegal immigration, leading to more apprehensions of persons identified as illegal entrants, leading to subsequent increases in demand for the services of U.S. marshals and U.S. attorneys, additional hearings before immigration judges, additional pretrial detention facilities for those charged with felonies, and more occupants of federal prisons. The factors determining fluctuations in illegal entry, such as changes in
economic conditions, are not fully understood and cannot be forecast. Other sources of demand may be predictable, such as the introduction of new technology to aid in detection and personal identification, changes in policy that increase the personal costs of apprehension, or new patrolling or other tactics that contribute to a higher number of apprehensions. All can contribute to increased demand for DOJ enforcement-related services.
Workload Hypothesis
A reasonable hypothesis on which budget estimates might be based is that when resources are increased for efforts to detect and apprehend illegal immigrants—either as they enter the United States or through enforcement efforts such as checks on the status of workers or of people taken into custody for other reasons—the result will be, with some time lag, increased numbers of people who are subject to legal procedures. Those legal procedures range from review of status, to felony prosecution and pretrial detention and transport, to sentencing to federal prison. Higher volumes at the “front end,” when the U.S. Department of Homeland Security (DHS) has responsibility, may lead to higher volumes later at the “back end,” when DOJ has responsibility.
We can examine this hypothesis in light of recent trends. Since its establishment, DHS has received large increases in its immigration enforcement budgets, especially for the Customs and Border Protection (CPB) service; see Figure 2-1. CPB’s functions include not only immigration enforcement, but also other enforcement related to control of the movement of goods and of illicit products including illegal drugs. In addition to the near doubling of the agency’s budget between 2004 and 2010, the then-separate Customs and Border Patrol agencies had received substantial funding increases in the decade prior to DHS’s creation.
Contrary to the committee’s hypothesis, above, during the fiscal 2004-2010 period the budget increases for DHS enforcement were accompanied not by increases in the number of people apprehended as illegal entrants but by a sharp drop in those numbers; see Figure 2-2.1 This trend might be partly a result of more effective interdiction that in turn resulted in fewer initial or repeated attempts to enter the United States illegally. Or it might reflect changes in economic and social conditions on either side of the border and other factors that led to fewer attempts to enter the country.
![]()
1The counts of deportable aliens located do not include significant numbers apprehended at ports of entry by U.S. Customs officials or apprehended by nonfederal law enforcement agencies and subsequently removed by DHS’s Immigration and Customs Enforcement (ICE) agency. The excluded numbers might make an important difference in the time trends shown; this data issue is discussed in Chapter 4.
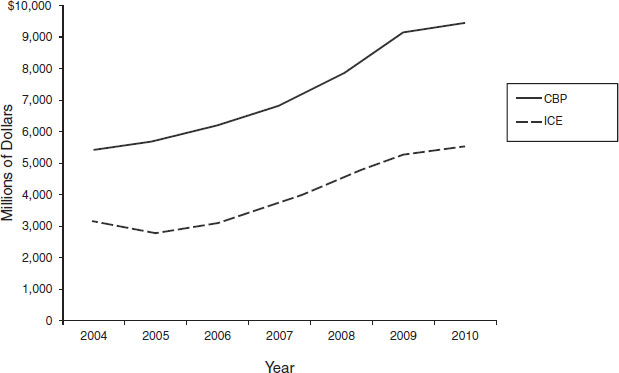
FIGURE 2-1 Net budget outlays for Customs and Border Protection and Immigration and Customs Enforcement agencies.
NOTES: CBP = Customs and Border Protection, ICE = Immigration and Customs Enforcement.
SOURCES: Data from U.S. Office of Management and Budget (2005, 2006, 2007, 2008, 2009, 2010, 2011).
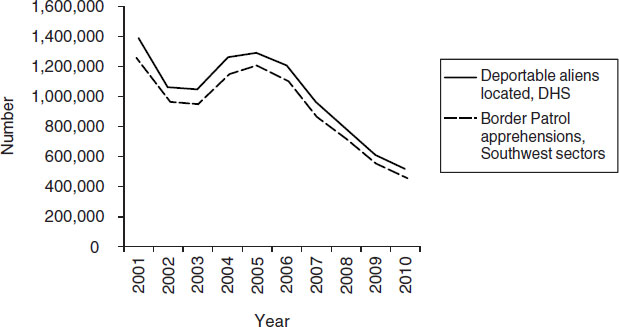
FIGURE 2-2 Deportable aliens located and Border Patrol apprehensions.
NOTE: DHS = U.S. Department of Homeland Security.
SOURCE: Data from U.S. Department of Homeland Security (2011d).
A drop in apprehensions accompanied by more spending to interdict and arrest illegal residents will naturally cause the cost per apprehension to rise, even if it may increase deterrence. The combination of higher spending and fewer apprehensions after 2000 means that average DHS spending for each deportable alien located increased in just 5 years by more than 300 percent, from less than $8,000 per apprehension to nearly $28,000.
A lower volume of DHS apprehensions would seem to imply less demand for the enforcement-related functions performed by DOJ components such as the Office of Detention Trustee, U.S. marshals, immigration judges, U.S. attorneys, and the Bureau of Prisons. But, while apprehensions were declining, activity levels for other components of the enforcement system were either stable or rising; see Figure 2-3. These trends were largely the result of DHS-initiated emphasis on “enhanced consequences” for people who were apprehended. That is, a higher percentages of those apprehended were either brought before an immigration judge (a civil proceeding that leads in many cases to a removal order) or prosecuted in federal courts for immigration violations, which requires pretrial detention and involves more work for the U.S. marshals, U.S. attorneys, and
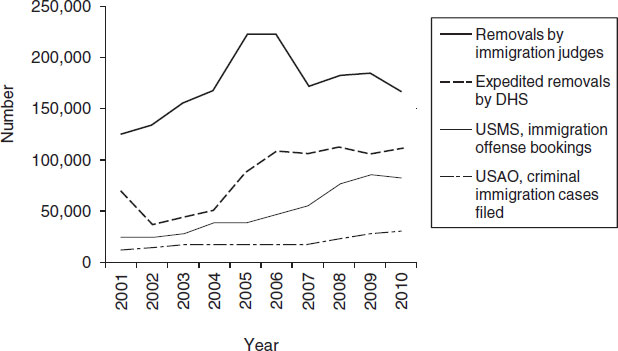
FIGURE 2-3 Trends in immigration enforcement activity.
NOTES: DHS = U.S. Department of Homeland Security, USAO = U.S. Attorney’s Office, USMS = U.S. Marshals Service.
SOURCES: Data from U.S. Department of Homeland Security (2011b); U.S. Department of Justice (2011a, 2011c); and U.S. Department of Justice, Justice Management Division (personal communication).
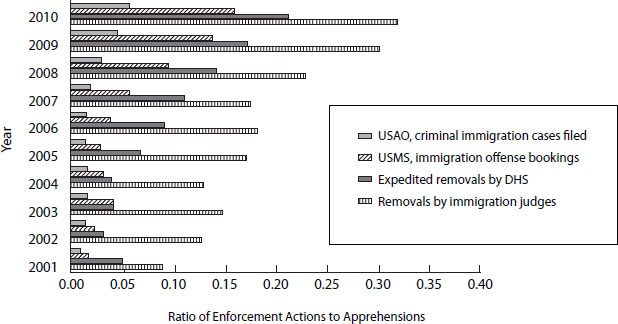
FIGURE 2-4 Ratios of enforcement activity to total suspected illegal aliens apprehended.
NOTES: The ratios are not exact measures of the proportions each year because there may be a significant time lag between apprehension and civil or criminal procedures and outcomes. As a result, enforcement activities may be recorded 1 or more years after apprehension. DHS = U.S. Department of Homeland Security, USAO = U.S. Attorney’s Office, USMS = U.S. Marshals Service. SOURCES: Data from U.S. Department of Homeland Security (2011b, 2011d); U.S. Department of Justice (2011a, 2011c); and U.S. Department of Justice, Justice Management Division (personal communication).
possibly the Bureau of Prisons. (See Chapter 4 for a more detailed description of the operation of the immigration enforcement system.)
The sharp rise since 2001 in the proportions of people apprehended as suspected illegal aliens subject to either civil or criminal processes is shown in Figure 2-4. Removals implemented administratively by DHS also have increased as a proportion of apprehensions from 5 percent or less prior to 2005 to more than 20 percent in 2010.2 In prior years, many more people were simply released at the border without further consequences rather than being subjected to civil or criminal processes.
Policy Effects
As detailed below, this recent change is part of a broader policy shift intended to increase the personal cost and sanctions for illegal entry,
![]()
2See note to Figure 2-4 on the possible effects of time lags on enforcements.
thus helping to deter future attempts. So, the potential demand for DOJ enforcement functions and resulting resource needs have not been a simple function of the number of apprehensions but, rather, a function of changes in policies and practices determining how those apprehended would be processed. So, for example, if policies to deter unauthorized immigration are effective, then the demand for DOJ services and budget resources may decline. Changes in policy and practice affecting DOJ’s components of the enforcement system are largely the responsibility of DHS, which may or may not take into account their implications for DOJ’s enforcement responsibilities.
The level of activity of the civil process to determine status of people charged as illegally in the United States can be measured by the number of cases completed annually by the immigration courts. This number increased from 2003 to 2010 by about 16 percent; see Figure 2-5. Criminal proceedings can be measured by the numbers of people booked by U.S. marshals for immigration offenses, including simple misdemeanor charges for border crossings and more serious felony charges. These bookings increased by more than 180 percent from 2003 to 2008 and remained at about that level for the following 2 years; see Figure 2-6.
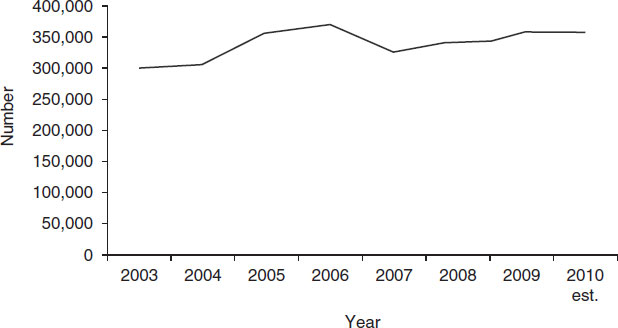
FIGURE 2-5 Immigration matters completed by the Executive Office for Immigration Review (EOIR).
SOURCES: Data from the U.S. Department of Justice (2011a) and U.S. Department of Justice, Justice Management Division (private communication).
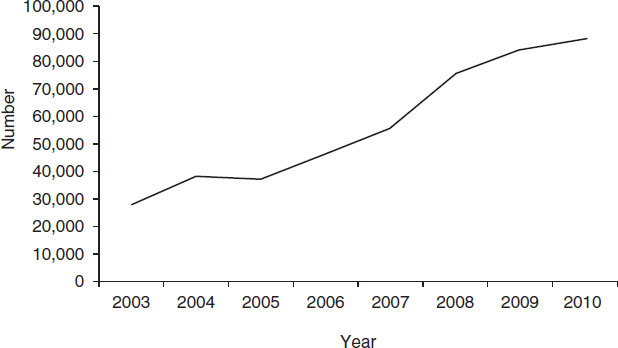
FIGURE 2-6 Persons booked by the U.S. Marshals Service for immigration offenses.
SOURCE: Data from the U.S. Department of Justice (2011c).
These data demonstrate that overall activity for the DOJ components of the immigration enforcement system—both civil and criminal— increased even as DHS apprehensions fell sharply. The increase in criminal immigration cases was most dramatic, imposing burdens not only on the Office of the Federal Detention Trustee (OFDT), U.S. marshals, and U.S. attorneys, but also on the federal courts, whose budget is separately appropriated.
Budgets for the DOJ components of the enforcement system were increasing over the same period as those for DHS, but not so dramatically. Annual budget authority provided for the Executive Office for Immigration Review (EOIR) increased almost 60 percent, from $188 million in 2003 to $298 million in 2010. For the same years, funds available for immigration-related expenses (based on the percentage of immigration-related detentions in the same years) of the OFDT (which also allocates funding for U.S. marshals) increased 250 percent, from $152 million to $541 million.
Agencies can respond to rising service demands not only by seeking budget increases, but also by adjusting how they use resources. In fact, we have observed that the administrative system responsible for immigration enforcement has flexibility at many points to adapt its administrative priorities and procedures to handle both surges in service demand and unexpected resource shortfalls. Often these decisions are made locally in
response to local conditions. Although this flexibility and adaptation make the system more resilient in the face of potential resource constraints, over time they complicate the task of estimating the “true” resource requirements to sustain operations. Thus, budget estimators have to predict not only demands generated by external factors and changes in national policies, but also how the components of the system in different regions will respond if resources are higher or lower than the demands seems to require. If they are interested also in performance, they also need to consider and estimate how differences in resources will affect enforcement.
Adjustments can affect cost per unit of service. For example, changes in the kinds of people referred for civil or criminal processing may affect the resources required if more detainees are charged with felony offenses rather than misdemeanor offenses. Such a change can result either from a change in the mix of people apprehended or changes in policies regarding how alleged offenses are handled. Changes in cost may result also from administrative changes, efficiencies arising from advances in technology or practice, or changes in staffing. As a result of these and other influences, the “efficiency” of the system as measured by average processing costs, may change over time.
Adjusting to Workload Changes
Up to a point, agencies can adjust to increased workload by finding ways to handle more cases with the same resources. In the face of higher demand for pretrial detention and related costs funded by OFDT, the average annual cost of those services remained about the same (adjusting for inflation), rising from less than $6,000 per detainee in 2004 to about $6,400 per detainee in 2009; see Figure 2-7. On the civil side, processing costs per case increased as EOIR’s spending per matter handled rose from slightly more than $600 per matter in 2003 to more than $800 in 2010; see Figure 2-8.
The adjustment for immigration judges was somewhat different. The ratio of immigration proceedings completed to the number of full-time equivalent immigration judges rose from fewer than 400 per judge in 2000-2003 to more than 600 per judge in 2008 and 2009. Even so, the number of cases pending before the immigration courts rose; see Figure 2-9. Further analysis might show in more detail how these and other components of the enforcement system have adjusted to increased demand by changing their methods of operation, mix of staffing, or use of technology. To appreciate the nature of the budgeting challenge, however, it is enough to recognize that many such adjustments occur.
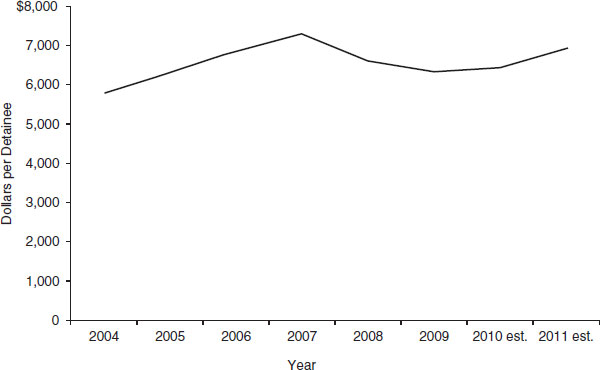
FIGURE 2-7 Cost per immigration detainee by the Office of the Federal Detention Trustee.
SOURCE: Data from the U.S. Department of Justice, Justice Management Division (personal communication).
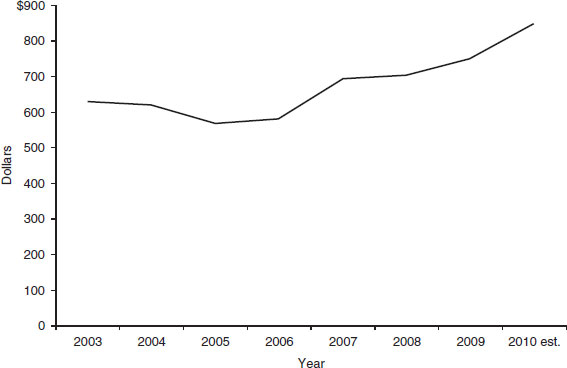
FIGURE 2-8 Budget obligations per immigration matter completed by the Executive Office for Immigration Review.
SOURCE: Data from the U.S. Department of Justice, Justice Management Division (personal communication).
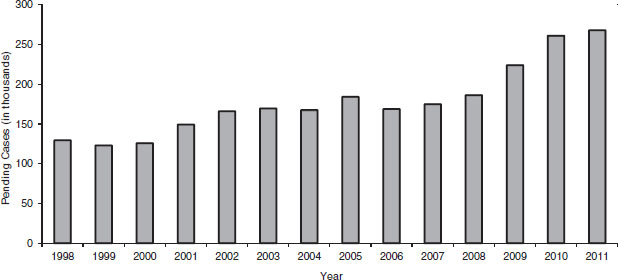
FIGURE 2-9 Cases pending before immigration courts.
SOURCE: Data for the Executive Office for Immigration Review are from the Transactional Records Access Clearinghouse (TRAC) at Syracuse University, as reported in Kerwin et al. (2011).
The Purpose of Budgeting
Taking a broader view of the purpose of budgeting, it is important to consider the combined effects of resource levels, policies, and system adjustments on what is accomplished, measured not just in terms of outputs (such as numbers of cases handled) but also in terms of the probable effectiveness of efforts to control illegal immigration. Although it is beyond the scope of this study to determine how best to measure effectiveness, policy makers need different measures of effectiveness both to set funding levels and to provide policy guidance to the operating components of the system about how they can best use their resources.
Properly understood, meeting the budgeting challenge means not merely improving the reliability of budget estimates, but also being able to relate changes in budgeted levels to changes in both outputs and effectiveness under specified policies. To measure effectiveness, policy makers must first specify their objectives in terms that will allow the results of their enforcement efforts to be measured. Currently, agreement and clarity are lacking regarding the goals of immigration enforcement policies or how these should be measured, posing a fundamental obstacle to realistic budgeting (see Alden and Roberts, 2011, pp. 19-26). If there were agreement on the policy goals and the measures to be used to achieve those goals, then budgeters would be in a better position to specify funding levels for the policies and activities needed to achieve a specified level of performance, based on their estimates of the effects that enforcement
programs and strategies would have on the outcomes of greatest interest, such as reducing or deterring illegal entry. Over time, estimates of resource requirements would reflect policy makers’ assessments of the results of their policies and programs and their decisions about how resources could be best used to improve the outcomes they seek.
As noted above, budget estimates are made as much as 2 years before the time funds will be needed. They are naturally subject to initial error and may also need later revision on the basis of better or more recent information. Apart from changes in the operating environment and policies, the character of the budget process itself—both technical estimating procedures and its institutional aspects—may affect the accuracy of estimates of resource needs. Moreover, because of larger budget constraints and past decisions about priorities, currently budgeted amounts may not match estimates of resource needs derived from an estimating procedure that does not account for how administrators have adjusted their operations to past funding constraints or may adjust to future funding changes.
Institutional factors complicate budgeting for immigration enforcement. Budget requests are typically developed first by departmental components using a variety of statistical techniques and judgments and then reviewed at three separate levels, first within DOJ and DHS and later at the U.S. Office of Management and Budget (OMB). For the immigration enforcement system, estimates for major components are developed more or less separately and in parallel by the two departments.
The process increased in complexity when DHS was established in 2003. That action created divided responsibility for preparing and reviewing budget estimates between two cabinet agencies, posing a new potential barrier to communicating and to assessing how changes in policy or practice in one part of the enforcement system may affect others. And in Congress, separate appropriations subcommittees now review and authorize DHS and DOJ spending. The division of decision-making responsibility in both the executive and legislative branches makes it more difficult to coordinate budget preparation and review for components of the immigration enforcement system that were once housed together at DOJ (in the Immigration and Naturalization Service [INS]).
It is apparent from the language of the charge to the committee that Congress was concerned in 2008 about the possible effects of greatly increased funding for DHS functions on the demand for DOJ services. As already discussed, this effect is substantial; unfortunately, however, it is not straightforward. Moreover, it seems plausible that the challenge of coordinating budget requests as well as other coordinating challenges
may have been complicated by the split of immigration enforcement functions in 2003 between the two departments. Those charged with preparing budget estimates for DOJ enforcement programs may not have information available to DHS about immigration flows or about deployments, policies, or strategies that DHS is adopting that could change the numbers of those apprehended or the proportion who are arrested and charged rather than simply released or repatriated without formal charges: as discussed above, those DHS deployments, policies, and strategies would generate demand for DOJ-funded enforcement programs. If DHS policies and practices change, this can quickly change demand for DOJ services. If there is little advance notice of the change, this may make it impossible for those preparing or reviewing DOJ budget estimates to take the change into account. Thus, what may appear to be estimating errors may actually result from changes in resource needs that arise after budget or appropriations decisions have been made.


