
Recent Patterns of Unauthorized Immigration
Budgeting is an effort to match resources to needs. A specific budgeting activity can only be understood in terms of the public policy issue that it is attempting to address. This chapter provides a brief analysis of the flows of unauthorized immigrants across the U.S. southwestern border,1 the main path in recent decades for unauthorized migration, and assesses what is known about the determinants of those flows. Given the study’s focus, emphasis is given to the role of more intense enforcement and its effects on both the flows unauthorized immigrants and the stock (population) of such immigrants living in the United States.
STOCKS AND FLOWS OF UNAUTHORIZED IMMIGRANTS
The stock of unauthorized immigrants changes over time principally in response to shifts in the size of two flows: the number in-migrants and the number of outmigrants (either voluntary or forced). The stock is also affected by mortality, but that effect is trivial, largely because unauthorized migrants are mostly young, healthy adults, and few deaths occur (Oristian et al., 2009). Fertility is not a factor because births to undocumented migrants are, by definition, native-born citizens and do not contribute to the stock of unauthorized immigrants. Hence, the size of the stock is overwhelmingly determined by the volume of in- and outmigration flows.
![]()
1We ignore the northern border because it has historically seen minimal flows of illegal immigrants: see U.S. Department of Homeland Security (2011d).
When in-migration is greater than outmigration, the stock is increased; when outmigration is greater than in-migration, the stock is reduced.
The number of unauthorized immigrants living in the country also can be affected by changes in the legal status of foreign-born people in the United States. For example, when a person admitted to the United States with a valid temporary visa—such as a tourist, a foreign student, or a temporary worker—violates the terms of admission by staying past the expiration date of the visa or working when not legally allowed to do so, the unauthorized immigrant population increases. Visa overstayers are thought to represent 40-50 percent of the country’s stock of unauthorized immigrants (Pew Hispanic Center, 2006).
Conversely, a person’s legal status can change in the other direction. For example, an unauthorized immigrant can acquire a green card or some valid temporary status that permits U.S. residency. This change decreases the stock of unauthorized immigrants. Many of the avenues for unauthorized immigrants to obtain legal status have been eliminated in the past 10-15 years (see the discussion of the 1996 laws in Appendix A), but a major reduction in the stock of unauthorized immigrants through legalization did occur following the passage of the Immigration Reform and Control Act of 1986, when 2.6 million formerly unauthorized immigrants obtained permanent resident status.2
The distinction between stocks and flows highlights the fact that immigration enforcement involves two distinct but interrelated objectives: limiting the number of unauthorized entries and reducing the size of the resident undocumented population.3 The number of unauthorized entries depends most on the demand for labor, but it also reflects access to legal avenues for entry. When there are a relatively large number of visas for permanent residence or temporary labor relative to the demand, the number of undocumented entrants decreases. And, conversely, when the supply of visas is constricted relative to the demand for labor, undocumented migration becomes the only alternative for entry, and the volume increases. Under the latter circumstances, the number of unauthorized entries is determined, in theory, by how U.S. labor market conditions and enforcement policies affect the costs and benefits of undocumented migration. Since the mid-1980s, federal immigration enforcement policy has generally sought to reduce the benefits by imposing sanctions on
![]()
2Many other people, mostly from South and Central America and Haiti, were legalized by statute in the late 1990s and early 2000s.
3As discussed in Chapter 4, the number of undocumented entries is limited through “prevention” and, potentially, “deterrence,” while the size of the resident undocumented population is reduced through “removal.”
employers who hire unauthorized workers and to increase the costs by dramatically increasing border enforcement.
Undocumented migrants who successfully evade the enforcement system at the border next face the decision to stay or return home. Perhaps paradoxically, increasing the costs of border crossing tends to lower the likelihood of migrants’ returning (Massey et al., 2002). This happens because as the costs of entry rise, a migrant must work longer to pay off those up-front costs in order to make the trip economically justifiable. The unintended consequences of border enforcement have been counterbalanced in some ways by increased interior enforcement, away from the border.
Mexicans have been crossing the country’s southwestern border to live and work in the United States for at least 150 years. Until recent decades, most of the movement was for relatively short periods of seasonal employment rather than for permanent settlement. By contrast, the past 40 years have seen very large numbers of Mexicans migrate to live in the United States, and a large component of that “settler” migration has been unauthorized. Although census and survey data from the United States provide measures of the Mexican-born population in the United States and of flows of Mexicans who are living in the country on a more or less permanent basis, it is more difficult to accurately assess the volume of temporary, seasonal, or circular migration.4 These topics are explored further below.
The migration of Central Americans to the United States in large numbers has a shorter history. Moreover, because of the physical distances involved, the movement of Central Americans is less circular or seasonal and involves more longer-term settlement. The numbers of migrants are also much smaller. According to the most recent estimates, about 3 million Central American immigrants lived in the United States in 2010, compared with more than 12 million immigrants from Mexico. However, many Central Americans enter the United States illegally, and their movement generates enforcement actions at the southwestern U.S. border with Mexico and in the U.S. interior.
![]()
4It is difficult to measure migration flows from Mexico (and Central America) into the United States. Much of the flow is unauthorized, and migrants may be reluctant to participate in surveys and other data collection activities. Furthermore, because of the transitory nature of some of the movement, it can be difficult to define the point in the migration process at which a migrant is “residing” in the United States. Because of these definitional issues and limited survey coverage, different sources in both the United States and Mexico yield different estimates of migration flows. Although the patterns of change over time have generally been consistent, the sizes of the flows have differed. The estimates presented in this report are based principally on current U.S. surveys and are consistent with measured changes in the numbers of immigrants residing in the United States over the past 20 years.
DEMOGRAPHIC HISTORY AND PROFILES
Immigration from Mexico accounts for the vast majority of unauthorized entries across the southwestern U.S. border; a far smaller number come from Central America.
Mexican Immigrants
Early Period: Prior to 1970
For more than a century until 1970, Mexicans moved relatively freely back and forth across the southwestern U.S. border. The numbers living in the United States increased through 1930, fell substantially during the Great Depression (partly as the result of mass deportations), and then grew again after 1940, reaching a total of 760,000 Mexicans living in the United States at the time of the 1970 census (Massey, Durand, and Malone, 2002). They represented about 8 percent of the immigrants living in the country, and they were only the fourth largest immigrant group—behind Italians, Germans, and Canadians. Virtually all of the Mexican immigrants were in the United States legally. In 1970, Mexico’s census count was 48 million, so the Mexicans in the United States represented about 1.4 percent of the combined Mexican population of the two countries (see Instituto Nacional de Estadistica y Geografia, 2005).
Unauthorized Immigration: 1970s Through 2007
The migration situation changed dramatically in the 1970s as Mexican immigrants began to settle in the United States in much larger numbers than previously. This shift reflected, in large part, the changing role of Mexican immigrants in the U.S. labor market, with an increasing proportion being employed in year-round, full-time, nonagricultural jobs. Moreover, most of the new settlers were undocumented. Undocumented migration rose in part because shifts in U.S. policy cut off the avenues for legal entry. In 1965, the United States unilaterally terminated the Bracero Program, a temporary labor program that at its peak allowed some 450,000 Mexican workers annually on temporary visas. In addition, amendments to the Immigration and Nationality Act in that year imposed the first-ever numerical limits on immigration from the Western Hemisphere. By the late 1970s, the temporary work visas had largely disappeared without any corresponding increase in the number of permanent visas available to Mexicans (Massey, Durand, and Pren, 2009).
By 1980, the Mexican-born population of the United States had tripled to 2.2 million, about half of whom were undocumented. The flow of Mexican settlers into the United States continued to increase, and the numbers
in the country continued to grow. The overall pattern was one of accelerated growth during economic booms and deceleration during periods of stagnation (Massey, 2011).
By 2007, there were 12.5 million Mexican immigrants in the United States, representing almost one-third of the country’s foreign-born population and more than seven times as large as the immigrant population from the second largest source country—India at 1.7 million (Pew Hispanic Center, 2009). The absolute size of this immigrant group is almost unprecedented. There were more Mexican immigrants living in the United States than the total immigrant population in any other country.5 With Mexico’s 2010 census counting 112.3 million people, the Mexicans in the United States represented almost 10 percent of the combined Mexican population of the two countries. Moreover, if one considers the U.S.-born children of the Mexican immigrants as part of the worldwide Mexican population, then about one-sixth of the combined Mexican population of the two countries was in the United States.
About 7 million of the 12.5 million Mexicans in the United States in 2007 were undocumented immigrants (Passel and Cohn, 2011). The undocumented population had grown at a steady rate through the 1970s and early 1980s, but growth accelerated during the late 1980s and 1990s for a number of reasons, including faster economic growth, stronger migrant networks, and the continued transition of migrants out of seasonal labor and into year-round employment. Tougher border enforcement began to drive up the costs and risks of unauthorized entry, inducing further permanent settlement and driving down the rate of return migration (Massey, Durand, and Malone, 2002). The number and rapid growth of the unauthorized immigrant population is even more remarkable in light of the fact that about 2.7 million undocumented Mexican immigrants attained legal resident status around 1990 as a result of the Immigration Reform and Control Act of 1986 (IRCA) (Baker, 2010).
The unauthorized Mexican immigrants represented a majority (56 percent) of the Mexicans living in the country in 2007. The legal Mexican immigrant population of 5.6 million was by far the largest group of legal immigrants. They represented almost 21 percent of all legal foreign-born residents and were three-and-one-half times the size of the second largest group.
![]()
5Russia has about 12 million immigrants, making it the country with the second largest immigrant population in the world (United Nations, 2009).
Stagnation: 2007 to 2011
The migration situation changed dramatically after 2007. After increasing steadily for more than three decades, the Mexican-born population stopped growing and remained essentially unchanged for the next 4 years, through early 2011 (the latest available data). The number of legal Mexican-born residents increased slightly to 5.9 million and, for the first time since at least the 1980s, the number of unauthorized Mexicans decreased, dropping from 7 million to 6.5 million in 2010 (Passel and Cohn, 2011). The stagnation appears to be due to a very large drop in the number of new immigrants arriving in the United States and not to increased departures from the country. In fact, the likelihood of return migration by undocumented residents is at a record low (Aguilar et al., 2010; Massey, 2010). Net immigration of Mexican settlers into the country dropped to almost zero as inflows and outflows were in rough balance.
Central American Immigrants
There are many parallels between the growth of the Mexican and the Central American immigrant populations, notwithstanding the much longer history of movement between Mexico and the United States. In 1970, there were only about 120,000 Central American immigrants living in the country. The number tripled in the 1970s and then tripled again in the 1980s, so that in 1990 there were 1.1 million Central American immigrants in the country, almost 10 times as many as there had been in 1970.
The rapid population growth continued as the numbers doubled by 2000 and reached almost 3 million in 2007. The share of immigrants who were unauthorized hovered around 50 percent, slightly less than for Mexican immigrants but far exceeding the share unauthorized from any other part of the world (Passel and Cohn, 2009). Central Americans have represented about 12.5 percent of total unauthorized immigrants, which is about 30 percent of the total excluding Mexicans. No single country dominates Central American migration to the United States: the largest numbers are from El Salvador, Guatemala, and Honduras.
The rapid growth of Central Americans in the United States has also recently stagnated. After 2006, growth virtually ceased so that the total number of Central American immigrants in the United States in 2010 (3 million) was the same as it had been in 2006. The drop in the flows of immigrants from Central America was not as dramatic as in the case of Mexico. Overall, Central American migration is significant to the home countries. The population of Central America is slightly more than one-third of Mexico’s population, so the 3 million Central American immigrants in the United States represent almost 7 percent of the combined
population of Central America and Central Americans in the United States.
Annual Flows of Migrants
Because of the unauthorized component of inflows, there is no official count of the annual number of new migrants to the United States. It is possible, however, to derive measures of annual flows from census and survey questions that ask immigrants when they arrived in the country and by combining these data across time with repeated measures of the stock of immigrants.6
From Mexico
The annual flow of Mexican settlers was about 400,000 in the early 1990s, and the vast majority of these new settlers were unauthorized immigrants. The total flow increased to almost 600,000 in 1995 and then dropped slightly for 2 years. After 1997, the flow grew dramatically, reaching more than 700,000 annually in 1999 and 2000. The changing flows were related to conditions in both Mexico and the United States (Pew Hispanic Center, 2009): the rapid economic expansion in the United States in those years and the very favorable employment situation.
After 2000, the annual flow of migrants from Mexico dropped by about 20 percent, to slightly less than 600,000 for 2001-2003. The initial drop is associated with the beginning of a U.S. recession in 2001 and higher unemployment rates. By 2004, the employment situation in the United States had begun to improve, and the flow from Mexico increased to more than 600,000. It then plummeted with the beginning of severe economic recession in the United States. Mexicans were affected by the contraction of the U.S. economy even earlier than the general U.S. population. With the collapse of the housing boom that began in 2006, the construction sector, which had employed large numbers of Mexican laborers, plunged into recession in early 2007 (before the rest of the economy).
In 2007, the flow was only one-half of what it had been 2 years earlier—320,000. The numbers continued to fall, to about 175,000 in 2009. In that year, Border Patrol apprehensions reached a 36-year low (U.S. Department of Homeland Security, 2011d). The flow remained virtually unchanged in 2010 (according to preliminary data), while apprehensions continued to fall. Overall, the flow of migrants from Mexico during the
![]()
6Estimates of annual immigrant inflows from Mexico and Central America were prepared by the committee. A fuller description of the estimates, methods, and sources can be found in two forthcoming publications (Passel, 2011, 2012).
past 3 full years (2008-2010) has been well below that for any other time in the post-1990 period. It is worth noting that during the same 3 years, unemployment rates in the United States were the highest they had been in a long time.
From Central America
The flows of immigrants from Central America are much smaller than those from Mexico, usually one-sixth to one-fourth as large, but the general patterns of increases and decreases are quite similar to the Mexican flows. The gross number of Central Americans coming to the United States peaked in 2000 (at 136,000) and then dropped in 2001-2004 with the post-2000 U.S. economic slowdown. The Central American flow hit a larger peak in 2005, at almost 150,000. Since then, it has decreased steadily, reaching 60,000 in 2010 (Passel, 2012).
CROSS-BORDER FLOWS OF MEXICAN MIGRANTS
Border Patrol apprehensions along the southwestern border are believed to be an indicator of changes in flows of unauthorized Mexican migrants to the United States. But apprehensions clearly are not an adequate measure of flows, because the same individual may be caught more than once or not at all. According to field research, more than 9 out of 10 of those who are apprehended on their first attempt and are then eventually released back to Mexico succeed in entering undetected on the second or third attempt, and more than half of all unauthorized entrants are not apprehended even once (Cornelius et al., 2010; Cornelius, 2011); see Figure 3-1. Moreover, the volume of apprehensions can be affected by a variety of factors other than the number of migrants attempting to cross the border, such as interdiction strategies, staffing levels, and migrant decisions. Nonetheless, the overall pattern of apprehensions in the 1990s and 2000s is similar to that of U.S. data on immigrant flows: both increased during the late 1990s and peaked around 2000, dropped somewhat with the 2001-2002 recession, increased in the middle of the decade, and then plummeted after 2006.
Mexico’s labor force survey,7 redesigned in 2005, measures quarterly movement out of and into Mexico. The longitudinal design captures short-term as well as long-term movement and, thus, would seem to be able to show both permanent flows to live in the United States and circular labor migration flows. The volume of flow from Mexico shown in this survey is
![]()
7Encuesta Nacional de Ocupacion y Empleo (ENOE), which is carried out by Instituto Nacional de Estadistica y Geografia (INEGI).
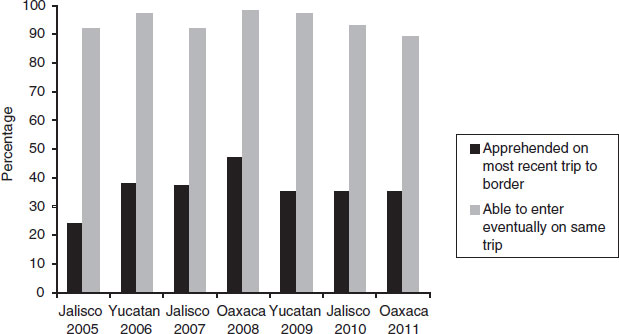
FIGURE 3-1 Apprehension and eventual success rates among unauthorized U.S.- Mexican border crossers from Jalisco, Oaxaca, and Yucatan: 2005-2011.
SOURCES: Data from Cornelius (2011), Hicken et al. (2011), Fitzgerald et al. (2012).
substantially larger than that measured in U.S. sources. For example, for the November 2005-November 2006 period, the Mexican survey shows about 1.1 million Mexicans leaving the country; the U.S.-based estimate of the flow, in contrast, is slightly more than 450,000 for the 2006 calendar year. The two numbers are not necessarily incompatible, however, as the former is an estimate of the gross flow from Mexico, including both permanent movers to the United States as well as temporary migrants, while the latter is an estimate of the flow of new permanent movers only. The Mexican data show a net movement of about 575,000, which is closer to the U.S. figure but still higher. For 2006, the United States recorded 226,000 legal entries by temporary workers, and they would be captured in the Mexican data. The overall picture presented from the Mexican side is very consistent with the U.S. data. Over the 2005-2010 period, migration to the United States dropped dramatically. Gross flows of new settlers to the United States at the middle of the decade were about 500,000 (or more) per year but had dropped by as much as 80 percent by the end of the decade. These patterns are consistent with an economic explanation for migration to the United States. Specifically, the availability of employment (as indicated by low unemployment rates) draws Mexicans to the U.S. labor market. With much higher unemployment by the end of the decade than earlier, fewer Mexicans are coming to the United States.
Field research conducted among potential migrants in Mexico from
2007 to 2009 reveals that the probability of migrating to the United States during the next 12 months dropped in tandem with the intensification of the economic recession (Massey, Durand, and Pren, 2009; Cornelius et al., 2010; Fitzgerald et al., 2011; Massey, 2011). The research over many years suggests that high wages and persistent labor demand in the United States are the principal drivers of undocumented migration (Jenkins, 1977; Blejer et al., 1978; Bean et al., 1990; Espenshade, 1990; Hanson and Spilembergo, 1999; Davila et al., 2002), with the precise number of migrants being conditioned strongly by the size of the worker cohorts who are entering the Mexican labor market (Hanson and McIntosh, 2009, 2010). Economic conditions in Mexico are significant but secondary in their effects on outmigration (Frisbie, 1975; Jenkins, 1977; Taylor, 1987; Massey and Espinosa, 1997; Davila et al., 2002).
As U.S. economic conditions have deteriorated in the past 5 years, enforcement activities have increased; but rising enforcement does not seem to have played a significant role in lowering the likelihood of undocumented migration. Although Amuedo-Dorantes and Bansak (2012) found that increased time spent patrolling the border (“linewatch” hours) decreased the willingness of experienced migrants to cross again and increased the waiting time before the next attempted crossing, their study focused on intentions rather than behavior.
Studies of behavior generally show that rising enforcement has little deterrent effect on undocumented migration. Davila et al. (2002) found that although increased linewatch hours reduced apprehensions initially, the effect was short-lived as migrants adapted their behavior to avoid capture. In her analysis of Mexican migration, Gathman (2008) found that linewatch hours had no effect on the probability of taking an undocumented trip once other factors were held constant. Massey and Riosmena (2010) similarly found no significant effect of linewatch hours on the likelihood of undocumented migration from several Latin American nations, including Mexico. When they measured the enforcement effort using the probability of apprehension at the border, Massey and Espinosa (1997) found a positive effect on the likelihood of initiating undocumented migration. Massey and Riosmena (2010) found that rising deportations from the United States likewise increased the odds of undocumented migration.
Rather than acting as a deterrent, increased enforcement appears to have other effects on migrant behavior: it increases the duration of trips and reduces the likelihood of return migration (Kossoudji, 1992; Massey, Durand, and Malone, 2002; Reyes, 2004; Riosmena, 2004); it shifts border crossing away from areas of concentrated enforcement (Massey, Durand, and Malone, 2002; Orrenius, 2004; Carrion-Flores and Sorenson, 2006; Massey, 2007; Massey, Durand, and Pren, 2009); and it increases the like-
lihood of crossing with a border smuggler (Singer and Massey, 1998; Massey, Durand, and Malone, 2002; Massey, Durand, and Pren, 2010).
Field data show that the vast majority of would-be unauthorized Mexican migrants—roughly 9 of 10—hire such smugglers to reduce the physical risk of clandestine entry and improve their prospects for evading the Border Patrol. The percentage of migrants using paid guides has steadily risen from the early 1990s, from around 80 percent to nearly 100 percent today (Mexican Migration Project, 2010). Not surprisingly, increased border enforcement also increases the cost of hiring a border smuggler, commonly known as a coyote (Massey, Durand, and Malone, 2002; Gathman, 2008; Massey, Durand, and Pren, 2010).
There are several reasons that the deterrent effects of enforcement are small, as shown in most studies. The most obvious is that rising enforcement at particular locations on the border simply induces migrants to cross elsewhere (Orrenius, 2004). Another reason is that as crossing costs have increased, migrants’ ability to finance crossings using their U.S.- based networks has also risen, resulting in little net effect of rising costs on the proclivity to migrate (McKenzie and Rapoport, 2007). A third reason is that, in the long term, the earnings gains from migration far outweigh border crossing costs, which also leads to little deterrent effect.
Finally, personal knowledge of border crossing and experience with worksite enforcement in the United States are positively correlated with intent to migrate, perhaps explaining the counterintuitive finding in some studies of a positive effect of enforcement on undocumented migration. Information about U.S. enforcement activities (both at the border and in the interior) continually flows from U.S.-based migrants to relatives and friends in migrant-sending communities. Having good information does not deter migration, and it may in fact increase the propensity to migrate by raising potential migrants’ confidence about their ability to circumvent barriers to illegal entry, find a better coyote, and so on (Fuentes et al., 2007; Parks et al., 2009; Hicken et al., 2010).
Other research has also noted that migration and enforcement are endogenous,8 making causal effects difficult to discern (Hanson and Spilimbergo, 1999). Field data gathered in 2007-2011 suggest that enforcement is a bigger deterrent of potential migrants when they also face a lack of jobs in the United States. This interactive effect reflects the changed calculus of expected economic returns to migration during a recessionary period. According to survey data, migrants’ perceptions of the intensity of border enforcement were essentially stable during this period. During each year of the recession, 9 of 10 potential migrants believed that it was
![]()
8Since the Border Patrol responds to increases in illegal crossings by ramping up enforcement, crossings and enforcement often appear to rise together.
not very difficult to evade the Border Patrol if one crossed clandestinely. The perceived difficulty of finding work in the United States, however, jumped sharply. Potential migrants are reluctant to borrow $3,000-$5,000 (depending on mode of entry), mostly from their U.S.-based relatives, to pay a coyote if the probability of employment is not high.
Among unauthorized Mexicans who have made it into the United States, increased border and interior enforcement have a strong negative effect on the likelihood of their returning to Mexico. Unauthorized migrants who are working are reluctant to return to Mexico, even for a short visit, because they risk losing their foothold in the U.S. economy— a fear exacerbated by the recession. Moreover, they would have to pay heavily to be smuggled back into the United States. This “caging effect” of tougher enforcement on return migration is one of the most notable consequences of the immigration enforcement build-up since 1993, accounting for a significant portion of the growth in the stock of undocumented Mexicans during this period.
Among migrants from Central America, the data show that enforcement also interacts with the state of the U.S. economy. When employment demand and wages are low, rising enforcement has a deterrent effect on the likelihood of making a first illegal trip to the United States. But when employment and wages are high, the effect is mitigated and works as it does for potential Mexican migrants, with rising enforcement correlated with more trips. The effect of enforcement on return migration is the same as among Mexicans: rising levels of both border and interior enforcement reduce the probability of return migration.
In sum, the recent drop in undocumented migration can be attributed more to the state of the U.S. economy than to stronger enforcement. Key contributing factors include a drop in employment demand and wages in the United States and expanded access to legal immigration (through temporary “H” visas and as a result of sponsorship by naturalized U.S. citizens of their relatives). Although existing studies suggest that rising enforcement has historically only played a small role in deterring migration, it has proven more potent during the economic downturn, perhaps due to migrants’ reduced ability to finance higher border crossing costs by borrowing against future earnings.
Migration dynamics are also affected by changing demographic conditions in Mexico, particularly the fertility rate, which has declined by
more than 70 percent over the past 50 years.9 These dramatic shifts in childbearing have sharply reduced the sizes of birth cohorts and lowered the numbers of new entrants into the Mexican labor force some 15 to 20 years later. For example, the average annual increases in the number of 10- to 14-year-old males in the population shrank from about 150,000 per year in the 1970s and 1980s to approximately 20,000 per year over the past 10 years.10
Such changes have encouraged some analysts to conclude cautiously that demographic pressures to migrate from Mexico to the United States may have begun to abate as a result of declining Mexican fertility (see, e.g., Binational Study on Migration (Project) [1997]). According to Hanson (2010), the changing size of cohorts entering the Mexican labor force explained about 40 percent of the temporal variation in total migration from Mexico over the past two decades of the 20th century, which suggests that the declining growth cohort size since 2000 has played some role in recent declines. Projections suggest the decline in cohort growth will continue into the future (Hanson and McIntosh, 2009) to help reduce the shortfall long noted between the number of new jobs becoming available each year in Mexico and the number of new potential labor force entrants (and thus the number of potential migrants). Of course, the likelihood of Mexicans’ migrating to the United is affected by numerous factors besides population growth. For example, there was a rise in the volume of Mexican migration to the United States during the late 1990s and mid-2000s (Bean and Lowell, 2007; Passel and Cohn, 2011), which were periods when the cohorts of entrants into the Mexican labor force were smaller than in previous decades.
One important factor affecting migration from Mexico is the availability of jobs in Mexico. If young Mexicans think that their job prospects at home are grim and that their employment possibilities in the United States are much better, they are relatively likely to leave. This perspective may be prevalent even if the overall numbers of young Mexicans have become appreciably smaller and even if economic conditions in Mexico have changed sufficiently so that there are enough jobs becoming available for those who seek them.
Unfortunately, from the U.S. perspective, the available evidence about recent employment possibilities in Mexico is not encouraging. From the mid-1950s until 1982, economic growth in Mexico (measured as the annual percentage change in the real gross domestic product [GDP]) averaged about 6.8 percent per year (Weintraub, 2010). From 1983 until
![]()
9For example, the Mexican total fertility rate (roughly the average number of children per woman) fell from more than 7.0 in 1965 to 2.4 in 2010 (Gonzalez, 2008; Cave, 2011).
10Calculations carried out by the committee from Mexican census data.
1993, growth tapered off sharply, averaging barely more than 1.0 percent per year, which set the stage for the North American Free Trade Agreement (NAFTA) in 1994. Despite ensuing increases in U.S.-Mexico trade (Martin, 2009), growth in the Mexican economy did not notably increase, averaging only about 2.5 percent annually from 1995 through 2007—not enough to keep pace with population growth (Alba, 2008). In 2008-2009, labor market conditions worsened because of the U.S. recession and spillover effects of the global financial crisis in Mexico, although economic expansion appears to have resumed in 2010 (Federal Reserve Bank of Dallas, 2011). On balance, despite fertility declines that would seem to have dampened the likelihood of migration, employment prospects in Mexico have stagnated over the past 15 years, and indeed probably have worsened in many of Mexico’s high-emigration areas.
CONCLUSION: IMPLICATIONS FOR BUDGETING
Insights into patterns of migration and the factors that drive them have potential implications for budgeting. For example, the importance of U.S. economic conditions for efforts by potential migrants from Mexico and Central America to enter the United States means that decisions about budgets must consider the possibility of increased migration attempts when the U.S. economy improves. With the resources of many components of the immigration enforcement system already stretched thin (see Chapter 4), it is unclear how the relevant agencies and the federal court system could handle higher migration volumes in the current system of “enforcement with consequences.” The evidence that enforcement has been only minimally effective in reducing unauthorized immigration is another challenge to the immigration system and suggests that agencies need to pay attention not only to the level of resources required to maintain current enforcement efforts at the same or higher levels but also to consider whether alternative ways of using enforcement resources— affecting either risk of apprehension or severity of sanctions, or both— would be more effective in achieving the goals of U.S. immigration enforcement policy.


