
Searching for Statistical Diagrams
SHIRLEY ZHE CHEN, MICHAEL J. CAFARELLA, AND EYTAN ADAR
University of Michigan
INTRODUCTION
Statistical, or data-driven, diagrams are an important method for communicating complex information. For many technical documents, the diagrams may be readers’ only access to the raw data underlying the documents’ conclusions.
Unfortunately, finding diagrams online is very difficult using current search systems. Standard text-based search will only retrieve the diagrams’ enclosing documents. Web image search engines may retrieve some diagrams, but they generally work by examining textual content that surrounds images, thus missing out on many important signals of diagram content (Bhatia et al., 2010; Carberry et al., 2006). Even the text that is present in diagrams has meaning that is hugely dependent on their geometric positioning within the diagram’s frame; a number in the caption means something quite different from the same number in the x-axis scale (Bertin, 1983).
There has been growing commercial interest in making data-driven diagrams more accessible, with data search systems such as SpringerImages (http://www.springerimages.com/) and Zanran (http://www.zanran.com/q/). While there is a huge amount of research literature on search and image-related topics, diagram search per se is largely unexplored.
In this paper we propose a Web search engine exclusively for data-driven diagrams. As with other Web search engines, our system allows the user to enter keywords into a text box in order to obtain a relevance-ranked list of objects. Our system addresses several challenges that are common among
different search engines but that require solutions specifically tailored for data-driven diagrams.
Diagram Corpus Extraction
Obtaining the text of a Web document is usually as easy as downloading and parsing an HTML file; in contrast, statistical diagrams require special processing to extract useful information. They are embedded in PDFs with little to distinguish them from surrounding text, the text embedded in a diagram is highly stylized with meaning that is very sensitive to the text’s precise role, and, because diagrams are often an integral part of a highly engineered document, they can have extensive “implicit hyperlinks” in the form of figure references from the body of the surrounding text. Our Diagram Extractor component attempts to recover all of the relevant text for a diagram and determine an appropriate semantic label (caption, y-axis label, etc.) for each string.
Ranking Quality
All search engines must figure out how to score an object’s relevance to a search query, but scoring diagrams for relevance can yield strange and surprising results. We use the metadata extracted from the previous step to obtain search quality that is substantially better than naive methods.
Snippet Generation
Small summaries of the searched-for content, usually called snippets, allow users to quickly scan a large number of results before actually selecting one. Conventional search engines select regions of text from the original documents, while image search engines generally scale down the original image to a small thumbnail. Neither technique can be directly applied to data-driven diagrams. Obviously, textual techniques will not capture any visual elements. Figure 1 shows that image scaling is also ineffective: although photos and images remain legible at smaller sizes, diagrams quickly become difficult to understand.
This paper describes DiagramFlyer, a search engine for finding data-driven diagrams in Web documents. It addresses each of the above challenges, yielding a search engine that successfully extracts diagram metadata in order to provide both higher-quality ranking and improved diagram “snippets” for fast search result scanning.
The techniques we propose are general and can work across diagrams found throughout the Web. However, in our current testbed we concentrate on diagrams extracted from PDFs that were discovered and downloaded from public Web pages on academic Internet domains. Our resulting corpus contains 153,000 PDFs and 319,000 diagrams. We show that DiagramFlyer obtains a 52% improvement in
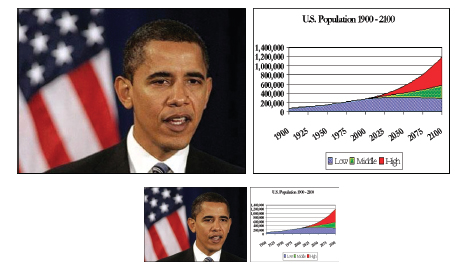
FIGURE 1 Scaling down images works well when generating visual snippets for photos, but diagrams can quickly become illegible.
search quality over naive approaches. Furthermore, we show that DiagramFlyer’s hybrid snippet generator allows users to find results 33% more accurately than with a standard image-driven snippet. We also place DiagramFlyer’s intellectual contributions in a growing body of work on domain-independent information extraction—techniques that enable retrieval of structured data items from unstructured documents, even when the number of topics (or domains) is unbounded.
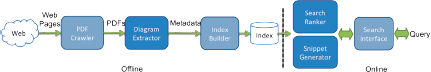
FIGURE 2 The data processing pipeline. An offline component crawls the Web for PDFs, extracts the statistical graphics, and constructs an inverted text index over the resulting extracted metadata. This index and the diagrams are then fed to an online system that ranks diagrams according to users’ queries and generates query-appropriate search snippets. The dark blue boxes signify research components described in this paper.
SYSTEM OVERVIEW
As with a traditional Web search engine, DiagramFlyer employs a pipeline of offline corpus-processing steps that produce output then used by an online search query system. The system architecture is seen in Figure 2.
The offline pipeline has three components:
1. The PDF Crawler attempts to download a large number of Web-hosted scientific papers for diagram search.
2. The Diagram Extractor receives the resulting stream of nearly 153,000 papers. This extractor attempts to identify all the diagrams in the corpus and then annotate the text in each diagram with an appropriate semantic role. As seen in Figure 3, the Diagram Extractor identifies eight roles within the diagram (legend, caption, title, etc.). It also looks for any surrounding text that mentions the figure, labeling the relevant sentences as
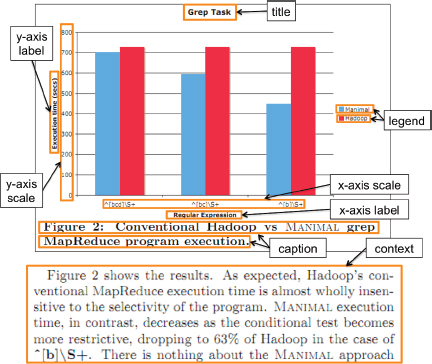
FIGURE 3 Diagram metadata labels for a sample diagram. Some labels, such as title and legend, are found in different places for different graphics.
“context.” For the testbed system, we used two-dimensional data-driven plots (including scatterplots, time series, and bar plots).
3. The Index Builder constructs a search index over the extracted and annotated diagrams. The index tracks each extracted field separately so that keyword matches on individual parts of the diagram can be weighted differently during ranking.
As seen in Figure 4, DiagramFlyer’s online search system is similar in appearance to traditional Web search engines. Answering an online query requires two additional components:
1. The Search Ranker assesses the relevance of each diagram in its index. Our system’s main advantage over a standard search ranker is its access to the textual features generated by the Diagram Extractor.
2. Finally, the Snippet Generator generates a brief summary of each search hit, ordering them according to the Search Ranker. DiagramFlyer’s Snippet Generator creates special diagram-specific snippets that contains both graphical and textual elements.
ALGORITHMS
As mentioned above, our system has three main novel components. Because of space limitations, this version of the paper only discusses the Diagram Extractor component.
The Diagram Extractor uses a PDF extractor to obtain all text strings from the document. It then employs a four-stage processing sequence to recover groups of labeled text strings that correspond to real data-driven diagrams:
1. A trained text-centric classifier gives strings an initial label based strictly on textual features, such as the number of words in a string, whether a string is capitalized, distribution of parts of speech, and so on.
2. We then group labeled strings together into geometrically neighboring sets that loosely correspond to diagrams. Sets without critical labels, such as relevant x- and y-axis data, are thrown away. This filters out a huge number of strings that are not relevant to any diagram.
3. We then recompute labels for each string, using the initial labels to compute a series of position-sensitive features. For example, one important feature is a text string’s distance to the nearest x-axis scale. This round of classification substantially improves label precision and recall.
4. Finally, we group the resulting labeled strings into sets that represent the final diagram estimates. This step relies heavily on the semantic label applied above; for example, a caption string should always be part of the lower portion of a diagram.
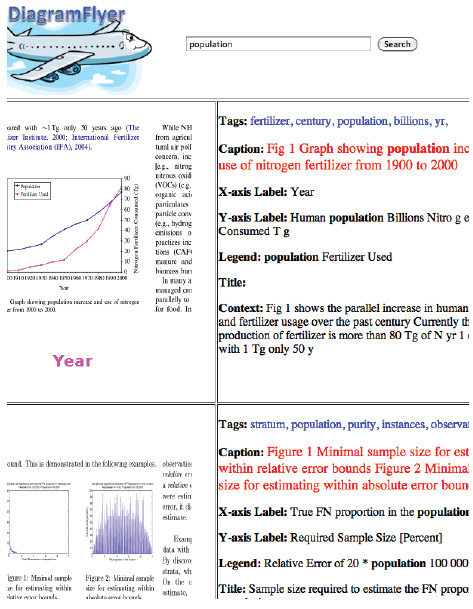
FIGURE 4 A screenshot of the DiagramFlyer search system.
This output is then fed to the Search Ranker and Snippet Generator components.
EXPERIMENTAL RESULTS
The Diagram Extractor is a query-independent component, and so it can be evaluated strictly using our downloaded corpus of scientific papers. We started with 4.7 billion URLs from the English segment of the ClueWeb09 data set (http://lemurproject.org/clueweb09.php/). Of these, we retained those pointing to PDF documents. To target PDFs that are more likely to contain diagrams, we further restricted the crawl to the .edu domain. A query workload is critical for evaluating our Search Ranker and Snippet Generator components, but we do not discuss them in this abbreviated paper.
To determine the best implementation for the Diagram Extractor, we evaluated three slightly different versions:
• text-only: Just the simple textual classifier.
• all-classifiers: The textual classifier and the position-sensitive classifier, without filtering.
• full: All steps.
We trained these classifiers using all of the text segments derived from more than 260 data-driven diagrams that were randomly chosen from the PDF corpus; the segments were labeled by hand. We tested the results using another set of 180 similarly generated and labeled diagrams. The evaluation results are shown in the following table (the best scores for any task are shown in bold).
| Recall | Precision | |||||
| text-only | all | full | text-only | all | full | |
| Title | 0.256 | 0.651 | 0.674 | 0.344 | 0.609 | 0.617 |
| y-scale | 0.782 | 0.796 | 0.754 | 0.889 | 0.843 | 0.900 |
| y-label | 0.835 | 0.864 | 0.874 | 0.775 | 0.752 | 0.797 |
| x-scale | 0.903 | 0.835 | 0.835 | 0.616 | 0.915 | 0.896 |
| x-label | 0.241 | 0.681 | 0.681 | 0.340 | 0.842 | 0.835 |
| Legend | 0.520 | 0.623 | 0.656 | 0.349 | 0.615 | 0.631 |
| caption | 0.952 | 0.887 | 0.839 | 0.450 | 0.887 | 0.929 |
| nondiagram | 0.768 | 0.924 | 0.313 | 0.850 | 0.909 | 0.838 |
The precision gain of full over all-classifiers is due to the diagram group filter. On a set of 449 candidate diagram groups, this filter removed 165 bad ones and just 11 good ones. For most labels, this filter does not influence recall much. However, it dramatically reduces recall of non-diagram text in the full case, from 0.9239 to 0.3126. In the case of non-diagram, a reduction in recall is actually a good sign: Most of the “bad candidates” arise from diagrams that are pictorial or otherwise not data driven and would not make sense in the downstream search engine. Reducing recall for this label means that strings that are unnecessary for any diagram are being removed from the output and possibly downstream diagram detection. Although all-classifiers has a comparable overall performance, we chose full in DiagramFlyer to emphasize precision over recall.
It is clear that title and legend are the metadata items that are most difficult to classify. In some ways, the result is not surprising: title is not always presented, and legend can appear in several different locations. Finally, we also evaluated our method for diagram regrouping. We successfully reconstructed 89 diagrams out of a potential 119, with just 20 incorrect ones. These incorrect outputs arose from splitting a single diagram or joining two distinct diagrams.
RELATED WORK
There is a vast literature on text search, snippet generation, image search, and image processing; much of it is not relevant to the unusual demands of searching statistical diagrams. There has been some work in specialized diagram understanding, for example, in processing telephone system diagrams (Arias et al., 1995), but this work is extremely tailored to a narrow diagram type and is not suitable for a general search application.
Only a few pieces of work process diagrams in ways suitable for Web-style search. Huang et al. (2003) proposed an automatic mechanism to recover actual numerical quantities from diagrams’ graphical components; it may be usable at large scale. Huang et al. (2005) attempted to label regions of chart text, similar to the Diagram Extraction phase, albeit with fewer labels and somewhat lower accuracy, and it is unclear whether their technique can handle multidiagram images. The most relevant is work from Kataria et al. (2008) and Lu et al. (2009). They extract information from paper-embedded diagrams, recovering both text labels and graphical elements; their text recovery component focuses on recovering OCR text, with some amount of label recovery as a side effect of the technique. Their system uses some of the same features as DiagramFlyer’s Diagram Extractor, though it is not clear how much their technique can be extended to yield more fine-grained labels, and they do not focus on any tasks downstream from the extraction stage.
CONCLUSION
We have shown that domain-independent diagram extraction is possible. In the full presentation we also present evidence that shows how this system enables higher-quality search relevance and snippet generation than is possible using standard techniques.
REFERENCES
Arias, J. F., C.P. Lai, S. Surya, R. Kasturi, and A.K. Chhabra. 1995. Interpretation of telephone system manhole drawings. Pattern Recognition Letters 16(4):355–369.
Bertin, J. 1983. Semiology of Graphics: Diagrams, Networks, Maps. Madison, Wisc.: University of Wisconsin Press.
Bhatia, S., P. Mitra, and C. L. Giles. 2010. Finding algorithms in scientific articles. Proceedings of the 19th International World Wide Web Conference, Raleigh, N.C., April 26–30, 2010.
Carberry, S., S. Elzer, and S. Demir. 2006. Information graphics: An untapped resource for digital libraries. Proceedings of the 29th Annual International ACM SIGIR Conference, Seattle, Wash., August 6–11, 2006.
Huang, W., C. Tan, and W. Loew. 2003. Model-based chart image recognition. Fifth International Workshop on Graphics Recognition (GREC), Barcelona, Spain, July 30–31, 2003.
Huang, W., C. L. Tan, and W. K. Leow. 2005. Associating text and graphics for scientific chart understanding. Eighth International Conference on Document Analysis and Recognition, Seoul, Korea, August 29–September 1, 2005.
Kataria, S., W. Browuer, P. Mitra, and C. L. Giles. 2008. Automatic extraction of data points and text blocks from 2-dimensional plots in digital documents. Proceedings of the 23rd AAAI Conference on Artificial Intelligence, Chicago, Ill., July 13–17, 2008.
Lu, X., S. Kataria, W. J. Brouwer, J. Z. Wang, P. Mitra, and C. L. Giles. 2009. Automated analysis of images in documents for intelligent document search. International Journal on Document Analysis and Recognition 12(2):65–81.
This Page is Blank


