
Physical Activity Environments
Physical Activity Environments: Goal, Recommendation, Strategies, and Actions for Implementation
Goal: Make physical activity an integral and routine part of life.
Recommendation 1: Communities, transportation officials, community planners, health professionals, and governments should make promotion of physical activity a priority by substantially increasing access to places and opportunities for such activity1
Strategy 1-1: Enhance the physical and built environment. Communities, organizations, community planners, and public health professionals should encourage physical activity by enhancing the physical and built environment, rethinking community design, and ensuring access to places for such activity.
Potential actions include
• communities, urban planners, architects, developers, and public health professionals developing and implementing sustainable strategies for improving the physical environment of communities that are as large as several square miles or more or as small as a few blocks in size in ways that encourage and support physical activity; and
![]()
1 Note that physical education and opportunities for physical activity in schools are covered in Recommendation 5, on school environments.
• communities and organizations developing and maintaining sustainable strategies to create and/or enhance access to places and programs where people can be physically active in a safe and enjoyable way.
Strategy 1-2: Provide and support community programs designed to increase physical activity. Communities and organizations should encourage physical activity by providing and supporting programs designed to increase such activity.
Potential actions include
• developing and implementing ongoing physical activity promotion campaigns that involve high-visibility, multiple delivery channels and multiple sectors of influence;
• developing and implementing physical activity strategies that fit into people’s daily routines—strategies that are most effective when tailored to specific interests and preferences; and
• developing and implementing strategies that build, strengthen, and maintain social networks to provide supportive relationships for behavior change with respect to physical activity.
Strategy 1-3: Adopt physical activity requirements for licensed child care providers. State and local child care and early childhood education regulators should establish requirements for each program to improve its current physical activity standards.
Potential actions include
• requiring each licensed child care site to provide opportunities for physical activity, including free play and outdoor play, at a rate of 15 minutes per hour of care; as a minimum, immediate first step, each site providing at least 30 minutes of physical activity per day for half-day programs and 1 hour for full-day programs.
Strategy 1-4: Provide support for the science and practice of physical activity.
Federal, state, and local government agencies should make physical activity a national health priority through support for the translation of scientific evidence into best-practice applications.
For federal-level government agencies, potential actions include
• the Department of Health and Human Services establishing processes for the regular and routine communication of scientific advances in understanding the health benefits of physical activity, particularly with respect to obesity prevention (these processes could include, but are not limited to, regularly scheduled updates of the Physical Activity Guidelines for Americans and reports of the U.S. Surgeon General); and
• all federal government agencies with relevant interests developing priority strategies to promote and support the National Physical Activity Plan, a trans-sector strategy for increasing physical activity among Americans.
For state and local health departments, potential actions include
• developing plans and strategies for making promotion of physical activity a health priority at the state and local levels.
Physical activity is defined as any movement requiring “skeletal muscles that results in energy expenditure” (Caspersen et al., 1985, p. 126); exercise refers to a specific type of physical activity that is planned, repetitive, and purposeful in increasing physical activity (Caspersen et al., 1985). National guidelines for recommended levels of physical activity for the general health of both adults and children are for adults to engage in 150 minutes of moderate-intensity or 75 minutes of vigorous physical activity each week and for children to engage in at least 60 minutes of a combination of aerobic, muscle-strengthening, and bone-strengthening physical activity per day (see also Box 3-3 in Chapter 3). (It should
be noted that, although 60 minutes or more of physical activity per day is recommended for children and adolescents, some studies suggest that a longer time period per day is more likely to be optimal [Andersen et al., 2006; HHS, 2008].)
Both physical activity and exercise are relevant to obesity prevention because both contribute to energy balance. Energy balance—defined as a total energy expenditure that is roughly equal to energy intake—is a steady state in which weight gain is minimized or prevented. Caloric excess occurs when total energy intake is greater than total energy expended. Total energy expenditure reflects the expenditure from physiologic functioning (metabolism) in a person of a given body size, as well as energy expended through routine activities of daily living, activities undertaken specifically for work and recreation, and exercise undertaken for health reasons. It is the routine or voluntary component of physical activity that is the focus of physical activity (or exercise) guidelines. Expending calories through activity raises the level of caloric intake associated with maintaining energy balance, i.e., before calories are “excess.”
Communities, transportation officials, community planners, health professionals, and governments should make promotion of physical activity a priority by substantially increasing access to places and opportunities for such activity.
As described in the previous chapter, a simplified systems map illustrates the interrelationships among the five areas that structure the committee’s recommendations. Figure 5-1 highlights physical activity environments, one of these five areas. Although the focus of this report is on accelerating obesity prevention, physical activity has far more health-enhancing benefits. Strong evidence indicates that participation in physical activity at or above the minimal equivalent of 150 minutes/week at moderate intensity for adults reduces the risk of coronary artery disease, stroke, type 2 diabetes mellitus, cancers of the colon and breast, hypertension, and an adverse lipid/lipoprotein profile (Physical Activity Guidelines Advisory Committee, 2008). Strong evidence also indicates that this amount of physical activity reduces the risk of depression and cognitive dysfunction specifically in older adults (Physical Activity Guidelines Advisory Committee, 2008). Moreover, there is moderate and emerging evidence for a variety of other beneficial health outcomes of physical activity in adults.
For children and adolescents, evidence indicates that 60 minutes of physical activity (including aerobic and bone- and muscle-strengthening activity) every day
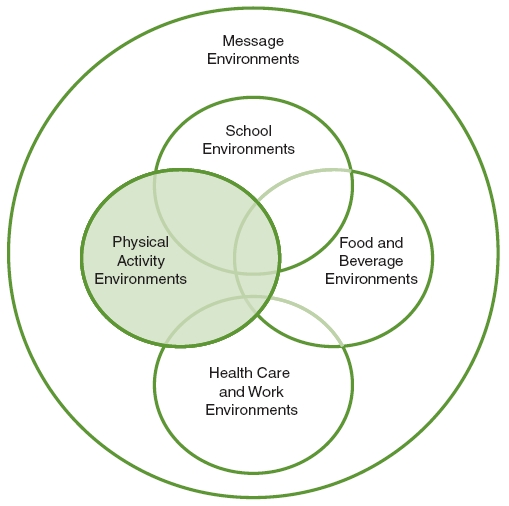
FIGURE 5-1 Five areas of focus of the Committee on Accelerating Progress in Obesity Prevention.
NOTE: The area addressed in this chapter is highlighted.
leads to important health benefits, including positive impacts on physical fitness, body fatness, cardiovascular and metabolic risks, bone health, and depression and anxiety (Physical Activity Guidelines Advisory Committee, 2008). In children, effects on body mass index (BMI) have been seen with 30 to 60 minutes of physical activity three to five times per week (HHS, 2008).
Physical activity promotion should therefore be a health priority. Currently, however, Americans are not meeting the physical activity recommendations summarized above. Results of the 2009 Behavioral Risk Factor Surveillance System survey indicate that approximately half of all U.S. adults engage in enough physical activity to meet the recommended time and intensity for substantial health
benefits (CDC, 2009). Furthermore, the 2009 Youth Risk Behavior Surveillance System found that just more than 18 percent of adolescents (grades 9 through 12) nationwide are engaged in the recommended amount of physical activity, and almost one-quarter of adolescents are generally inactive (i.e., did not participate in the recommended 60 minutes of physical activity on any day during the week preceding the survey) (Eaton et al., 2010).
Any strategy that increases energy expenditure (when combined with restriction of energy intake) should be considered as a potential contributor to obesity prevention. Priority should therefore be given to evidence-based strategies for promoting physical activity at both the community and individual levels. Such evidence-based strategies exist (Heath et al., 2006; Kahn et al., 2002). However, studies specifically examining the role of energy expenditure in the prevention of obesity are limited; rather, the literature generally has focused on combinations of energy expenditure and energy restriction for weight loss. Indeed, age, gender, genetics, physical fitness, and other factors all appear to contribute to slightly different levels of energy expenditure in different people. Thus, creating a single recommendation or target for physical activity to prevent obesity (without also considering energy intake) is nearly impossible. Some people are able to control their weight while being physically inactive, while others must constantly be physically active and restrict caloric intake to maintain a stable weight.
According to the 2008 Physical Activity Guidelines for Americans, “people who are at a healthy body weight but slowly gaining weight can either gradually increase the level of physical activity (toward the equivalent of 300 minutes a week of moderate-intensity aerobic activity), or reduce caloric intake, or both, until their weight is stable. By regularly checking body weight, people can find the amount of physical activity…” and the type of that activity that are individually effective in preventing unhealthy weight gain (HHS, 2008, p. 26). The guidelines further state that “it is important to remember that all activities—both routine and physical activity—‘count’ toward energy balance. Active choices, such as taking the stairs rather than the elevator or adding short episodes of walking to the day, are examples of activities that can be helpful in weight control” (HHS, 2008, p. 26). Associated with increases in physical activity, decreases in inactivity (or time spent at or near resting metabolism) should be minimized.
The amount of physical activity required to accelerate progress in obesity prevention requires understanding several concepts, including the volume, duration, intensity, and frequency of physical activity and volume of sedentary time:
• Total volume of physical activity is directly related to energy expenditure: the higher the total volume of physical activity, the higher the energy expenditure.
• The volume of physical activity in an individual in a defined time period is a function of duration (or length of time per physical activity event), absolute intensity, and frequency (or physical activity events per time period). Thus, the amount of activity is one expression of activity dose. Changes in duration, intensity, and frequency of physical activity will result in changes (increases or decreases) in energy expenditure. Energy expenditure is frequently used as a marker of activity dose.
• The intensity of the activity being performed is important. Intensity of physical activity is expressed as either relative or absolute. Relative intensity of physical activity is a measure of energy expenditure or work intensity based on the capacity of a person’s physiologic systems to exercise. For weight control, vigorous-intensity activity (done at or above 6 times resting metabolism) is far more time-efficient than moderate-intensity activity (between 3 and 5.9 times resting metabolism) (Physical Activity Guidelines Advisory Committee, 2008). For prevention of weight gain and, by extension, prevention of obesity, absolute intensity of physical activity appears to be more important than relative intensity. Absolute intensity is the energy or work required to perform a given activity independent of the physiologic capacity of the individual. For aerobic activity, absolute intensity can be expressed as the rate of energy expenditure (e.g., kilocalories per minute, multiples of resting energy expenditure [metabolic equivalent of the task, or MET]) or, for some activities, simply as the speed of the activity (e.g., walking at 3 miles per hour, jogging at 6 miles per hour). For resistance exercise, absolute intensity is expressed as total weight lifted or force exerted (e.g., pounds, kilograms) (Physical Activity Guidelines Advisory Committee, 2008).
• Changes in energy expenditure can be assessed by increases in the total volume of physical activity or by increases (or decreases) in the total volume of sedentary time. Sedentary time is defined as total time in a defined period that an individual may spend engaged in activities with an energy demand at or near that which is required at rest.
Although increased attention has been paid in recent years to understanding the role of sedentary behavior in health and specifically in weight control, very little information is currently available on the relationship between reduced sedentary behavior (time spent at or near resting metabolic rate) and obesity pre-
vention. A key part of obesity prevention is increased energy expenditure, and reducing sedentary behavior would appear to be a logical strategy for accomplishing this. It is unclear, however, whether a reduction in one type of sedentary behavior results in an actual increase in energy expenditure or a “transfer” of one sedentary behavior to another (e.g., reductions in television time may increase time spent reading or working at a computer). Studies of weight loss suggest that reductions in sedentary behavior (primarily television and video game time) may impact BMI (Robinson, 1999). However, evidence from recent randomized controlled trials suggests that the impact may paradoxically be due to changes in energy intake rather than expenditure (Epstein et al., 2008). More work is needed to understand the effectiveness of reducing sedentary behavior and its role in promoting energy expenditure for obesity prevention.
It is important to emphasize that the physical activity patterns of Americans cannot be changed solely by focusing on individual behaviors. Major technological innovations have substantially reduced the physical requirements of daily life. The dominance of the automobile as the most practical and convenient mode of personal travel and the steady decentralization of metropolitan-area population and employment (including schools, neighborhoods, shopping, and transit stops) to low-density, widely dispersed suburban locations have played a role in reducing physical activity (TRB and IOM, 2005). Barriers to walking, cycling, and other forms of physical activity for individuals and families are likely to differ among communities. And school-aged and more preschool-aged children in families with working parents are spending a significant amount of time in school and school-related activities and in child care for extended numbers of hours every day. Together, these environmental and lifestyle changes have influenced how much physical activity Americans engage in every day and where—recreationally, at home, at work, and everywhere in between.
To change American’s physical activity patterns, the committee recommends that promotion of physical activity be a health priority in all sectors and organizations where children, adolescents, and adults live, work, play, worship, and attend school. Increasing the prevalence of children, adolescents, and adults who meet the 2008 Physical Activity Guidelines for Americans (HHS, 2008), coupled with appropriate caloric intake, should accelerate progress toward obesity prevention. The Task Force on Community Preventive Services (Heath et al., 2006; Kahn et al., 2002) has offered evidence-based recommendations for strategies to increase physical activity. These recommendations can be defined operationally as focusing on (1) environmental and policy strategies to enhance opportunities for physical
activity, (2) strategies to promote school-based physical education and physical activity, and (3) individual behavior change strategies. The committee recommends these and other, related evidence-based strategies and implementing actions as the primary means of increasing physical activity in individuals and populations. These strategies and actions are detailed in the remainder of this chapter, with the exception of those related to physical education and opportunities for physical activity in schools, which are covered in Chapter 9, on school environments. Indicators for measuring progress toward the implementation of each strategy, organized according to the scheme presented in Chapter 4 (primary, process, foundational) are presented in a box following the discussion of that strategy.
STRATEGIES AND ACTIONS FOR IMPLEMENTATION
Strategy 1-1: Enhance the Physical and Built Environment
Communities, organizations, community planners, and public health professionals should encourage physical activity by enhancing the physical and built environment, rethinking community design, and ensuring access to places for such activity.
Potential actions include
• communities, urban planners, architects, developers, and public health professionals developing and implementing sustainable strategies for improving the physical environment of communities that are as large as several square miles or more or as small as a few blocks in size in ways that encourage and support physical activity; and
• communities and organizations developing and maintaining sustainable strategies to create and/or enhance access to places and programs where people can be physically active in a safe and enjoyable way.
Context
This strategy focuses on the environmental determinants of physical activity. The built environment is shaped by transportation and land use planning and policies, and can promote (or inhibit) physical activity during recreational/leisure time, work, household activities, and travel. It therefore provides an opportunity to address the decline in physical activity that has contributed to the obesity epidemic.
Over the past half-century, Americans have become more reliant on the automobile, and patterns of land use have been decentralized (TRB and IOM, 2005). These and other trends in travel behavior and where people live (urban, suburban, rural), changes in occupations, and zoning restrictions for mixed-use land development (e.g., for parking, multifamily houses, commercial use) have been influenced by institutional and regulatory policies and arrangements that have created today’s built environment. Additionally, some of these policies and arrangements may over time have reinforced economic and racial separation (TRB and IOM, 2005). These and other broad societal trends have been thought to reduce opportunities for daily purposeful physical activity, giving way to the need to emphasize leisure-time physical activity or recreational physical activity and exercise.
Three intersecting characteristics that influence physical activity are part of the built environment: transportation infrastructure, land use patterns, and urban design (Frank and Engelke, 2001; Frank et al., 2003). Transportation infrastructure comprises the built elements designed to connect facilities and services, including roads and interstate highways, trails, sidewalks, and bicycle paths. Land use patterns (how land is used) are commonly characterized as residential; commercial; office; industrial; and nonresidential, such as parks or open space. Finally, urban design (the shape, form, function, and appeal of public spaces) includes the appearance and arrangement of physical elements within public spaces.
With reference to physical activity, the built environment consists of three geospatial scales. The smallest scale is the building or site, such as places of employment or schools. Next is the street scale, conceptualized as one or more city blocks around a certain point. Finally, the community or regional level of the built environment can include an entire municipal or metropolitan area or district that can measure several square miles.
Evidence
The Task Force on Community Preventive Services (Heath et al., 2006) recommends the use of evidence-based environmental and policy strategies to increase physical activity. Environmental and policy strategies to promote physical activity are designed to create or enhance opportunities, support, and cues to help people be more physically active. They may involve changes to the physical and built environment, changes in organizational norms and policies, or legislation. These strategies often are combined with informational outreach activities to enhance their effectiveness. Creating or enhancing access to places for physical activity—such as through community-scale and street-scale urban design and land use
policies and practices—is one such evidence-based strategy found to be effective in increasing physical activity (Heath et al., 2006). Additionally, a recent review (Ding et al., 2011) suggests scientific support for environmental walkability, traffic speed/volume, access/proximity to recreation facilities, land use mix, and residential density as key environmental correlates of physical activity, specifically for children and adolescents. If coupled with restriction of energy intake, successful implementation of these strategies should accelerate progress toward obesity prevention.
Implementation
Enhancing the physical and built environment for physical activity involves changes in land use policies and practices designed to make entire communities and neighborhoods more amenable to physical activity, whether that activity is transportation related or exercise done purposefully in recreational or discretionary time. These changes can be applied to urban areas of several square miles or larger or to smaller, street-scale areas the size of a few square blocks. Implementation of many such changes is not a short-term strategy and will not likely result in immediate changes in physical activity patterns. Policy changes that seek to enhance the physical and built environment may take years to realize the goal of increasing physical activity participation.
Examples of communitywide strategies include improved connectivity of transportation arteries; landscaping and lighting to enhance the aesthetics and perceived safety of the community; tax incentives for developers to build sidewalks and trails in new developments; zoning changes to require pedestrian access; a communitywide program to encourage bicycling; coordinated policies to promote bicycle commuting; and community design planning and zoning that serve to increase the proximity of residential areas to such destinations as workplaces, schools, and areas for leisure and recreation to make them reachable safely by walking or bicycling. Examples of street-scale strategies include enhancements to increase safety and aesthetics for pedestrians and cyclists, such as marked street crossing areas or pedestrian bridges over multilane highways; traffic-calming strategies, such as traffic circles, stop lights, and signs or speed bumps; bicycle lanes; and lighting, landscaping, and repair of street-level eyesores such as broken windows and graffiti.
Studies that have examined the utility of increased access to opportunities for physical activity have focused on strategies that make it easier for people to be physically active by changing the physical environment. Converting a former
railroad bed to a hike and bike trail, reducing the cost of fitness center memberships for employees in a company (economic access), and unlocking the school playground basketball court so it can be used on weekends are all simple strategies for increasing access. Such efforts should be accompanied by appropriate (and targeted) information that will communicate the existence of the resource to users.
Indicators for Assessing Progress in Obesity Prevention for Strategy 1-1
Primary Indicator
• Increase in the proportion of children, adolescents, and adults meeting the 2008 Physical Activity Guidelines for Americans.
Sources for measuring indicator: BRFSS, NHANES, NHIS, YRBSS
Process Indicators
• Increase in the proportion of states and municipalities that adopt policies and supports for policies designed to promote enhancements to the physical and built environment that are supportive of increased physical activity.
Source needed for measurement of indicator.
• Increase in the proportion of municipalities that enhance their physical and built environment infrastructure in ways that support physical activity consistent with the Task Force on Community Preventive Services Recommendations.
Source needed for measurement of indicator.
• Increase in the proportion of municipalities with community-scale or street/neighborhood-scale enhancements that promote physical activity consistent with the Guide to Community Preventive Services Task Force Recommendations.
Source needed for measurement of indicator.
• Increase in the proportion of municipalities that adopt and implement policies designed to promote access to places to be physically active.
Source needed for measurement of indicator.
Foundational Indicators
• Increase in leadership in multiple sectors to increase awareness of the importance of the physical and built environment in promoting physical activity.
Source needed for measurement of indicator.
• Increase in awareness of neighborhood and community disparities in characteristics of the physical and built environment that support physical activity.
Source needed for measurement of indicator.
NOTES: BRFSS = Behavioral Risk Factor Surveillance System; NHANES = National Health and Nutrition Examination Survey; NHIS = National Health Interview Survey; YRBSS = Youth Risk Behavior Surveillance System.
Strategy 1-2: Provide and Support Community Programs Designed to Increase Physical Activity
Communities and organizations should encourage physical activity by providing and supporting programs designed to increase such activity.
Potential actions include
• developing and implementing ongoing physical activity promotion campaigns that involve high-visibility, multiple delivery channels and multiple sectors of influence;
• developing and implementing physical activity strategies that fit into people’s daily routines—strategies that are most effective when tailored to specific interests and preferences; and
• developing and implementing strategies that build, strengthen, and maintain social networks to provide supportive relationships for behavior change with respect to physical activity.
Context
Routine physical activity will not just happen. It is important to support this behavior change by improving knowledge of the benefits of physical activity, increasing awareness of opportunities for physical activity in a community, and helping people participate in the activities that are available (Kahn et al., 2002). Additionally, careful consideration of the needs of specific populations in developing physical activity programs will increase the effectiveness and success of these interventions (Ransdell et al., 2009).
Evidence
This strategy focuses on the individual determinants of physical activity. The Task Force on Community Preventive Services (Kahn et al., 2002) recommends the use of evidence-based informational and behavioral and social strategies to increase physical activity. Examples include communitywide campaigns and behavioral and social support strategies. Such strategies have been shown to be effective in organizations (such as worksites) and communities for increasing physical activity in target populations.
Implementation
Communitywide campaigns Communitywide campaign strategies involve broad, cross-sectoral (e.g., transportation, education, parks and recreation, business, other community-based sectors), highly visible approaches to promoting physical activity. Such efforts can be combined with dietary change campaigns or focused solely on physical activity promotion. Information outreach to support such efforts should use multiple media (e.g., television, radio, Internet) to raise awareness of the program, disseminate various physical activity-related health messages, and reinforce behavior change. Targeted mailings and communications with key influences on people’s attitudes and behavior, such as places of worship and community centers, can support the information campaign. Communitywide informational campaigns encompass many sectors. They frequently include highly visible, broadly targeted strategies and are part of broader health promotion strategies, such as heart disease prevention or cancer screening.
The scientific literature suffers from a lack of standardization in this area. Precise, unbiased and randomized evaluations of, and comparisons across, communitywide campaigns are difficult, and more proximal evidence may suggest an ambiguity in the effectiveness of such campaigns (Baker et al., 2011).
There is, however, reasonable evidence to support this type of strategy (Kahn et al., 2002), particularly if it is tailored to the target population. For example, the 10,000 Steps Rockingham program (Brown et al., 2006) was designed to increase physical activity in the entire adult population of Rockingham, Australia. The program made use of substantial social marketing strategies to increase awareness through information outreach, combined with other strategies, including use of pedometers. Results showed a nearly 5 percent increase in the number of women in the population who were classified as physically active relative to a comparison community. Although similar results were not found among men, these results suggest that such approaches can be effective.
Behavioral and social support strategies Behavioral and social support strategies for promoting physical activity involve either imparting behavior change and management skills or structuring the social environment so that it is conducive to such activity. Behavioral and social approaches may be designed to increase participation in physical activity as part of leisure, occupation, transportation, and/or at-home activities.
Individually adapted behavior change programs are tailored to the needs and preferences of individuals or groups. Such programs are designed to teach behavioral skills needed to make successful behavior adaptations to increase participation in physical activity. Social support strategies focus on building, strengthening, and maintaining social networks that provide supportive relationships for behavior change related to physical activity (e.g., setting up a buddy system, making contracts between people to complete specified levels of physical activity, establishing walking or other groups to provide friendship and support) (Task Force on Community Preventive Services, 2002). Social approaches are one way to make it easier to use those skills.
Largely unexplored, but with potential to increase the social support and behavioral strategies around individually adapted behavior change, are innovations in digital communications that allow for real-time prompting and tailoring of messaging relative to proximal circumstances. Such approaches, while transforming communication strategies in society at large, have only just begun to be integrated into health promotion strategies (Gibbons et al., 2011; Gold et al., 2011). Currently, there is no evidence of their effectiveness in physical activity promotion.
Indicators for Assessing Progress in Obesity Prevention for Strategy 1-2
Primary Indicator
• Increase in the proportion of children, adolescents, and adults meeting or exceeding the Physical Activity Guidelines for Americans.
Sources for measuring indicator: BRFSS, NHANES, NHIS, YRBSS
Process Indicator
• Increase in the prevalence of governmental and nongovernmental organizations offering physical activity programs for target populations.
Source needed for measurement of indicator.
NOTE: BRFSS = Behavioral Risk Factor Surveillance System; NHANES = National Health and Nutrition Examination Survey; NHIS = National Health Interview Survey; YRBSS = Youth Risk Behavior Surveillance System.
Strategy 1-3: Adopt Physical Activity Requirements for Licensed Child Care Providers
State and local child care and early childhood education regulators should establish requirements for each program to improve its current physical activity standards.
Potential actions include
• requiring each licensed child care site to provide opportunities for physical activity, including free play, and outdoor play, at a rate of 15 minutes per hour of care; as a minimum, immediate first step, each site providing at least 30 minutes of physical activity per day for half-day programs, and 1 hour for full-day programs.
Context
The first years of life are important to health and well-being throughout the life span. Data from the Centers for Disease Control and Prevention suggest that young children are not immune to the obesity epidemic. About 10 percent of infants and toddlers have high weight for length, and slightly more than 20 percent of children aged 2-5 are already overweight or obese (Ogden et al., 2010). Considerable evidence illustrates the importance of early-life strategies for the prevention of childhood overweight and obesity. Children do not “grow out of” obesity; rather, childhood obesity tends to persist into later life and can increase the risk for obesity-related disease in adulthood (IOM, 2011; Pocock et al., 2010).
The 2011 Institute of Medicine (IOM) report Early Childhood Obesity Prevention Policies notes that very little research has been conducted on the relationship between physical activity and health in infants, and that limited research has been undertaken on the relationship between physical activity and body weight in toddlers and preschoolers. Nonetheless, the prevalence of overweight and obesity clearly has increased in children within these age groups over the past 30 years (Ogden et al., 2010), and expert panels frequently have recommended that increased physical activity be targeted as one strategy for reducing the prevalence of obesity among these children (IOM, 2005; Strong et al., 2005).
The Early Childhood Program Participation Survey of the National Household Education Surveys Program found that approximately 80 percent of preschool-aged children with employed mothers were enrolled in some form of child care for an average of almost 40 hours a week (ECPP-NHES, 2006). Center-based care arrangements (e.g., child care centers, preschools, Head Start programs) were used by the majority of working parents; approximately 10 percent of working parents’ children were enrolled in family child care homes. With such a high proportion of preschool children in child care arrangements, it is important to consider the role of child care providers in ensuring that children are receiving adequate amounts of physical activity while in their care (Larson et al., 2011).
Evidence
The committee that developed the recent IOM report on obesity in early childhood (IOM, 2011) was charged with conducting a comprehensive examination of the literature on factors related to overweight and obesity in infants, toddlers, and preschoolers (aged birth to 5 years), with a focus on nutrition, physical activity, and sedentary behavior; identifying gaps in knowledge; and making recommendations for policies to prevent early childhood obesity, taking into account the differ-
ences between children aged birth to 2 years and 2 to 5 years. Because many children in this age group spend much of their time in child care settings, that committee also examined the role of child care providers in ensuring that infants and young children are receiving adequate time and opportunities for physical activity.
Studies have found that infants should be provided time each day to move freely and explore their surroundings, with adequate supervision and a secure perimeter; although evidence in this area is limited, physical activity in infancy may help control excessive weight gain and maximize infants’ developmental potential (IOM, 2011). In addition, studies suggest that structured physical activity sessions implemented in child care settings can be effective in increasing physical activity levels among preschool-aged children (Eliakim et al., 2007; Trost et al., 2008; Williams et al., 2009). The issue of whether prolonged bouts of sedentary behavior may have negative health consequences has been studied in adults (Hamilton et al., 2007; Hu et al., 2003) but not yet in young children. Nonetheless, the 2011 IOM report concludes that, based on the available data, it appears to be appropriate for young children to avoid long periods of inactivity in order to increase their opportunities for energy expenditure.
Implementation
After fully considering the available evidence, the committee that developed the 2011 IOM report formulated goals for increasing physical activity in young children. The report recommends asking child care regulatory agencies to “require child care providers and early childhood educators to provide infants, toddlers, and preschool children with opportunities to be physically active throughout the day,” and to “require child care providers and early childhood educators to allow infants, toddlers, and preschoolers to move freely by limiting the use of equipment that restricts infants’ movement and by implementing appropriate strategies to ensure that the amount of time toddlers and preschoolers spend sitting or standing still is limited.” The report also provides potential actions for achieving these goals. The report recommends further that, because physical activity in child care settings provides children with important opportunities to expend energy, child care facilities ensure that toddlers and preschoolers are active for at least one-quarter of the time they spend in the facility, a documented median of activity for children of this age (IOM, 2011).
Indicators for Assessing Progress in Obesity Prevention for Strategy 1-3
Primary Indicator
• Increase in the proportion of young children (aged 2-5) enrolled in child care facilities who meet the 2011 Institute of Medicine recommendations for physical activity among preschool-aged children.
Sources for measuring indicator: NHANES and additional sources could be determined
NOTE: NHANES = National Health and Nutrition Examination Survey.
Strategy 1-4: Provide Support for the Science and Practice of Physical Activity
Federal, state, and local government agencies should make physical activity a national health priority through support for the translation of scientific evidence into best-practice applications.
For federal-level government agencies, potential actions include
• the Department of Health and Human Services establishing processes for the regular and routine communication of scientific advances in understanding the health benefits of physical activity, particularly with respect to obesity prevention (these processes could include, but are not limited to, regularly scheduled updates of the Physical Activity Guidelines for Americans and reports of the U.S. Surgeon General); and
• all federal government agencies with relevant interests developing priority strategies to promote and support the National Physical Activity Plan, a trans-sector strategy for increasing physical activity among Americans.
For state and local health departments, potential actions include
• developing plans and strategies for making promotion of physical activity a health priority at the state and local levels.
Context
Evidence-based strategies that increase caloric expenditure, when balanced with appropriate caloric intake, are likely to accelerate progress toward obesity prevention. The substantive increases in physical activity necessary to accelerate progress on obesity prevention will be difficult to achieve unless government agencies make this a scientific and public health priority. This strategy focuses on making physical activity a priority at the national, state, and local levels by advancing the science and practice of physical activity promotion. Progress has begun on this recommendation, but sustained, concerted, and multilevel efforts must be strengthened and continued.
Implementation
The establishment of science-based guidelines and recommendations is a cornerstone of public health leadership. Because increases in physical activity are necessary to accelerate progress toward obesity prevention, advancing science with respect to understanding of the health effects of physical activity and effective strategies for physical activity promotion is critical. The first and only U.S. Surgeon General’s Report on Physical Activity and Health was published in 1996 (HHS, 1996), and the first and only comprehensive Physical Activity Guidelines for Americans were published by the Department of Health and Human Services in 2008 (HHS, 2008). These efforts served as point summaries for the state of the science regarding physical activity and health. Although the science base is continually expanding, however, there are currently no processes in place for regularly scheduled updates of these reports.
The U.S. Physical Activity Plan was published in 2009 (Coordinating Committee and Working Groups for the Physical Activity Plan, 2010). It represents the first comprehensive approach to organizing policies, programs, and initiatives that will increase participation in physical activity among the American population. Recommendations in the plan are organized around eight societal sectors: business and industry; education; health care; mass media; parks, recreation, fitness, and sports; public health; transportation; land use and community design; and volunteer and nonprofit. The long-term viability of the efforts asso-
ciated with the U.S. Physical Activity Plan is critical to creating a culture in the United States in which physical activity becomes and remains a health priority.
Texas and West Virginia recently developed plans to help make physical activity a state and local health priority (Duke, 2010; West Virginia Physical Activity Plan, 2010). These efforts are focused on translating evidence and national-level recommendations on strategies to promote physical activity for state and local organizations. Such efforts must be supported and maintained if physical activity is to become a national health priority.
Indicators for Assessing Progress in Obesity Prevention for Strategy 1-4
Process Indicator
• Increase in the prevalence of state and local public health planning efforts specifically designed to promote physical activity.
Source needed for measurement of indicator.
Foundational Indicators
• Processes in place for scheduled updates to the Physical Activity Guidelines for Americans.
Source needed for measurement of indicator.
• Evidence from federal agencies (e.g., HHS, DOT, DOE) and national nonprofits (e.g., YMCA, BGCA, NRPA) that the U.S. Physical Activity Plan is guiding decision making and program prioritization.
Source needed for measurement of indicator.
NOTE: BGCA = Boys and Girls Club of America; DOE = U.S. Department of Education; DOT = U.S. Department of Transportation; HHS = U.S. Department of Health and Human Services; NRPA = National Parks and Recreation Association; YMCA = Young Men’s Christian Association.
INTEGRATION OF STRATEGIES FOR ACCELERATING PROGRESS IN OBESITY PREVENTION
Increases in energy expenditure through increases in physical activity at the individual and population levels are central to maintaining energy balance and weight stability and therefore to obesity prevention. Evidence-based strategies for promoting physical activity exist, and implementation of these strategies, as well as strategies to help all children, adolescents, and adults avoid inactivity, should be a health priority for all sectors of society and all organizations.
Each individual strategy to increase physical activity proposed in this chapter has been shown to be effective in increasing physical activity. Taken together as part of an overall systems approach (Figure 5-1), these strategies, when coupled with appropriate energy intake, have the potential to substantially accelerate progress toward obesity prevention by helping all people meet the minimal physical activity guidelines set forth in the 2008 Physical Activity Guidelines for Americans (HHS, 2008).
Andersen, L. B., M. Harro, L. B. Sardinha, K. Froberg, U. Ekelund, S. Brage, and S. A. Anderssen. 2006. Physical activity and clustered cardiovascular risk in children: A cross-sectional study (the European Youth Heart Study). Lancet 368(9532):299-304.
Baker, P. R., D. P. Francis, J. Soares, A. L. Weightman, and C. Foster. 2011. Community wide interventions for increasing physical activity. Cochrane Database System Reviews (4):CD008366.
Brown, W. J., K. Mummery, E. Eakin, and G. Schofield. 2006. 10,000 steps Rockingham: Evaluation of a whole community approach to improving population levels of physical activity. Journal of Physical Activity and Health 3(1):1-14.
Caspersen, C. J., K. E. Powell, and G. M. Christenson. 1985. Physical activity, exercise, and physical fitness: Definitions and distinctions for health-related research. Public Health Reports 100(2):126-131.
CDC (Centers for Disease Control and Prevention). 2009. Physical activity—2009. Adults with 30+ minutes of moderate physical activity five or more days per week, or vigorous physical activity for 20+ minutes three or more days per week. http://apps.nccd.cdc.gov/BRFSS/list.asp?cat=PA&yr=2009&qkey=4418&state=All (accessed October 31, 2011).
Coordinating Committee and Working Groups for the Physical Activity Plan. 2010. US national physical activity plan. http://www.physicalactivityplan.org/ (accessed January 26, 2012).
Ding, D., J. F. Sallis, J. Kerr, S. Lee, and D. E. Rosenberg. 2011. Neighborhood environment and physical activity among youth a review. American Journal of Preventive Medicine 41(4):442-455.
Duke, H. P. 2010. Active Texas 2020. Taking action to promote physical activity. Washington, DC: Directors for Health Promotion and Education.
Eaton, D. K., L. Kann, S. Kinchen, S. Shanklin, J. Ross, J. Hawkins, W. A. Harris, R. Lowry, T. McManus, D. Chyen, C. Lim, L. Whittle, N. D. Brener, and H. Wechsler. 2010. Youth risk behavior surveillance—United States, 2009. Morbidity and Mortality Weekly Report Surveillance Summaries 59(5):1-142.
ECPP-NHES (Early Childhood Program Participation Survey of the National Household Education Surveys Program). 2006. Table 44. Number of children under 6 years old and not yet enrolled in kindergarten, percentage in center-based programs, average weekly hours in nonparental care, and percentage in various types of primary care arrangements, by selected child and family characteristics: 2005. http://nces.ed.gov/programs/digest/d09/tables/dt09_044.asp (accessed October 28, 2011).
Eliakim, A., D. Nemet, Y. Balakirski, and Y. Epstein. 2007. The effects of nutritional-physical activity school-based intervention on fatness and fitness in preschool children. Journal of Pediatric Endocrinology and Metabolism 20(6):711-718.
Epstein, L. H., J. N. Roemmich, J. L. Robinson, R. A. Paluch, D. D. Winiewicz, J. H. Fuerch, and T. N. Robinson. 2008. A randomized trial of the effects of reducing television viewing and computer use on body mass index in young children. Archives of Pediatrics and Adolescent Medicine 162(3):239-245.
Frank, L., and P. O. Engelke. 2001. The built environment and human activity patterns: Exploring the impacts of urban form on public health. Journal of Planning Literature 16:202-218.
Frank, L. D., P. Engelke, and T. L. Schmid. 2003. Health and community design: The impact of the built environment on physical activity. Washington, DC: Island Press.
Gibbons, M. C., L. Fleisher, R. E. Slamon, S. Bass, V. Kandadai, and J. R. Beck. 2011. Exploring the potential of Web 2.0 to address health disparities. Journal of Health Communication 16(Suppl. 1):77-89.
Gold, J., A. E. Pedrana, R. Sacks-Davis, M. E. Hellard, S. Chang, S. Howard, L. Keogh, J. S. Hocking, and M. A. Stoove. 2011. A systematic examination of the use of online social networking sites for sexual health promotion. BMC Public Health 11:583.
Hamilton, M. T., D. G. Hamilton, and T. W. Zderic. 2007. Role of low energy expenditure and sitting in obesity, metabolic syndrome, type 2 diabetes, and cardiovascular disease. Diabetes 56(11):2655-2667.
Heath, G. W., R. C. Brownson, J. Kruger, R. Miles, K. E. Powell, L. T. Ramsey, and Task Force on Community Preventive Services. 2006. The effectiveness of urban design and land use and transport policies and practices to increase physical activity: A systematic review. Journal of Physical Activity & Health 3(Suppl. 1):S55-S76.
HHS (U.S. Department of Health and Human Services). 1996. Physical activity and health: A report of the US Surgeon General. Washington, DC: HHS.
HHS. 2008. Physical activity guidelines for Americans. Washington, DC: HHS.
Hu, F. B., T. Y. Li, G. A. Colditz, W. C. Willett, and J. E. Manson. 2003. Television watching and other sedentary behaviors in relation to risk of obesity and type 2 diabetes mellitus in women. Journal of the American Medical Association 289(14):1785-1791.
IOM (Institute of Medicine). 2005. Preventing childhood obesity: Health in the balance, edited by J. P. Koplan, C. T. Liverman, and V. A. Kraak. Washington, DC: The National Academies Press.
IOM. 2011. Early childhood obesity prevention policies. Washington, DC: The National Academies Press.
Kahn, E. B., L. T. Ramsey, R. C. Brownson, G. W. Heath, E. H. Howze, K. E. Powell, E. J. Stone, M. W. Rajab, and P. Corso. 2002. The effectiveness of interventions to increase physical activity. A systematic review. American Journal of Preventive Medicine 22(Suppl. 4):73-107.
Larson, N., D. S. Ward, S. B. Neelon, and M. Story. 2011. What role can child-care settings play in obesity prevention? A review of the evidence and call for research efforts. Journal of the American Dietetic Association 111(9):1343-1362.
Ogden, C. L., M. D. Carroll, L. R. Curtin, M. M. Lamb, and K. M. Flegal. 2010. Prevalence of high body mass index in US children and adolescents, 2007-2008. Journal of the American Medical Association 303(3):242-249.
Physical Activity Guidelines Advisory Committee. 2008. Physical Activity Guidelines Advisory Committee report. Washington, DC: HHS.
Pocock, M., D. Trivedi, W. Wills, F. Bunn, and J. Magnusson. 2010. Parental perceptions regarding healthy behaviours for preventing overweight and obesity in young children: A systematic review of qualitative studies. Obesity Reviews 11(5):338-353.
Ransdell, L., M. Dinger, J. Huberty, and K. Miller. 2009. Developing effective physical activity programs. Champaign, IL: Human Kinetics.
Robinson, T. N. 1999. Reducing children’s television viewing to prevent obesity: A randomized controlled trial. Journal of the American Medical Association 282(16):1561-1567.
Strong, W. B., R. M. Malina, C. J. Blimkie, S. R. Daniels, R. K. Dishman, B. Gutin, A. C. Hergenroeder, A. Must, P. A. Nixon, J. M. Pivarnik, T. Rowland, S. Trost, and F. Trudeau. 2005. Evidence based physical activity for school-age youth. Journal of Pediatrics 146(6):732-737.
Task Force on Community Preventive Services. 2002. Recommendations to increase physical activity in communities. American Journal of Preventive Medicine 22(Suppl. 4):67-72.
TRB (Transportation Research Board) and IOM. 2005. Does the build environment influence physical activity? Examining the evidence. Washington, DC: National Academy of Sciences.
Trost, S. G., B. Fees, and D. Dzewaltowski. 2008. Feasibility and efficacy of a “move and learn” physical activity curriculum in preschool children. Journal of Physical Activity & Health 5(1):88-103.
West Virginia Physical Activity Plan. 2010. Active WV 2015. Can we do it? http://www.wvphysicalactivity.org/?pid=0 (accessed October 28, 2011).
Williams, C. L., B. J. Carter, D. L. Kibbe, and D. Dennison. 2009. Increasing physical activity in preschool: A pilot study to evaluate animal trackers. Journal of Nutrition Education and Behavior 41(1):47-52.


