
Assessing the Current Situation
Key Messages
• Populationwide obesity has serious health, economic, and social consequences for individuals and for society at large.
• Almost one-third of children and two-thirds of adults in the United States are overweight or obese.
• Although the vast majority of people who are obese are not poor or racial/ethnic minorities, the percentage of people within poor and ethnic minority populations who are affected by obesity is relatively higher, sometimes markedly so, for one or both sexes compared with the nonpoor or whites. Particular attention to these high-risk groups is essential in obesity prevention efforts.
• Causes of the high rates of obesity can be traced to trends in environmental influences on physical activity and food intake.
• Important advances have occurred in national guidance, policy, research directions, and partnership initiatives, as well as consensus on the need for a broad, prevention-oriented approach to the obesity epidemic. However, direct opposition to some potential obesity prevention strategies impedes their acceptance and implementation.
• Evidence that levels of obesity may be stabilizing may be an important sign that these advances are having a positive effect. However, complex realities associated with the obesity epidemic give rise to several considerations— including some that can serve as major roadblocks—that must be addressed when measures are taken to accelerate preventive efforts.
The process of developing strategies to accelerate obesity prevention begins with a situation assessment. This chapter provides such an assessment by presenting data on the consequences the nation faces if the epidemic persists; the starting point for acceleration of preventive efforts with respect to obesity prevalence in the general population and in populations at particularly high risk; contributory trends related to physical activity, food intake, and media use and other factors relevant to sedentary behavior; and positive steps that have already been taken and have momentum, along with the roadblocks that could limit further advances. The nature of change trajectories needed to track progress toward the goal of seeing obesity levels decline is also discussed.
HUMAN AND SOCIETAL CONSEQUENCES OF THE OBESITY EPIDEMIC
The consequences of today’s high rates of obesity have two broad dimensions. The first is the direct and sometimes devastating health and social consequences to individuals—the potential for illness or disability, social ostracism, discrimination, depression, and poor quality of life. The second dimension encompasses the indirect effects of obesity on society, reflected in population fitness, health care costs, and other aspects of the economy.
Human Costs
As shown in Table 2-1, obesity is associated with major causes of death and disability, as well as with psychosocial consequences that impair functioning and quality of life. The effect of obesity in predisposing to the development of type 2 diabetes is particularly strong, so much so that the onset of this disease—formerly observed only in adults—also now occurs during childhood (CDC, 2011). Adverse effects are observed throughout the life course and may be transmitted from mother to child through the characteristics of the gestational environment (IOM, 2009). According to current estimates, one-third of all children born today (and one-half of Latino and black children) will develop type 2 diabetes in their lifetime (Narayan et al., 2003). One dire projection is that obesity may lead to a generation with a shorter life span than that of their parents (American Heart Association, 2010; Olshansky et al., 2005).
The highest prevalence of obesity-related conditions occurs in middle-aged and older adults, with direct effects on quality of life and on rates of disease, disability, and death at an early age. High blood pressure is the most prevalent of these con-
TABLE 2-1 Physical Health, Psychosocial, and Functional Consequences of Obesity Over the Life Course
| Physical Health | Psychosocial | Functional |
|
• Cardiovascular disease • Cancer • Glucose intolerance and insulin resistance • Type 2 diabetes • Hypertension • Dyslipidemia • Hepatic steatosis • Choleslitasis • Sleep apnea • Reduction of cerebral blood flow • Menstrual abnormalities • Orthopedic problems • Gallbladder disease • Hyperuricemia and gout |
• Stigma • Negative stereotyping • Discrimination • Teasing and bullying • Social marginalization • Low self-esteem • Negative body image • Depression |
• Unemployment • Mobility limitations • Disability • Low physical fitness • Absenteeism from school or work • Disqualification from active service in the military and fire/police services • Reduced productivity • Reduced academic performance |
| SOURCE: Adapted from IOM, 2010a. | ||
ditions, and is a major risk factor for cardiovascular diseases. High blood pressure affects a third of U.S. adults aged 20 and over and more than half of adults aged 55 and older. Together high blood pressure, coronary heart disease, heart failure, and stroke affect 37 to 39 percent of women and men aged 40 to 59 and 72 to 73 percent of women and men aged 60 to 79. Eight percent of adults have a diagnosis of type 2 diabetes, another 3 percent are undiagnosed, and an additional 37 percent have prediabetes (Roger et al., 2011). Both high blood pressure and diabetes (diagnosed and undiagnosed) increased between 1988-1994 and 2005-2008 at the same time that increases in obesity were observed (see below). And a growing literature suggests various types of reductions in brain structural integrity (due to low blood flow to the brain) among both obese adolescents and adults (Gunstad et al., 2006; Maayan et al., 2011; Willeumier et al., 2011). In addition to these physical risks, obese adults face discrimination in employment settings and are subjected to inappropriate slurs and humor (Puhl and Heuer, 2001; Wear et al., 2006).
Obese children and adolescents also suffer an array of obesity-related comorbidities, ranging from sleep apnea, to type 2 diabetes, to hypertension, to liver disease, to orthopedic problems. These conditions over time may contribute to
shorter lifespans for obese children and adolescents. Poor health-related quality of life—physical, psychosocial, emotional, social, and school functioning—is 5.5 times greater in obese children and adolescents than in their normal-weight peers (Schwimmer et al., 2003). Childhood obesity is a major contributor to chronic illness and accounts for increased use of medication and physician visits and associated loss of school time (Van Cleave et al., 2010). Data suggest that obese children and adolescents miss more school days than their normal-weight peers regardless of age, ethnicity, sex, and school attended (Geier et al., 2007). And overweight or obese children and adolescents in every grade experience poorer academic outcomes than their normal-weight peers (Taras and Potts-Datema, 2005).
Box 2-1 puts a human face on a day in the life of obese children and adolescents. A study of adolescents found that nearly 30 percent of girls and 25 percent of boys were teased by peers about their weight, and 29 percent of girls and 16 percent of boys were teased by family members (Eisenberg et al., 2003). Teasing about weight is associated with depression, low self-esteem and body satisfaction, and suicidal thoughts and attempts (Eisenberg et al., 2003). Obesity associates individuals with “different” negative stereotypes, which can encourage others to stigmatize them and discount their worth (Gray et al., 2011; Vander Wal and Mitchell, 2011; Williams et al., 2008).
Economic and Societal Costs
Economic and societal costs (see Table 2-2) are linked to the impact of the outcomes shown previously in Table 2-1 on health care costs and productivity. Many health care expenditures are both a direct and indirect result of the current epidemic of overweight and obesity (Wolf, 1998; Wolf and Colditz, 1998). Direct costs include preventive, diagnostic, and treatment services related to obesity; indirect costs are those associated with morbidity and mortality. The estimated annual cost of obesity-related illness based on data from the Medical Expenditure Panel Survey for 2000-2005 is $190 billion (in 2005 dollars), which represents 20.6 percent of annual health care spending in the United States (Cawley and Meyerhoefer, 2011). Childhood obesity alone is responsible for $14.1 billion in direct medical costs (Trasande and Chatterjee, 2009).
Recent studies have modeled the economic benefits of reducing obesity prevalence in the U.S. population. Obesity is the major modifiable risk factor for the development of diabetes and also increases the risk of developing hypertension. It is estimated that reducing the prevalence of diabetes and hypertension by 5 percent would save approximately $9 billion annually in the near term; with resulting
BOX 2-1
Childhood Days: Stories from Life*
For many children and adolescents who are overweight or obese, childhood is a gauntlet of disappointment, depression, and disease. For example:
• Mark and Kathy bring their 3-year-old child to a health clinic. Both parents are obese. They are adamant: “We do not want our child to go through what we did as children.”
• Jonathan is 9 years old. He has sleep apnea, and must wear a heavy device on his face at night. This means he must take his “machine” for overnight visits with friends and relatives and try to explain why he is “different.”
• Kelly is 10 years old. She is depressed and has suicidal thoughts. She reports, “The teasing starts on the bus to school, continues through the school day, and all the way home.” She has changed schools, but the teasing has only started again.
• Tasha is an obese 15-year-old who loves soccer. She did well on the school team last year, but worries constantly that she won’t make the team next fall because of her weight.
• Marco is 17 years old, with obesity and hypertension. Asked about his plans for the future, he responds with emotion, “I’ve always wanted to become a firefighter, but I know I won’t be able to because of my weight.”
Similar stories about the challenges of living with obesity as an adult would remind us of the day-to-day burdens of living with hypertension, diabetes, or knee pain; the trips to doctors’ offices; and the costs and side effects of medication. Too often, the immediate response to life stories such as these can be, “Why don’t they just lose weight?” Yet data show that contemporary culture, economics, and society pose many barriers to the types of healthy diets that prevent obesity from occurring and to the difficult tasks of losing excess weight and sustaining lower weight levels.
![]()
*The individuals described in these illustrative examples are real pediatric patients; names have been changed for confidentiality.
TABLE 2-2 The Key Costs Identified from Research on the Economic Impact of Obesity
| Cost Category | Subcategories | Key Results, and Range of Estimates |
| Direct medical spending |
Relative medical costs for overweight (vs. normal weight) |
|
| Productivity costs | Absenteeism |
Excess days of work lost due to obesity |
| Presenteeism | National annual costs of presenteeism obesity Relative productivity loss due to obesity |
|
| Disability | Relative risk ratio of receiving disability income support |
|
| Premature mortality |
Years of life lost due to obesity QALYs lost due to obesity |
|
| Total | National annual indirect costs of obesity | |
| Relative Costs | Total Costs | Total Nondollar Amounts |
| 10-20% highera,b 36-100% highera-d |
||
| $14.3 billione,f $86-147 billion (total)c $640 billion (women 40-65 only)g |
||
| 1.02-4.72 daysh-j | ||
| 1.24-1.53 times higherj,k | ||
| $3.38-6.38 billion, or $79-132 per obese personj,l $57,000 per employeel (1998 USD) $8 billionm (2002 USD) |
||
| 1.5% higherj | ||
| 5.64-6.92 percentage points highern | ||
| 1-13 years per obese persono 2.93 million QALYs total in U.S. in 2004p |
||
| $5 (1994 USD)-$66 billionm,q | ||
| Cost Category | Subcategories | Key Results, and Range of Estimates |
| Transportation costs | Fuel costs | Annual excess jet fuel use attributable to obesity Annual excess fuel use by noncommercial passenger highway vehicles Additional fuel required in noncommercial passenger highway sector per lb of average passenger weight increase |
| Environmental costs |
OECD-wide CO2 emissions from transportation per 5 kg average weight per person |
|
| Human capital accumulation costs | Highest grade completed | |
| Days absent from school | ||
NOTES: OECD = Organisation for Economic Co-operation and Development; QALY = quality-adjusted life-years.
aThompson et al., 1999; bThompson et al., 2001; cFinkelstein et al., 2009; dThorpe et al., 2004; eCawley, 2010; fTrasande and Chatterjee, 2009; gGorsky et al., 1996; hPronk et al., 1999; iTsai et al., 2008; jTrogdon et al., 2008; kSerxner et al., 2001; lDurden et al., 2008; mRicci and Chee, 2005; nBurkhauser and Cawley, 2004; oFontaine et al., 2003; pGroessl et al., 2004; qThompson et al., 1998; rDannenberg et al., 2004; sJacobson and King, 2009; tJacobson and McLay, 2006; uMichaelowa and Dransfield, 2008; vGortmaker et al., 1993; wKaestner et al., 2009; xGeier et al., 2007.
SOURCE: Reprinted with permission from Diabetes, Metabolic Syndrome and Obesity: Targets and Therapy, volume 3, Hammond, R. A., and R. Levine, The economic impact of obesity in the United States, pages 285-295, Copyright 2010, with permission from Dove Medical Press Ltd.
reductions in comorbidities and related conditions, savings could rise to approximately $24.7 billion annually in the medium term (Ormond et al., 2011).
Many of these obesity-related health care costs are paid with public dollars. For example, it is estimated that total Medicare and Medicaid spending would be 8.5 percent and 11.8 percent lower, respectively, in the absence of obesity (Finklestein et al., 2009). Moreover, these health care costs are expected to rise significantly, since today’s increased rates of childhood obesity predict further increases in adult obesity and concomitant increases in hypertension, stroke, dyslipidemia, cancers (endometrial, breast, and colon), osteoarthritis, sleep apnea, liver and gall bladder disease, respiratory problems, and type 2 diabetes.
| Relative Costs | Total Costs | Total Nondollar Amounts |
| $742 million (2010 USD) $2.53-2.7 billion (2010 USD) $105 million per lb (2010 USD) |
350 million gallonsr 938 million-1 billion gallonss,t 39 million gallonst 10 million tonsu |
|
| 0.1-0.3 fewer grades completedv,w 1.2-2.1 more days absent from schoolx |
||
The U.S. economy struggles today to cope with health care spending; this struggle will grow progressively more difficult as today’s obese children mature. Beyond growing medical costs attributed to obesity, the nation will incur higher costs for disability and unemployment benefits. Businesses currently suffer because of obesity-related job absenteeism ($4.3 billion annually) (Cawley et al., 2007); these costs also will continue to grow. Societal expenses add to the effects of the reduced standard of living and quality of life experienced by affected individuals and their families.
Obesity has economic implications even in the absence of health detriments. For example, employers are less likely to hire obese than normal-weight indi-
viduals with the same qualifications; when hired, obese individuals are likely to report being paid lower wages and suffering other additional discrimination (Giel et al., 2010; Han et al., 2011). The result is underutilization of available skills at a cost to both society and individuals. The economic repercussions of discrimination affect families as well. Because decreased fitness in obese people may lead to increased health problems (IOM, 2010a) and reduced household income (Cawley, 2004; Puhl and Brownell, 2001), the additional struggles due to loss of health and income may in turn lead to an erosion of family cohesiveness and strength. Rising rates of obesity also affect national security; U.S. military leaders have recently described the role of obesity in reducing the pool of potential recruits to the armed services (Christeson et al., 2010).
These human and societal consequences clearly justify action. Agreement is now widespread that priority should be given to population-oriented preventive approaches that can curb the development or exacerbation of excess weight gain and obesity rather than to individual case finding and treatment. This applies not only to children and adolescents, so that lifelong prevention can begin as early as possible, but also to adults, among whom the health burdens of obesity are greatest. Even without further growth in current levels of overweight and obesity, future burdens of obesity-related illness, poor health, and quality of life will continue to grow significantly, as will the financial costs of health care for families, employers, health care institutions, and the public.
The United States continues to experience an epidemic of overweight and obesity that compels timely and effective action. Although obesity is not a new problem, the percentage of people affected was relatively stable until the 1980s, when it began to rise (NCHS, 2010). By adulthood, the prevalence of obesity is approximately twice that observed during childhood, reflecting both the tracking of child and adolescent obesity into adult years and the new onset of obesity as many adults experience gradual, progressive weight gain in their 20s, 30s, and 40s. Currently, a majority of U.S. adults and a substantial proportion of children and adolescents have weight levels in the overweight or obese range.
Definitions of Overweight and Obesity
Definitions of overweight and obesity for children, adolescents, and adults are provided in Box 2-2. According to these definitions, two-thirds of adult
BOX 2-2
Definitions of Overweight and Obese
Adults
Overweight is defined as a body mass index (BMI) (a ratio of weight in kilograms to the square of height in meters) of 25-29.9. Adults with a BMI of 30 or greater are considered obese. Among those who are obese, the increasing health risks at higher levels of weight are sometimes indicated by further classification into grades of increasing severity: grade 1 obesity is defined as a BMI of 30 to 34.9, grade 2 is a BMI of 35.0 to 39.9, and grade 3 is a BMI of 40 or greater.
Children and Adolescents
Overweight and obesity are defined by cutoffs on sex- and age-specific Centers for Disease Control and Prevention (CDC) BMI reference curves to account for growth and maturation: overweight, including obesity, is defined as a BMI at or above the 85th percentile; obesity is defined as a BMI at or above the 95th percentile.
Americans are overweight or obese, and the proportion who are obese has more than doubled since 1976-1980, when it was 15 percent (NCHS, 2011). Even more stunning is the parallel phenomenon in adolescents aged 12 to 19, among whom the 5 percent obesity prevalence of 1976-1980 has now more than tripled (NCHS, 2011). Figure 2-1 shows the consistent proportion of men and women in the overweight range (reflecting fewer people in the healthy weight range) but continuing trends of increasing obesity during the most recent two decades. In men, the prevalence of obesity increased by 13 percentage points from 1988 to 2008—from 19 percent to 32 percent—and doubled (from 5 percent to 11 percent) within the grade 2 obesity category. In women, obesity prevalence increased by 10 percentage points during the same period—from 25 percent to 35 percent—with a 7 percentage point increase in the grade 2 obesity category (from 11 percent to 18 percent) (NCHS, 2011). Figure 2-2 shows the steady gradient of increasing obesity preva-
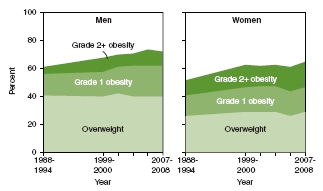
FIGURE 2-1 Overweight and obesity among adults aged 20 and over.
SOURCE: NCHS, 2011.
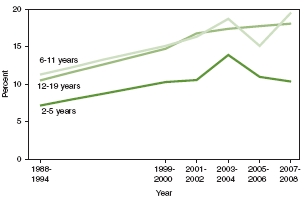
FIGURE 2-2 Obesity among U.S. children and adolescents by age, 1988-1994 through 2007-2008.
SOURCE: NCHS, 2011.
lence in children and adolescents in the 1990s—from 7 percent to 10 percent at ages 2 to 5, and from 11 percent to 15 percent at ages 6 to 11 and 12 to 19 (NCHS, 2011). Data for adults, children, and adolescents indicate flattening of trends in the most recent periods (Ogden et al., 2012).
The combined prevalence of overweight and obesity in children and adolescents aged 2 to 19 (i.e., at or above the 85th age-sex body mass index [BMI] percentile) in 2007-2008 was 32 percent for boys and 31 percent for girls (not shown in Figure 2-2) (Ogden et al., 2010a). Overweight and obesity affected 21 percent of both boys and girls aged 2 to 5 and 35 percent and 34 percent, respectively, of boys and girls aged 6 to 19 (Ogden et al., 2010a).
Data for the overall U.S. population do not reveal the particularly high obesity rates in some racial/ethnic minority populations and socioeconomic status groups. Adults, particularly women, children, and adolescents in the black and Mexican American populations, as well as people living below or near the poverty level, are at particularly high risk of obesity (Freedman, 2011). That is, although the vast majority of people who are obese are not minorities or poor, the percentage of people within racial/ethnic minority and poor populations who are affected by obesity is relatively higher, sometimes markedly so, for one or both sexes compared with whites or the nonpoor; higher obesity prevalence also is observed more in rural than in urban populations (Flegal et al., 2010; Liu et al., 2008; Ogden et al., 2010a,b,c; Patterson et al., 2004). In most cases, these demographic differences were observed before the obesity epidemic was evident in the general population, but obesity prevalence in these high-risk groups has tracked upward with increases in obesity affecting the population at large.
Figures 2-3 and 2-4 illustrate income-related differences in obesity prevalence in adults and children and adolescents, respectively, in the U.S. population overall and the increases in prevalence over time. The data are stratified by income categories using the poverty income ratio (PIR). The PIR adjusts income level for family size and farm-nonfarm income and expresses it as a ratio of the federal poverty threshold. It is used for determining eligibility for federal assistance programs such as the Supplemental Nutrition Assistance Program (SNAP, formerly known as the Food Stamp Program) and free or reduced-price school meals. For example, the cutoff for participation in SNAP is 130 percent of the PIR. Obesity is more prevalent in women and in children and adolescents of both sexes with incomes below 130 percent of the poverty level and least prevalent in those with incomes 350 percent or more above the poverty level (Ogden et al., 2010b,c). For example, obesity prevalence in 2005-2008 was 42 percent, 39 percent, and 29 percent in women in the low, middle, and high PIR categories, respectively (Ogden et al., 2010c). In children and adolescents (Figure 2-4), obesity prevalence in 2005-2008 was 21 percent versus 12 percent in boys in the low versus high PIR categories, and 19 percent versus 12 percent in girls in the low versus high PIR
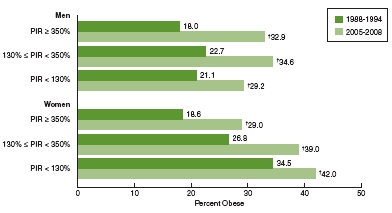
FIGURE 2-3 Prevalence of obesity among adults aged 20 and over by poverty income ratio and sex, United States, 1988-1994 to 2005-2008.
NOTES: PIR = poverty income ratio; = significant increase.
SOURCE: Ogden et al., 2010c.
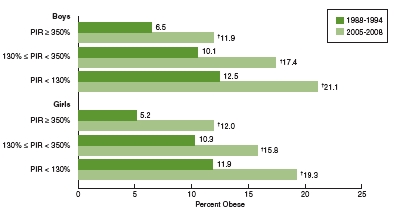
FIGURE 2-4 Prevalence of obesity among children and adolescents aged 2-19 by poverty income ratio and sex, United States, 1988-1994 to 2005-2008.
NOTES: PIR = poverty income ratio; = significant increase.
SOURCE: Ogden et al., 2010b.
categories (Ogden et al., 2010b). As illustrated by Figures 2-5 and 2-6 later in this section, some of the higher risk among women and children and adolescents in the low-income categories relates to the relatively higher proportions of blacks and Mexican Americans with incomes below or near the poverty level (NCHS, 2011).
Comparison of the light and dark green bars within each income category in Figures 2-3 and 2-4 shows the substantial increases in obesity prevalence over time. For example, in 1988-1994, the prevalence of obesity among men with incomes at or above 350 percent of the poverty level was 18 percent; in 2005-2008 this figure had increased to 33 percent (Ogden et al., 2010c). The corresponding figures for those with incomes below 130 percent of the poverty level were 21 and 29 percent. Similar increases occurred among women (Ogden et al., 2010c). In children and adolescents, the prevalence of obesity increased from 7 to 12 percent between 1988-1994 and 2005-2008 among boys living at or above 350 percent of the poverty level (Ogden et al., 2010b); among boys with incomes below 130 percent of the poverty level, the prevalence of obesity increased from 13 to 21 percent during this period (Ogden et al., 2010b).
In Figures 2-5 and 2-6, obesity prevalence for non-Hispanic blacks and Mexican American adults and children and adolescents, respectively, are shown alongside data for non-Hispanic whites to illustrate racial/ethnic disparities. The data are stratified by PIR to allow assessment of income differences in obesity prevalence within racial/ethnic categories. Figure 2-5 shows that black and Mexican American women—particularly black women—have higher obesity prevalence in all income categories, and that black and Mexican American men have higher obesity prevalence than white men in the highest income category. Figure 2-6 shows that Mexican American boys and black girls have higher obesity prevalence than others in all income categories with the exception of Mexican American girls in families with incomes 130 percent or more below the poverty level.
Taken together, these prevalence data emphasize the overall proportion of U.S. children and adults who are overweight or obese, the general trends of increase over time with some early signs that increases are abating, and the high risks in populations defined by poverty, race/ethnicity, or both poverty and race/ethnicity— indicating the need for particular attention to acceleration of obesity prevention efforts in these groups (also discussed in Chapter 3).
As noted in Chapter 1, the obesity epidemic in the general population and in pockets of high risk is attributable to changes in the environments in which
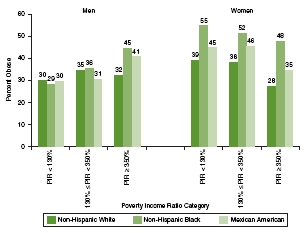
FIGURE 2-5 Obesity prevalence among adults aged 20 and older by sex and race/ethnicity within poverty income ratio categories, 2005-2008.
NOTE: PIR = poverty income ratio.
SOURCE: Ogden et al., 2010c.
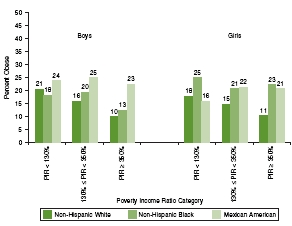
FIGURE 2-6 Obesity prevalence among children and adolescents aged 2-19 by sex and race/ethnicity within poverty income ratio categories, 2005-2008.
NOTE: PIR = poverty income ratio.
SOURCE: Ogden et al., 2010b.
Americans live that shape physical activity patterns and food consumption in people’s daily lives. In brief, children, families, and people in general are at every turn surrounded—even bombarded—by inducements that discourage physical activity and encourage overeating. People’s physiological systems are designed to eat whenever possible and to store energy as fat or muscle as a defense against the possibility of food scarcity. The physiological target for obesity prevention is balancing energy intake with the energy needed for bodily functions and physical activity to prevent the accumulation of excess body fat. Evidence of upward trends in weight levels indicates positive energy balance at a population level: on average, people are consuming energy in excess of their energy expenditure. There is no way for people to precisely monitor their energy balance on a day-to-day basis.
From an evolutionary perspective, people’s ability to metabolize food and their underlying genetic predispositions related to food do not change within a few decades. Although genes do influence individual differences in susceptibility to obesity, trends have increased; therefore, populationwide obesity can be explained only by changes in environments that have fostered changes in behaviors related to energy balance—that is, have led the average person to be less active, eat more, or both. Educating individuals about their physical activity and food environments and motivating them to behave in different ways is a key aspect of obesity prevention, but cannot be effective unless the environment is supportive.
Following an approach used in the 2005 Institute of Medicine (IOM) report on childhood obesity, several trends related to physical activity, sedentary behavior, and food consumption that potentially contribute to increased obesity prevalence are highlighted in Tables 2-3 through 2-5. Inferences about the role of these specific influences in causing obesity are based on correlations rather than direct evidence of causation, in part because no single trend is responsible.
Table 2-3 shows that, although both adults and children and adolescents reported increased leisure-time physical activity over time, recommended levels of physical activity were not being achieved. A barrier to engaging in physical activity that is often cited is the lack of time; at least for adults, however, the availability of leisure time has increased over time. Because recommended levels of physical activity still are not being met, low levels of or decreases in physical activity among adults or children and adolescents can reasonably be attributed to decreases in active transportation (walking or biking), decreases in the availability of physical education classes, and increased and heavy use of television and other electronic media. In current work and school environments, physical activity is not given priority; thus, people must try to fit physical activity into available leisure
TABLE 2-3 Trends in Physical Activity in U.S. Adults or the Overall Population and Children and Adolescents Over Time
| Variable | Changes in Adults or Overall Population Over Time |
Changes in Children and Adolescents Over Time |
| Availability of leisure time |
Increased (18-64 years of age)
• 1965 = 34.6 hr/weeka • 1985 = 39.4 hr/weeka • 2003 = 5.11 hr/dayb • 2009 = 5.25 hr/dayb |
Decreased (6-12 years of age)c • 1981 = ∼57 hr/week • 1997 = ∼50 hr/week • 2003 = ∼48 hr/week |
| Physical education classes attended daily |
Not applicable |
Decreased (high school students)d • 1991 = 41.6% • 1995 = 25.4% • 2009 = 33.3% |
| Leisure-time physical activity |
Increased (18+ years of age)e participating in leisure-time aerobic and muscle-strengthening activities that meet physical activity guidelines • 1999 = 15.0% • 2009 = 19.1% |
Increased (high school students participating in >1 sport)f • 1999 = 55.1% • 2009 = 58.3% |
| No leisure-time physical activity |
Decreased (18+ years of age)g • 1988 = 30.5% • 2008 = 25.1% |
Not reported |
| Meet physical activity guidelines |
Increased (18+ years of age)g • 1999 = 15.0% • 2009 = 19.1% |
2009 = Only 18.4% of high schoold students meeting guidelines |
| Active transport |
Decreased (employed individuals who walk to work)h • 1977 = 4.1% • 2009 = 2.8% |
Decreasedi (walk to school [5-15 years of age])
• 1977 = 20.2% of school trips • 2001 = 12.5% of school trips |
| SOURCES: aRobinson and Godbey, 1997; bBureau of Labor Statistics, 2004, 2010; cHofferth, 2009; dCDC, 2010b; eCDC/NCHS, 2011; fCDC, 2000, 2010b; gCDC, 2010a; hSantos et al., 2011; iSturm, 2005. | ||
time, where it competes with other pursuits. Table 2-4 provides a look at those key trends in media use that contribute to sedentary behavior.
Table 2-5 shows that trends of increased consumption of calories and foods in most categories were observed concurrently with increases in food availability, food portion sizes, and food consumption away from home. Consumption of dietary sweeteners and sweetened beverages, which has been directly associated with poor dietary quality and weight gain (DGAC, 2010; Woodward-Lopez et al., 2010) increased, while consumption of milk, which is more nutritious, decreased (Ogden et al., 2011; Woodward-Lopez et al., 2010). While increased consumption of fruits and vegetables and grains (not shown in Table 2-5) appears to be a positive trend, the increases were due largely to increased intake of high-caloric-density foods such as french fries and snack foods (Johnston et al., 2000; Lorson et al., 2009; USDA, 2003). Also not shown in Table 2-5 but clearly identified as a driver of caloric intake is increased marketing of high-calorie foods and beverages (Harris et al., 2010; Healthy Eating Research, 2011). The high availability of these foods and their heavy marketing compared with lower-calorie alternatives work in combination.
Trends illustrate that, for both children and adolescents and adults, requirements for physical activity have decreased while inducements to be inactive have increased, and food availability and consumption have increased. The challenges arise from the fact that these changes in environments for activity and eating reflect technological advances related to transportation or food manufacturing and to labor-saving devices in both home and work settings, communication patterns, and both occupational and recreational use of digital media. Impacts of these changes on the development of obesity are largely unintended consequences of changes in societal processes designed to achieve otherwise desirable economic and social goals (e.g., decrease in time allocated for physical education to increase time for academic work) or incidental to business imperatives within the profit-making sector (e.g., the food industry, the media industry, or employers in general). To prevent obesity, these trends must be considered to identify socially constructive ways to reverse or work around them. Addressing the obesity epidemic requires approaches that can disentangle societal development and technological progress from impacts on physical activity, eating, and related health outcomes (Uusitalo et al., 2002) and that make physical activity and healthy eating an individual and societal priority.
TABLE 2-4 Trends in Media Use That Influence Sedentary Behavior in U.S. Adults or Overall Population and Children and Adolescents Over Time
| Variable | Changes in Adults or Overall Population Over Time |
Changes in Children and Adolescents Over Time |
| Hours of media use | Not reported |
Increased (8-18 years of age)a • 1999 = 6:19 hr/day • 2004 = 6:21 hr/day • 2009 = 7:38 hr/day |
| Hours of television viewing |
Increased (15+ years of age)b • 2003 = 2.57 hr/day • 2009 = 2.82 hr/day |
Decreased (3-12 years of age)c • 1981 = 17:35 hr/week • 1997 = 13:29 hr/week Increased (8-18 years of age)a• 1999 = 3:47 hr/day • 2004 = 3:51 hr/day • 2009 = 4:29 hr/day |
| Internet adoption |
Increased (18+ years of age)d • 1995 = 14% use among U.S. adults • 2011 = 78% use among U.S. adults |
Increased (12-17 years of age)e • 2000 = 73% use among U.S. teens • 2009 = 93% use among U.S. teens |
| Home Internet access |
Increased (U.S. households)f • 1997= 18% • 2009 = 68.7% |
Increased (8-18 years of age)a
• 1999 = 47% • 2004 = 74% • 2009 = 84% |
| Hours of computer use | Not reported |
Increased (8-18 years of age)a
• 1999 = 0:27 hr/day • 2004 = 1:02 hr/day • 2009 = 1:29 hr/day |
| Hours of video game use | Not reported |
Increased (8-18 years of age)a
• 1999 = 0:26 hr/day • 2004 = 0:49 hr/day • 2009 = 1:13 hr/day |
| Social networking site use |
Increased (18+ years or age)g • 2005 = 8% use among U.S. adults • 2011 = 65% use among U.S adults |
Increased (12-17 years of age)h • 2006 = 55% use among teens • 2009 = 73% use among teens |
SOURCES: aRideout et al., 2010; bBureau of Labor Statistics, 2004, 2010; cHofferth and Sandberg, 2001;dPew Research Center, 2011a; ePew Research Center, 2011b; fU.S. Census Bureau, 2009; gMadden and Zickuhr, 2011; hLenhart et al., 2010.
TABLE 2-5 Trends in U.S. Food Supply and Consumption Relevant to Obesity Prevention Over Time
| Variable | Changes in Adults or Overall Population Over Time |
Changes in Children and Adolescents Over Time |
| Portion size |
Increased from 1977-1978 to 1994-1996 (2+ years of age)a • Soft drinks +49 kcal/day • Fruit drinks +50 kcal/day • Hamburgers +97 kcal/day • Cheeseburgers +136 kcal/day • Mexican fast food +133 kcal/day |
Increased from 1977-1978 to 2003- 2006 (2-18 years of age)b • Soft drinks increased ∼100 mL • Fruit drinks increased ∼43 mL • Hamburgers increased • Cheeseburgers increased • Pizza increased • Mexican fast food increased |
| Daily total energy intake |
Increasedc Males (20+ years of age) • 1971-1974 = 2,450 kcal/day • 2005-2008 = 2,656 kcal/day • 1971-1974 = 1,542 kcal/day • 2005-2008 = 1,811 kcal/day |
Increasedd (2-18 years of age) • 1977-1978 = 1,842 kcal/day • 1989-1991 = 1,802 kcal/day • 1994-1998 = 1,947 kcal/day • 2003-2006 = 2,022 kcal/day |
| Energy from carbohydrates |
Increasedc • Males (20+ years of age) • 2005-2008 = 47.4% IncreasedcFemales (20+ years of age) • 1971-1974 = 42.4% • 2005-2008 = 49.5% |
Increasede Boys (6-11 years of age) • 1977-1978 = 46.8% • 2007-2008 = 55.0% IncreasedeGirls (6-11 years of age) • 1977-1978 = 47.4% • 2007-2008 = 54.0% |
| Variable | Changes in Adults or Overall Population Over Time |
Changes in Children and Adolescents Over Time |
| Energy from fat |
DecreasedcMales (20+ years of age)
• 1971-1974 = 36.9% • 2005-2008 = 33.6% DecreasedcFemales (20+ years of age) • 1971-1974 = 36.1% • 2005-2008 = 33.8% |
Decreasede Boys (6-11 years of age) • 1977-1978 = 38.5% • 2007-2008 = 33.0% DecreasedeGirls (6-11 years of age) • 1977-1978 = 38.2% • 2007-2008 = 33.0% |
| Energy from protein |
Decreasedc Males (20+ years of age) • 1971-1974= 16.5% • 2005-2008 = 15.6% DecreasedcFemales (20+ years of age) • 1971-1974= 16.9% • 2005-2008 = 15.8% |
Decreasede Boys and girls (6-11 years of age) • 1977-1978 = 15.6% • 2007-2008 = 14.0% |
| Percentage of sugar-sweetened beverage consumption |
Increased (20+ years of age)f
• 1988-1994 = 58% • 1999-2004 = 63% |
Increased (2-19 years of age)g
• 1988-1994 = 79% • 1999-2004 = 81% |
| Percentage of daily energy eaten away from home | Not available |
Increased (2-18 years of age)d • 1994-1998 = 32.7% • 2003-2006 = 33.9% |
| Percentage of fast food consumed at home versus in store | Not available |
Increased (2-18 years of age)d • 1994-1998 = 38% • 2003-2006 = 49% |
SOURCES: aNielson and Popkin, 2003; bPiernas and Popkin, 2011; cCDC/NCHS, 2011; dPoti and Popkin, 2011; eEnns et al., 2002; USDA, 2010; fBleich et al., 2009; gWang et al., 2008.
ADVANCES DURING THE PAST DECADE AND BARRIERS TO FURTHER PROGRESS
Awareness of the obesity epidemic in the United States, first in adults and then in children and adolescents, emerged in the mid-1990s (Kuczmarski et al., 1994; Troiano et al., 1995). Since then we have come to realize not only that obesity causes multiple social and economic problems as described above, but also that it results from multiple changes in society that have affected many aspects of contemporary life, including activity patterns and food consumption. In 2001 The Surgeon General’s Call to Action to Prevent and Decrease Overweight and Obesity was issued (HHS, 2001). This call constituted official recognition of the obesity epidemic as a priority within the Department of Health and Human Services. It set forth principles for a nationwide public health response that would address the problem at multiple levels and involve multiple sectors of society and a broad array of public and private entities. The importance of facilitating individual weight management was emphasized, but there was also a strong emphasis on changing aspects of the environment viewed as contributory. In 2003, Dr. Elias Zerhouni, then Director of the National Institutes of Health, formed an organizationwide task force to develop a related research strategy. In 2004, this task force released a strategic plan that called for research across a spectrum of obesity-related topics and approaches and drew attention to the need for studies focusing on special populations at high risk of obesity. This plan was updated in 2011. These and several subsequent milestones and both public- and private-sector initiatives are highlighted in Table 2-6 and Box 2-3.
Included in Table 2-6 are several IOM reports that have provided a foundation for many of the policy and other initiatives that have been undertaken and that continue to inform the process of obesity-related policy and program development. These include Progress in Preventing Childhood Obesity: How Do We Measure Up? (IOM, 2007b), which offers specific guidance for foundations, industry, and government, and Local Government Actions to Prevent Childhood Obesity (IOM, 2009), which provides several examples of ways in which local government officials have promoted healthier lifestyles in their communities and recommends starting points that could help officials initiate childhood obesity prevention plans tailored to their jurisdictions’ resources and needs.
The committee highlights these milestones and initiatives to demonstrate that many of society’s stakeholders are acknowledging their responsibility to address obesity and are moving to respond. Although children have been a primary focus
TABLE 2-6 Selected Milestones in Obesity Prevention from the Past Decade
| 2001-2003a | 2004-2006b | 2007-2009c | 2010-2012d | |
| Federal guidance |
Surgeon General’s Call to Action to Prevent and Decrease Overweight and Obesity Formation of NIH Obesity Research Task Force |
Strategic Plan for NIH Obesity Research |
CDC’s first Weight of the Nation Conference 2008 Physical Activity Guidelines for Americans IWG in Food Marketing to Children- Tentative Proposed Nutrition Standards |
Launch of the First Lady’s Let’s Move Campaign White House Task Force Report on Childhood Obesity Prevention 2010 Dietary Guidelines for Americans Strategic Plan for NIH Obesity Research |
| Federal policy |
Child Nutrition and WIC Reauthorization, Public Law 108-265, 108th Cong., 2d sess. (June 30, 2004), 118, 729 Safe Routes to School Program. Safe Accountable, Flexible, and Efficient Transportation Equity Act: A Legacy for Users, Public Law 109-59, 109th Cong., 1st sess. (August 10, 2005), 119, 1404d |
ARRA funding for CDC’s “Communities Putting Prevention to Work” USDA interim rule to modify WIC food package |
Healthy, Hunger-Free Kids Act, Public Law 111-296, 111th Cong., 2d sess. (December 13, 2010), 124, 3183 |
|
| 2001-2003a | 2004-2006b | 2007-2009c | 2010-2012d | |
| Nonprofit and private sector |
Convergence Partnership for Healthy Eating and Active Living AHA and William J. Clinton Foundation Alliance for a Healthier Generation Children’s Food and Beverage Advertising Initiative |
RWJF commitment to reverse the childhood obesity epidemic by 2015 National Collaborative on Childhood Obesity Research (NCCOR) |
Partnership for a Healthier America (Let’s Move) Healthy Weight Commitment—food manufacturers commit to removing calories from the food supply |
|
| IOM guidance |
Preventing Childhood Obesity: Health in the Balance Food Marketing to Children and Youth: Threat or Opportunity |
Progress in Preventing Childhood Obesity: How Do We Measure Up? Nutrition Standards for Foods in Schools: Leading the Way Toward Healthier Youth Local Government Actions to Prevent Childhood Obesity |
School Meals: Building Blocks for Healthy Children Bridging the Evidence Gap in Obesity Prevention: A Framework to Inform Decision Making Early Childhood Obesity Prevention Policies |
|
NOTES: AHA = American Heart Association; ARRA = American Recovery and Reinvestment Act of 2009; CDC = Centers for Disease Control and Prevention; IOM = Institute of Medicine; IWG = Interagency Working Group; NIH = National Institutes of Health; RWJF = Robert Wood Johnson Foundation; USDA = U.S. Department of Agriculture; WIC = Special Supplemental Nutrition Program for Women, Infants, and Children.
SOURCE: aHHS, 2001; NIH, 2004; bAlliance for a Healthier Generation, 2005; Bell and Dorfman, 2008; Better Business Bureau, 2006; IOM, 2005, 2006b; NIH, 2004; cCDC, 2009a; FTC, 2009; HHS, 2008, 2009; IOM, 2007a,b, 2009; NCCOR, 2012; RWJF, 2007; USDA, 2007; dHealthy Weight Commitment Foundation, 2010; IOM, 2010a,b, 2011; Let’s Move Campaign, 2010; NIH, 2011; USDA/HHS, 2010; White House, 2010a,b.
BOX 2-3
National Initiatives to Address Obesity
• The 2004 Child Nutrition and WIC Reauthorization Act (Public Law 108-265, 108th Cong., 2d sess. [June 30, 2004], 118, 729) required that all local education authorities (i.e., school districts) receiving federal support for school meals create school wellness policies. These policies were to be developed with broad participation of parents, students, and school food providers and administrators. They were to specify goals for nutrition education, physical activity, and other school-based wellness activities, as well as standards for foods available on the school campus. The Healthy, Hunger-Free Kids Act of 2010 (Public Law 111-296, 111th Cong., 2d sess. [December 13, 2010], 124, 3183), which renewed the 2004 act, included several enhancements to this policy.
• The transportation bill of 2005 established the national Safe Routes to School (SRTS) program to allow and encourage more children to walk and bicycle safely to school. SRTS funding supports infrastructure changes to build roads, sidewalks, and bike lanes and pathways and also includes funding to support educational, promotional, and traffic enforcement activities (Public Law 109-59, 109th Cong., 1st sess. [August 10, 2005], 119, 1404).
• The Alliance for a Healthier Generation, a major public health campaign to address childhood obesity, was founded in 2005 as a partnership between the American Heart Association and the William J. Clinton Foundation. Alliance programs focus on children directly, as well as on school environments, health care institutions, and industry (Alliance for a Healthier Generation, 2005).
• The Convergence Partnership was formed in 2006 to “strengthen and accelerate multi-field, equity-focused efforts among practitioners, policymakers, funders, and advocates to create environments that support healthy eating and active living.” The partnership is a coalition of several foundations with an interest in this area: the California Endowment, Kaiser Permanente, Kresge Foundation, Nemours, the Robert Wood Johnson Foundation, and the W.K. Kellogg Foundation, as well as advisors from the Centers for Disease Control and Prevention (CDC) (Bell and Dorfman, 2008).
• Also in 2006, in response to an Institute of Medicine (IOM) report on food marketing to children (IOM, 2006a) and calls from the Federal Trade Commission for better regulation of marketing to children, the Children’s Food and Beverage Advertising Initiative was formed by several major food companies together
with the Council of Better Business Bureaus. The stated purpose of this initiative was to shift child-oriented advertising to a healthier mix of products (Better Business Bureau, 2006).
• In 2007, the Robert Wood Johnson Foundation, the nation’s largest health philanthropy, announced a $500 million commitment to reverse the epidemic of childhood obesity by 2015, to be implemented through a variety of research and programmatic funding activities nationwide (RWJF, 2007).
• The American Recovery and Reinvestment Act included $650 million in federal funding to support community-based prevention programs, leading to Communities Putting Prevention to Work initiatives in localities throughout the United States. More than half of these funds were awarded to projects that included a focus on obesity (HHS, 2009).
• In 2009, CDC convened an inaugural national Weight of the Nation conference to focus attention on obesity prevention efforts and share knowledge of promising or effective approaches from communities throughout the United States. A second conference will be held in 2012 (CDC, 2009b).
• The National Collaborative on Childhood Obesity Research (NCCOR) was created in 2009 as a collaborative among several components of the National Institutes of Health, CDC, and the Robert Wood Johnson Foundation, later joined by the U.S. Department of Agriculture. NCCOR leverages the diverse resources of these entities to create innovative funding initiatives and tools to support research and practice related to childhood obesity (NCCOR, 2012).
• The U.S. Department of Agriculture issued an interim rule to modify the Special Supplemental Nutrition Program for Women, Infants, and Children (WIC) food package along lines recommended in an IOM report on this topic (IOM, 2006b), focused in particular on improving the appropriateness of the package for obesity prevention and control. The interim rule was implemented program-wide and is pending finalization (USDA, 2007).
• First Lady Michelle Obama came forward as a champion for the childhood obesity prevention effort, launching a multicomponent Let’s Move campaign to promote healthier environments and behaviors related to physical activity and eating in schools, homes, and communities (White House, 2010a).
• In conjunction with the launch of Let’s Move, President Obama formed a White House Task Force on Childhood Obesity (2010) under the leadership of the White House Domestic Policy advisor, with a mandate to develop an interagency plan for solving the childhood obesity problem within a generation. Task force members include senior-level representation from across government, including the Departments of Agriculture, Health and Human Services, Education, and the Interior; the Office of Management and Budget; the First Lady’s Office; and the Assistant to the President for Economic Policy. A few months later, the task force issued the requested report, which included 79 recommendations (White House, 2010b; White House Task Force on Childhood Obesity, 2010).
• Also in conjunction with Let’s Move, a new foundation—the Partnership for a Healthier America—was formed with the First Lady as honorary chair and two prominent policy makers as honorary vice chairs. The foundation is intended to serve as an independent, transparent mechanism for developing and tracking major private-sector commitments to facilitating the reduction of childhood obesity (Let’s Move Campaign, 2010).
• A large coalition of food and beverage manufacturers—the Healthy Weight Commitment Foundation—announced a pledge to the Let’s Move campaign to remove 1.5 trillion calories from the food supply by 2015 (Healthy Weight Commitment Foundation, 2010).
• In response to a congressional mandate, CDC, the Federal Trade Commission, the Food and Drug Administration, and the U.S. Department of Agriculture formed an Interagency Working Group to develop guidelines for food and beverage advertising to children and adolescents aged 2 to 17. The preliminary standards were released for public comment in December 2010 (FTC, 2010).
• The 2010 revision of the Dietary Guidelines for Americans was framed with particular reference to the importance of avoiding obesity. The guidelines include explicit advice related to foods that should be reduced in the diet as well as those that should be increased to achieve a better overall balance within calorie limits (USDA/HHS, 2010).
of these efforts, changes in society aimed at preventing child obesity will impact adults as well.
Figures 2-7 and 2-8, which display counts of media reports related to obesity generally or childhood obesity specifically, demonstrate the tremendous increase in public awareness that has led to or accompanied widespread efforts to address obesity, both in the United States and globally. Similar counts have been made of increases in the development of state and local policies designed to improve information available to parents and consumers, improve opportunities for physical activity, and introduce incentives to support better availability of healthy foods and discourage consumption of unhealthy foods and beverages. For example, the Trust for America’s Health (TFAH) publishes an annual compilation of the current status of each state’s obesity and related health profiles, as well as legislative actions aimed at obesity reduction (Trust for America’s Health and RWJF, 2011). Highlights of TFAH’s 2011 report are presented in Box 2-4. In reflecting on the data 10 years after his 2001 Call to Action (HHS, 2001), former Surgeon General Dr. David Satcher concluded that important progress has been made, but that much more remains to be done (Trust for America’s Health and RWJF, 2011). He also concluded that even though individuals bear responsibility for their own health, the public and private sectors must get involved to enable an environment that fosters healthy living.
Both public and private employers are offering health and wellness programs to workers (Claxton et al., 2010), including policies that support breastfeeding mothers (see the discussion in Chapter 8). Such policies are important as breast-feeding may be beneficial for obesity prevention in both children and their mothers (IOM, 2009, 2011; Moreno et al., 2011).
Clearly, however, not all developments during this period have been favorable. Indeed, many countering forces act as barriers to further progress. Some relate to competing priorities and limited resources. For example, the most frequently cited barriers to offering physical activity opportunities for students during the school day are priority given to time for academic work and limited resources and staff capacity for physical education programs (Agron et al., 2010; Young et al., 2007). Other barriers reflect more deliberate opposition to change from commercial vested interests. In particular, food and beverage companies are strongly opposed to statutory regulations on advertising or other aspects of marketing, preferring that any changes be voluntary. Chapter 10 provides a broader discussion of the challenges related to opposing views of what should be done to address obesity and who should take responsibility for doing it.
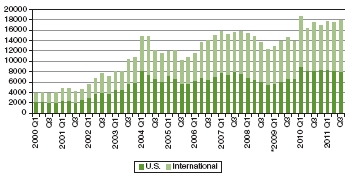
FIGURE 2-7 Global trends in obesity-related media coverage from the first quarter of 2000 through the third quarter of 2011.
NOTE: Figures retrieved from Lexis-Nexis searches on “obesity or obese” in U.S. and international newspapers and newswires, and beginning in the first quarter of 2009 (as indicated by *), online news sources.
SOURCE: Reprinted from IFIC, 2011.
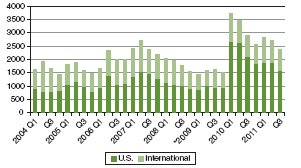
FIGURE 2-8 Global trends in childhood obesity-related media coverage from the first quarter of 2004 through the third quarter of 2011.
NOTE: Figures retrieved from Lexis-Nexis searches on “childhood obesity” in U.S. and international newspapers and newswires, and beginning in the first quarter of 2009 (as indicated by *), online news sources.
SOURCE: Reprinted from IFIC, 2011.
BOX 2-4
Major State Legislative Efforts Identified in the 2011 Fat as in Fat report
• Twenty states and Washington, DC, have stricter school meal standards than the U.S. Department of Agriculture (USDA). Seven years ago, only four states had standards that were stricter than USDA requirements.
• Thirty-five states and Washington, DC, have nutritional standards for competitive foods. Seven years ago, only six states had nutritional standards for competitive foods.
• Twenty-nine states and Washington, DC, limit when and where competitive foods may be sold beyond federal requirements. Seven years ago, 17 states had laws regarding when and where competitive foods can be sold that were stricter than federal requirements.
• Every state has some physical education requirements for students. However, these requirements often are limited or not enforced, and many programs are inadequate.
• Twenty-one states have legislation that requires body mass index (BMI) screening or weight-related assessments other than BMI for children and adolescents in school. Seven years ago, only four states required BMI screening or other weight-related assessments for children and adolescents in school.
• Twenty-six states and Washington, DC, currently have farm-to-school programs. Five years ago, only New York had a law that established a farm-to-school program.
• Sixteen states have passed complete streets laws. Seven years ago, only five states had complete streets laws.
• Thirty-four states and Washington, DC, have sales taxes on sodas.
• Four states have laws requiring the posting of nutrition information on menus and menu boards in chain restaurants with 20 or more in-state locations.
SOURCE: Trust for America’s Health and RWJF, 2011. Adapted with permission of Trust for America’s Health (TFAH), Washington, DC.
Partly because of the combination of facilitating and countering influences, outcomes of efforts to address obesity have yet to yield a clear picture showing that obesity levels are on the decline. Given increased public awareness and the continually growing number and diversity of positive initiatives, however, there are many indications that the time is ripe for responding to recommendations for mounting a more aggressive and comprehensive obesity prevention effort.
It is generally understood that even when promising interventions are identified, the effects of social and economic phenomena that have evolved over decades cannot be turned around overnight. Nevertheless, given that substantive efforts to address the obesity epidemic have now been in place for at least a decade (e.g., since the 2001 U.S. Surgeon General’s Call to Action [HHS, 2001]), it is reasonable to ask whether there are signs of progress. The ability to track changes in population weight status depends on the collection of weight and height measurements (or self-reported data, with recognition of the substantial potential for error in such data) in community settings and at the state and federal levels for use in assessing average BMI and the percentage of children, adolescents, and adults who are overweight or obese. Particularly salient will be evidence of reduced incidence of new cases of obesity and favorable shifts in the overall BMI distribution such that the percentage of the population in the healthy weight range increases, with attention to other goals as appropriate to ensure the overall quality of the way in which BMI changes are being achieved. Data with which to assess overweight and obesity levels and BMI distributions in the United States are collected on an ongoing basis through the National Health and Nutrition Examination Survey (NHANES) and reported regularly by the National Center for Health Statistics (NCHS, 2011), and are also collected in some states (Flegal et al., 2010; Ogden et al., 2010a, 2012). Analyses of these data include assessment of changes in prevalence trends and in recent years have indicated changes that may signify the beginnings of a leveling off of the epidemic, but without downward movement.
At the national level, obesity prevalence data for both children and adolescents and adults suggest that although high levels persist, trends of increase are absent or variable, depending on the population subgroup examined (Flegal et al., 2010; Ogden et al., 2010a,b,c, 2012). No statistically significant trend of increase in obesity among women was observed during the 10 years prior to 2009-2010, both overall and by racial/ethnic subgroups (non-Hispanic whites, non-Hispanic blacks, and Mexican Americans). However, significant increases in obesity prevalence
were apparent in men for at least the first part of this time period, overall and for non-Hispanic white and non-Hispanic black men (Flegal et al., 2010; Ogden et al., 2012). Findings were similar in children and adolescents: BMI distributions in the 10-year period before 2009-2010 were stable in girls in all racial/ethnic groups; in boys, a significant increase in BMI was observed only at ages 6 to 19 and only in the highest BMI category (at or above the 97th percentile) (Ogden et al., 2010a, 2012). The Pediatric Nutrition Surveillance System, which reports data on children aged 0-5 from low-income families participating in federal nutrition programs, reported this phenomenon based on data obtained from 2003 to 2008 (CDC, 2009b); the self-report data from youth in grades 9 through 12 that were collected between 2005 and 2007 yielded a similar picture (CDC, 2010b; Eaton et al., 2008).
The possibility that obesity prevalence trends are stabilizing was supported by a comparative analysis of the trends in several countries that have also been undertaking initiatives to curb rising obesity levels. Data from nine countries (Australia, China, England, France, the Netherlands, New Zealand, Sweden, Switzerland, and the United States) suggest that among children and adolescents aged 2-19, the mean (SD) unweighted rate of change in the prevalence of overweight and obesity was +0.00 (0.49) percent per year between 1995 and 2008 (+0.01 [0.56] percent for overweight alone and –0.01 [0.24] percent for obesity alone) (Olds et al., 2011). It is unclear why prevalence appears to be flattening. Olds and colleagues (2011) hypothesize that stabilization may be occurring as a result of the numerous public health campaigns and interventions that have been aimed at childhood obesity for the past several years beginning to have a cumulative effect and the rates of childhood overweight and obesity reaching a saturation point of equilibrium. However, self-selection bias in the available data cannot be ruled out (because of increased awareness of childhood obesity and perceived stigmatization, parents have declined participation in later measurement years compared with the baseline). Moreover, while rates, which still remain high, appear to be stabilizing, it is unclear whether this stabilization will continue over the long term or merely represents a temporary lull (Olds et al., 2011).
There is also evidence of improvements in obesity trends at the state level. Measured BMI data were collected in Arkansas from approximately 400,000 students in all K-12 grades for 2003-2007 and for nearly 180,000 students in grades K, 2, 4, 6, 8, and 10 during 2008-2010. The prevalence of overweight vacillated only slightly over the 7-year period, beginning at 21 percent in school year 2003-2004 and ending at 17 percent in 2009-2010 (ACHI, 2011). Similarly, rates of obesity were 20.9 percent in 2003-2004 and 21.0 percent in 2009-2010. Thus
while the rates in Arkansas were higher than the national rates, the change in rates over the 7-year period mirrored the phenomenon of leveling observed in the national data. The Obesity and School BMI Measurement Initiative is but one part of a multipronged statewide effort to improve the health of Arkansas children that is being spearheaded by the Arkansas Center for Health Improvement (Raczynski et al., 2009). Hence, the potential for analyses linking observed BMI changes to effects of interventions may exist.
Two reports chronicle changes in BMI among children and adolescents in California between 2001 and 2008. Unlike Arkansas, California mandated measuring students at only three grade levels: grades 5, 7, and 9. Given the size of the state, the BMI data set over this 8-year time period contains more than 8 million student height and weight records. The analysis of this data set by Sanchez-Vaznaugh and colleagues (2010) reveals a lessening of the BMI upward slope between the years prior to versus the years after the 2004-2005 school year. The authors postulate that statewide policies limiting competitive foods and beverages in K-12 schools may have been associated with this observed leveling of the BMI slope. While the overall pattern of change in overweight and obesity in California children and adolescents mirrored that of the nation, with only a slight change between 2001 and 2008 (overweight rates were 38.3 percent in 2001 and 38.0 percent in 2008, while obesity in the same cohort was 20.3 percent in 2001 and 19.8 percent in 2008), the data reveal distinctly different patterns of BMI change by race/ethnicity (Madsen et al., 2010). A population-based decline in the prevalence of high BMI after 2005 was observed among most boys and for white girls. Even rates for Hispanic boys, a group with a high prevalence of obesity, declined during this period. The rates for Hispanic girls leveled, while the rates for black and American Indian girls continued to climb during the 8-year period. The leveling phenomenon that is documented by the NHANES analyses also may reflect a combination of patterns unique to different racial/ethnic groups, with some rates declining, some leveling, and others continuing to rise. Thus while obesity rates may appear to be improving slightly, the disparities in rates may actually be widening. Interpretation of these trends is complicated because these are cross-sectional data and because it is difficult to know over what time period changes in trends can be considered to signify probable future patterns of stabilization and eventually decreases. Complementary analyses would include examination of longitudinal data to track weight changes over time and determine whether the percentage of children, adolescents, or adults becoming obese at any given age is decreasing. If so, this would suggest promising future trends, particularly if it were to be observed in
the youngest children. Regardless, any sign of a flattening of trends of increase is potentially favorable and warrants close attention to potential contributors.
The possible effects of the economic recession on trends in obesity are unclear. Ludwig and Pollack (2009) have raised the possibility that an increase in obesity is associated with the economic recession because limited incomes may increase reliance on low-cost, high-calorie foods (although the authors note that this situation also may provide opportunities for new initiatives to address obesity). In contrast, an analysis in The Economist suggests that trends in consumer spending may have positive health effects, including more spending on fruits and vegetables and less spending on sugar and sweets (The Economist, 2011). Effects could differ for different population groups. In any case, secular trends reflecting population responsiveness to economic constraints would not represent a desirable or sustainable long-term context for achieving and maintaining healthy population weights.
Prior to the late 20th century, overweight and obesity were not considered a populationwide health risk. Instead, food scarcity and hunger were the primary food-related public policy issues. An assessment of the current situation highlights the pressing need for populationwide efforts to address obesity among adults and children and adolescents, with a particular emphasis on high-risk groups for whom the general efforts may be insufficient to close gaps. Even today, many people may regard “baby fat” and childhood “chubbiness” as indicators of good health and/or economic security, and fail to recognize the relationship of obesity to many serious chronic diseases and economic and societal costs. Asserting that people should simply eat less or that parents should simply feed their children better ignores these historical perspectives and the complex societal influences at work. A strategy that assumes that parents or others have or should have an inherent skill set to bear the sole responsibility for preventing obesity for their children or for themselves is unlikely to be successful. Instead, obesity prevention approaches require modifying factors that shape individual choices and incidental behaviors (Kumanyika, 2008).
The committee’s vision for obesity prevention rests on the ability to modify factors that shape individual choices, as well as behaviors that are natural and unconscious responses to environmental cues and situations. These factors are varied, complex, and interrelated, and numerous small changes may contribute collectively to influencing population shifts. Some evidence indicates that trends of continuing increases in obesity prevalence may be leveling off, although this obser-
vation does not apply evenly across all population subgroups and also may not be sustained or lead to a lessening of the current high rate. Contributors to these potential precursors of success must be identified and translated into approaches for permanent change. Of greatest importance in this respect is that early signs of success, even if real, not be misunderstood to be success. Success will occur once population weight levels are in a healthy range. All of the adverse consequences— human and economic—of the obesity epidemic described here are entrenched and will continue to increase as children and adolescents on a course to become obese mature. The next chapter of this report describes specific goals and strategies for addressing obesity and examines practical and policy considerations relevant to their implementation.
ACHI (Arkansas Center for Health Improvement). 2011. Combating childhood obesity. http://www.achi.net/ChildObDocs/2004%20Statewide%20BMI%20Report.pdf (accessed October 14, 2011).
Agron, P., V. Berends, K. Ellis, and M. Gonzalez. 2010. School wellness policies: Perceptions, barriers, and needs among school leaders and wellness advocates. Journal of School Health 80(11):527-535.
Alliance for a Healthier Generation. 2005. Clinton Foundation and American Heart Association form alliance to create a healthier generation. http://www.healthiergeneration.org/uploadedFiles/For_Media/afhg_nr_alliance_formation_5-3-05.pdf (accessed January 4, 2012).
American Heart Association. 2010. Understanding childhood obesity. http://www.heart.org/idc/groups/heart-public/@wcm/@fc/documents/downloadable/ucm_304175.pdf (accessed December 29, 2011).
Bell, J., and L. Dorfman. 2008. Introducing the healthy eating active living convergence partnership. http://www.convergencepartnership.org/atf/cf/%7B245A9B44-6DED-4ABD-A392-AE583809E350%7D/CP_Introduction_printed.pdf (accessed January 4, 2012).
Better Business Bureau. 2006. New food, beverage initiative to focus kids’ ads on healthy choices; revised guidelines strengthen CARU’s guidance to food advertisers. http://www.bbb.org/us/article/new-food-beverage-initiative-to-focus-kids-ads-on-healthy-choices-revised-guidelines-strengthen-carus-guidance-to-food-advertisers-672 (accessed January 4, 2012).
Bleich, S. N., Y. C. Wang, Y. Wang, and S. L. Gortmaker. 2009. Increasing consumption of sugar-sweetened beverages among US adults: 1988-1994 to 1999-2004. The American Journal of Clinical Nutrition 89(1):372.
Bureau of Labor Statistics. 2004. Time use survey—first results announced by BLS. Washington, DC: U.S. Department of Labor.
Bureau of Labor Statistics. 2010. American time use survey—2009 results. Washington, DC: U.S. Department of Labor.
Burkhauser, R. V., and J. Cawley. 2004. Obesity, disability, and movement onto the disability insurance rolls. http://www.mrrc.isr.umich.edu/publications/Papers/pdf/wp089.pdf (accessed December 29, 2011).
Cawley, J. 2004. The impact of obesity on wages. Journal of Human Resources 39(2):451-474.
Cawley, J. 2010. The economics of childhood obesity. Health Affairs 29(3):364-371.
Cawley, J., and C. Meyerhoefer. 2011. The medical care costs of obesity: An instrumental variables approach. Journal of Health Economics 31(1):219-230.
Cawley, J., J. A. Rizzo, and K. Haas. 2007. Occupation-specific absenteeism costs associated with obesity and morbid obesity. Journal of Occupational and Environmental Medicine 49(12):1317-1324.
CDC (Centers for Disease Control and Prevention). 2000. Youth Risk Behavior Surveillance—United States, 1999. Morbidity and Mortality Weekly Report Surveillance Summaries 49(SS-5):1-95.
CDC. 2009a. Obesity prevalence among low-income, preschool-aged children—United States, 1998-2008. Morbidity and Mortality Weekly Report 58(28):769-773.
CDC. 2009b. Weight of the Nation conference. http://www.cdc.gov/nccdphp/DNPAO/news/conferences/won.html (accessed January 4, 2012).
CDC. 2010a. 1988-2008 no leisure-time physical activity trend chart. http://www.cdc.gov/nccdphp/dnpa/physical/stats/leisure_time.htm (accessed December 14, 2011).
CDC. 2010b. 1991-2009 High School Youth Risk Behavior Survey data. http://apps.nccd.cdc.gov/youthonline. (accessed November 11, 2011).
CDC. 2011. Diabetes public health resource. http://www.cdc.gov/diabetes/projects/cda2.htm (accessed September 21, 2011).
CDC/NCHS (National Center for Health Statistics). 2011. Health, United States, 2010: With special feature on death and dying. http://www.cdc.gov/nchs/data/hus/hus10.pdf (accessed December 15, 2011).
Christeson, W., A. D. Taggart, and S. Messner-Zidell. 2010. Too fat to fight: Retired military leaders want junk food out of America’s schools. Washington, DC: Mission: Readiness.
Claxton, G., B. DiJulio, H. Whitmore, J. D. Pickreign, M. McHugh, A. Osei-Anto, and B. Finder. 2010. Health benefits in 2010: Premiums rise modestly, workers pay more toward coverage. Health Affairs 29(10):1942-1950.
Dannenberg, A. L., D. C. Burton, and R. J. Jackson. 2004. Economic and environmental costs of obesity: The impact on airlines. American Journal of Preventive Medicine 27(3):264.
DGAC (Dietary Guidelines Advisory Committee). 2010. Report of the Dietary Guidelines Advisory Committee on the Dietary Guidelines for Americans, 2010, to the Secretary of Agriculture and the Secretary of Health and Human Services. Washington, DC: U.S. Department of Agriculture, Agricultural Research Service.
Durden, E. D., D. Huse, R. Ben-Joseph, and B. C. Chu. 2008. Economic costs of obesity to self-insured employers. Journal of Occupational and Environmental Medicine 50(9):991-997.
Eaton, D. K., L. Kann, S. Kinchen, S. Shanklin, J. Ross, J. Hawkins, W. A. Harris, R. Lowry, T. McManus, D. Chyen, C. Lim, N. D. Brener, and H. Wechsler. 2008. Youth risk behavior surveillance—United States, 2007. Morbidity and Mortality Weekly Report Surveillance Summaries 57(4):1-131.
Eisenberg, M. E., D. Neumark-Sztainer, and M. Story. 2003. Associations of weight-based teasing and emotional well-being among adolescents. Archives of Pediatrics and Adolescent Medicine 157(8):733-738.
Enns, C. W., S. J. Mickle, and J. D. Goldman. 2002. Trends in food and nutrient intakes by children in the United States. Family Economics and Nutrition Review 14(2):56-68.
Finkelstein, E. A., J. G. Trogdon, J. W. Cohen, and W. Dietz. 2009. Annual medical spending attributable to obesity: Payer- and service-specific estimates. Health Affairs 28(5):w822-w831.
Flegal, K. M., M. D. Carroll, C. L. Ogden, and L. R. Curtin. 2010. Prevalence and trends in obesity among US adults, 1999-2008. Journal of the American Medical Association 303(3):235-241.
Fontaine, K. R., D. T. Redden, C. Wang, A. O. Westfall, and D. B. Allison. 2003. Years of life lost due to obesity. Journal of the American Medical Association 289(2):187-193.
Freedman, D. S. 2011. Obesity—United States, 1988-2008. Morbidity and Mortality Weekly Report Surveillance Summaries 60(Suppl.):73-77.
FTC (Federal Trade Commission). 2009. Interagency working group in food marketing to children—tentative proposed nutrition standards. http://www.ftc.gov/bcp/workshops/sizingup/SNAC_PAC.pdf (accessed December 1, 2011).
FTC. 2010. Interagency working group on food marketed to children preliminary proposed nutrition principles to guide industry self-regulatory efforts: Request for comments. http://www.ftc.gov/os/2011/04/110428foodmarketproposedguide.pdf (accessed September 21, 2011).
Geier, A. B., G. D. Foster, L. G. Womble, J. McLaughlin, K. E. Borradaile, J. Nachmani, S. Sherman, S. Kumanyika, and J. Shults. 2007. The relationship between relative weight and school attendance among elementary schoolchildren. Obesity (Silver Spring) 15(8):2157-2161.
Giel, K. E., A. Thiel, M. Teufel, J. Mayer, and S. Zipfel. 2010. Weight bias in work settings—a qualitative review. Obesity Facts 3(1):33-40.
Gorsky, R. D., E. Pamuk, D. F. Williamson, P. A. Shaffer, and J. P. Koplan. 1996. The 25-year health care costs of women who remain overweight after 40 years of age. American Journal of Preventive Medicine 12(5):388-394.
Gortmaker, S. L., A. Must, J. M. Perrin, A. M. Sobol, and W. H. Dietz. 1993. Social and economic consequences of overweight in adolescence and young adulthood. New England Journal of Medicine 329(14):1008-1012.
Gray, W. N., S. L. Simon, D. M. Janicke, and M. Dumont-Driscoll. 2011. Moderators of weight-based stigmatization among youth who are overweight and non-overweight: The role of gender, race, and body dissatisfaction. Journal of Developmental and Behavioral Pediatrics 32(2):110-116.
Groessl, E. J., R. M. Kaplan, E. Barrett-Connor, and T. G. Ganiats. 2004. Body mass index and quality of well-being in a community of older adults. American Journal of Preventive Medicine 26(2):126-129.
Gunstad, J., R. H. Paul, R. A. Cohen, D. F. Tate, and E. Gordon. 2006. Obesity is associated with memory deficits in young and middle-aged adults. Eating and Weight Disorders 11(1):e15-e19.
Hammond, R. A., and R. Levine. 2010. The economic impact of obesity in the United States. Diabetes, Metabolic Syndrome and Obesity: Targets and Therapy 3:285-295.
Han, E., E. C. Norton, and L. M. Powell. 2011. Direct and indirect effects of body weight on adult wages. Economics and Human Biology 9(4):381-392.
Harris, J. L., M. E. Weinberg, M.B. Schwartz, C. Ross, J. Ostroffa, and K. D. Brownell. 2010. Trends in television food advertising. Progress in reducing unhealthy marketing to young people? New Haven, CT: Rudd Center for Food Policy and Obesity.
Healthy Eating Research. 2011. Food and beverage marketing to children and adolescents: An environment at odds with good health. A research synthesis, April 2011. http://www.healthyeatingresearch.org/publications-mainmenu-111/research-briefs-and-syntheses-mainmenu-114/287 (accessed January 3, 2012).
Healthy Weight Commitment Foundation. 2010. Fighting obesity by balancing calories in with calories out-good health is good business: New website promotes healthy workforce culture. http://www.healthyweightcommit.org/news/Good_Health/ (accessed January 4, 2012).
HHS (U.S. Department of Health and Human Services). 2001. The Surgeon General’s call to action to prevent and decrease overweight and obesity, edited by HHS, Public Health Service and Office of the Surgeon General. Rockville, MD: Government Printing Office.
HHS. 2008. 2008 Physical Activity Guidelines for Americans. http://www.health.gov/paguidelines/guidelines/default.aspx (accessed January 4, 2012).
HHS. 2009. ARRA prevention and wellness: Communities putting prevention to work funding opportunities announcement (FOA). https://www.cfda.gov/index?s=program&mode=form&tab=step1&id=a95be544falfddcece3663dade4b9e35 (accessed January 4, 2012).
Hofferth, S. L. 2009. Changes in American children’s time-1997 to 2003. Electronic International Journal of Time Use Research 6(1):26.
Hofferth, S. L., and J. F. Sandberg. 2001. Changes in American children’s time—1981-1997. In Children at the millennium: Where have we come from, where are we going. The Netherlands. Pp. 193-229.
IFIC (International Food Information Council). 2011. Global trends in childhood obesity-related media coverage from Q1 2004 through Q3 2011. Washington, DC: IFIC.
IOM (Institute of Medicine). 2005. Preventing childhood obesity: Health in the balance. Washington, DC: The National Academies Press.
IOM. 2006a. Food marketing to children and youth: Threat or opportunity? Washington, DC: The National Academies Press.
IOM. 2006b. WIC food packages: Time for a change. Washington, DC: The National Academies Press.
IOM. 2007a. Nutrition standards for foods in schools: Leading the way toward healthier youth. Washington, DC: The National Academies Press.
IOM. 2007b. Progress in preventing childhood obesity: How do we measure up? Washington, DC: The National Academies Press.
IOM. 2009. Local government actions to prevent childhood obesity. Washington, DC: The National Academies Press.
IOM. 2010a. Bridging the evidence gap in obesity prevention: A framework to inform decision making. Washington, DC: The National Academies Press.
IOM. 2010b. School meals: Building blocks for healthy children. Washington, DC: The National Academies Press.
IOM. 2011. Early childhood obesity prevention policies. Washington, DC: The National Academies Press.
Jacobson, S. H., and D. M. King. 2009. Measuring the potential for automobile fuel savings in the US: The impact of obesity. Transportation Research Part D: Transport and Environment 14(1):6-13.
Jacobson, S. H., and L. A. McLay. 2006. The economic impact of obesity on automobile fuel consumption. The Engineering Economist 51(4):307-323.
Johnston, C. S., C. A. Taylor, and J. S. Hampl. 2000. More Americans are eating “5 a day” but intakes of dark green and cruciferous vegetables remain low. Journal of Nutrition 130(12):3063-3067.
Kaestner, R., M. Grossman, and B. Yarnoff. 2009. Effects of weight on adolescent educational attainment. http://www.nber.org/papers/w14994.pdf (accessed December 28, 2011).
Kuczmarski, R. J., K. M. Flegal, S. M. Campbell, and C. L. Johnson. 1994. Increasing prevalence of overweight among U.S. Adults. The National Health and Nutrition Examination Surveys, 1960 to 1991. Journal of the American Medical Association 272(3):205-211.
Kumanyika, S. K. 2008. Environmental influences on childhood obesity: Ethnic and cultural influences in context. Physiology and Behavior 94(1):61-70.
Lenhart, A., K. Purcell, A. Smith, and K. Zickuhr. 2010. Social media & mobile Internet use among teens and young adults. http://pewinternet.org/~/media//Files/Reports/2010/PIP_Social_Media_and_Young_Adults_Report_Final_with_toplines.pdf (accessed December 29, 2011).
Let’s Move Campaign. 2010. The Partnership for a Healthier America: Supporting America’s move to raise a healthier generation of kids. http://www.letsmove.gov/partnership-healthier-america (accessed January 4, 2012).
Liu, J., K. J. Bennett, N. Harun, and J. C. Probst. 2008. Urban-rural differences in overweight status and physical inactivity among US children aged 10-17 years. Journal of Rural Health 24(4):407-415.
Lorson, B. A., H. R. Melgar-Quinonez, and C. A. Taylor. 2009. Correlates of fruit and vegetable intakes in US children. Journal of the American Dietetic Association 109(3):474-478.
Ludwig, D. S., and H. A. Pollack. 2009. Obesity and the economy: From crisis to opportunity. Journal of the American Medical Association 301(5):533-535.
Maayan, L., C. Hoogendoorn, V. Sweat, and A. Convit. 2011. Disinhibited eating in obese adolescents is associated with orbitofrontal volume reductions and executive dysfunction. Obesity (Silver Spring) 19(7):1382-1387.
Madden, M., and K. Zickuhr. 2011. 65% of online adults use social networking sites. http://pewinternet.org/~/media//Files/Reports/201l/PIP-SNS-Update-2011.pdf (accessed December 29, 2011).
Madsen, K. A., A. E. Weedn, and P. B. Crawford. 2010. Disparities in peaks, plateaus, and declines in prevalence of high BMI among adolescents. Pediatrics 126(3):434-442.
Michaelowa, A., and B. Dransfield. 2008. Greenhouse gas benefits of fighting obesity. Ecological Economics 66(2-3):298-308.
Moreno, M. A., F. Furtner, and F. P. Rivara. 2011. Breastfeeding as obesity prevention. Archives of Pediatrics and Adolescent Medicine 165(8):772.
Narayan, K. M., J. P. Boyle, T. J. Thompson, S. W. Sorensen, and D. F. Williamson. 2003. Lifetime risk for diabetes mellitus in the United States. Journal of the American Medical Association 290(14):1884-1890.
NCCOR (National Collaborative on Childhood Obesity Research). 2012. NCCOR: National Collaborative on Childhood Obesity Research. http://nccor.org/ (accessed January 4, 2012).
NCHS (National Center for Health Statistics). 2010. Health, United States, 2009. With special feature on medical technology. Hyattsville, MD: NCHS.
NCHS. 2011. Health, United States, 2010: With special feature on death and dying. Hyattsville, MD: NCHS.
Nielsen, S. J., and B. M. Popkin. 2003. Patterns and trends in food portion sizes, 1977-1998. Journal of the American Medical Association 289(4):450.
NIH (National Institutes of Health). 2004. Strategic plan for NIH obesity research. Bethesda, MD: National Institute of Diabetes and Digestive and Kidney Diseases/National Heart, Lung, and Blood Institute.
NIH. 2011. Strategic plan for NIH obesity research: A report of the NIH Obesity Research Task Force. NIH publication no. 11-5493. Washington, DC: HHS.
Ogden, C. L., M. D. Carroll, L. R. Curtin, M. M. Lamb, and K. M. Flegal. 2010a. Prevalence of high body mass index in US children and adolescents, 2007-2008. Journal of the American Medical Association 303(3):242-249.
Ogden, C. L., M. M. Lamb, M. D. Carroll, and K. M. Flegal. 2010b. Obesity and socioeconomic status in children and adolescents: United States, 2005-2008. NCHS Data Brief (51):1-8.
Ogden, C. L., M. M. Lamb, M. D. Carroll, and K. M. Flegal. 2010c. Obesity and socioeconomic status in adults: United States, 2005-2008. NCHS Data Brief (50):1-8.
Ogden, C. L., B. K. Kit, M. D. Carroll, and S. Park. 2011. Consumption of sugar drinks in the United States, 2005-2008. NCHS Data Brief (71):1-7.
Ogden C. L., M. D. Carroll, B. K. Kit, and and K. M. Flegal. 2012. Prevalence of obesity in the United States, 2009-2010. NCHS Data Brief (82):1-7.
Olds, T., C. Maher, S. Zumin, S. Peneau, S. Lioret, K. Castetbon, Bellisle, J. de Wilde, M. Hohepa, R. Maddison, L. Lissner, A. Sjoberg, M. Zimmermann, I. Aeberli, C. Ogden, K. Flegal, and C. Summerbell. 2011. Evidence that the prevalence of childhood overweight is plateauing: Data from nine countries. International Journal of Pediatric Obesity 6(5-6):342-360.
Olshansky, S. J., D. J. Passaro, R. C. Hershow, J. Layden, B. A. Carnes, J. Brody, L. Hayflick, R. N. Butler, D. B. Allison, and D. S. Ludwig. 2005. A potential decline in life expectancy in the United States in the 21st century. New England Journal of Medicine 352(11):1138-1145.
Ormond, B. A., B. C. Spillman, T. A. Waidmann, K. J. Caswell, and B. Tereshchenko. 2011. Potential national and state medical care savings from primary disease prevention. American Journal of Public Health 101(1):157-164.
Patterson, P. D., C. G. Moore, J. C. Probst, and J. A. Shinogle. 2004. Obesity and physical inactivity in rural America. Journal of Rural Health 20(2):151-159.
Piernas, C., and B. M. Popkin. 2011. Food portion patterns and trends among US children and the relationship to total eating occasion size, 1977-2006. The Journal of Nutrition 141(6):1159-1164.
Pew Research Center (Pew Internet and American Life Project). 2011a. Internet adoption, 1995-2011. http://pewinternet.org/Static-Pages/Trend-Data/Internet-Adoption.aspx (accessed December 20, 2011).
Pew Research Center. 2011b. Tech usage over time. http://pewinternet.org/Trend-Data-for-Teens/Usage-Over-Time.aspx (accessed December 20, 2011).
Poti, J. M., and B. M. Popkin. 2011. Trends in energy intake among US children by eating location and food source, 1977-2006. Journal of the American Dietetic Association 111(8):1156-1164.
Pronk, N. P., M. J. Goodman, P. J. O’Connor, and B. C. Martinson. 1999. Relationship between modifiable health risks and short-term health care charges. Journal of the American Medical Association 282(23):2235-2239.
Puhl, R., and K. D. Brownell. 2001. Bias, discrimination, and obesity. Obesity 9(12):788-805.
Puhl, R. M., and C. A. Heuer. 2009. The stigma of obesity: A review and update. Obesity (Silver Spring) 17(5):941-964.
Raczynski, J. M., J. W. Thompson, M. M. Phillips, K. W. Ryan, and H. W. Cleveland. 2009. Arkansas act 1220 of 2003 to reduce childhood obesity: Its implementation and impact on child and adolescent body mass index. Journal of Public Health Policy 30(Suppl. 1):S124-S140.
Ricci, J. A., and E. Chee. 2005. Lost productive time associated with excess weight in the U.S. workforce. Journal of Occupational and Environmental Medicine 47(12):1227-1234.
Rideout, V., U. G. Foehr, and D. F. Roberts. 2010. Generation m2: Media in the lives of 8-18 year olds. Washington, DC: Kaiser Family Foundation.
Robinson, J. P., and G. Godbey. 1997. Time for life: The surprising ways Americans use their time. University Park, PA: Pennsylvania State University Press.
Roger, V. L., A. S. Go, D. M. Lloyd-Jones, R. J. Adams, J. D. Berry, T. M. Brown, M. R. Carnethon, S. Dai, G. de Simone, E. S. Ford, C. S. Fox, H. J. Fullerton, C. Gillespie, K. J. Greenlund, S. M. Hailpern, J. A. Heit, P. M. Ho, V. J. Howard, B. M. Kissela, S. J. Kittner, D. T. Lackland, J. H. Lichtman, L. D. Lisabeth, D. M. Makuc, G. M. Marcus, A. Marelli, D. B. Matchar, M. M. McDermott, J. B. Meigs, C. S. Moy, D. Mozaffarian, M. E. Mussolino, G. Nichol, N. P. Paynter, W. D. Rosamond, P. D. Sorlie, R. S. Stafford, T. N. Turan, M. B. Turner, N. D. Wong, and J. Wylie-Rosett. 2011. Heart disease and stroke statistics—2011 update: A report from the American Heart Association. Circulation 123(4):e18-e209.
RWJF (The Robert Wood Johnson Foundation). 2007. Robert Wood Johnson Foundation announces $500 million commitment to reverse childhood obesity in U.S. http://www.rwjf.org/childhoodobesity/product.jsp?id=21938 (accessed January 4, 2012).
Sanchez-Vaznaugh, E. V., B. N. Sanchez, J. Baek, and P. B. Crawford. 2010. “Competitive” food and beverage policies: Are they influencing childhood overweight trends? Health Affairs 29(3):436-446.
Santos, A., N. McGuckin, H. Y. Nakamoto, D. Gray, and L. Liss. 2011. Summary of travel trends: 2009 National Household Travel Survey. Washington, DC: U.S. Department of Transportation and Federal Highway Administration.
Schwimmer, J. B., T. M. Burwinkle, and J. W. Varni. 2003. Health-related quality of life of severely obese children and adolescents. Journal of the American Medical Association 289(14):1813-1819.
Serxner, S. A., D. B. Gold, and K. K. Bultman. 2001. The impact of behavioral health risks on worker absenteeism. Journal of Occupational and Environmental Medicine 43(4):347-354.
Sturm, R. 2005. Childhood obesity—what we can learn from existing data on societal trends, part 2. Preventing Chronic Disease 2(2).
Taras, H., and W. Potts-Datema. 2005. Obesity and student performance at school. Journal of School Health 75(8):291-295.
The Economist. 2011. US consumer spending: How the economic slowdown has changed consumer spending in America. http://www.economist.com/blogs/dailychart/2011/10/us-consumer-spending (accessed November 11, 2011).
Thompson, D., J. Edelsberg, K. L. Kinsey, and G. Oster. 1998. Estimated economic costs of obesity to U.S. business. American Journal of Health Promotion 13(2):120-127.
Thompson, D., J. Edelsberg, G. A. Colditz, A. P. Bird, and G. Oster. 1999. Lifetime health and economic consequences of obesity. Archives of Internal Medicine 159(18):2177-2183.
Thompson, D., J. B. Brown, G. A. Nichols, P. J. Elmer, and G. Oster. 2001. Body mass index and future healthcare costs: A retrospective cohort study. Obesity Research 9(3):210-218.
Thorpe, K. E., C. S. Florence, D. H. Howard, and P. Joski. 2004. The impact of obesity on rising medical spending. Health Affairs Suppl. Web Exclusives:W4-480-486.
Trasande, L., and S. Chatterjee. 2009. The impact of obesity on health service utilization and costs in childhood. Obesity (Silver Spring) 17(9):1749-1754.
Trogdon, J. G., E. A. Finkelstein, T. Hylands, P. S. Dellea, and S. J. Kamal-Bahl. 2008. Indirect costs of obesity: A review of the current literature. Obesity Reviews 9(5):489-500.
Troiano, R. P., K. M. Flegal, R. J. Kuczmarski, S. M. Campbell, and C. L. Johnson. 1995. Overweight prevalence and trends for children and adolescents. The National Health and Nutrition Examination Surveys, 1963 to 1991. Archives of Pediatrics and Adolescent Medicine 149(10):1085-1091.
Trust for America’s Health and RWJF. 2011. F as in fat: How obesity threatens America’s future. Washington, DC: Trust for America’s Health.
Tsai, S. P., F. S. Ahmed, J. K. Wendt, F. Bhojani, and R. P. Donnelly. 2008. The impact of obesity on illness absence and productivity in an industrial population of petrochemical workers. Annals of Epidemiology 18(1):8-14.
U.S. Census Bureau. 2009. Households with a computer and Internet use: 1984 to 2009. http://www.census.gov/hhes/computer/publications/index.html (accessed December 20, 2011).
USDA (U.S. Department of Agriculture). 2003. Agriculture fact book 2001-2002. Washington, DC: Government Printing Office.
USDA. 2007. Special Supplemental Nutrition Program for Women, Infants and Children (WIC): Revisions in the WIC food packages—interim rule. http://www.fns.usda.gov/wic/regspublished/foodpackages-interimrule.htm (accessed January 12, 2012).
USDA. 2010. What we eat in America NHANES 2007-2008 data: Percentages of energy from protein, carbohydrate, fat and alcohol by gender and age in the United States. http://www.ars.usda.gov/SP2UserFiles/Place/12355000/pdf/0708/Table_6_EIN_RAC_07.pdf (accessed December 19, 2011).
USDA/HHS. 2010. Dietary Guidelines for Americans, 2010. 7th ed. Washington, DC: U.S. Government Printing Office.
Uusitalo, U., P. Pietinen, and P. Puska. 2002. Dietary transition in developing countries: Challenges for chronic disease prevention. In Globalization, diets and noncommunicable diseases. Geneva, Switzerland: World Health Organization. Pp. 6-31.
Van Cleave, J., S. L. Gortmaker, and J. M. Perrin. 2010. Dynamics of obesity and chronic health conditions among children and youth. Journal of the American Medical Association 303(7):623-630.
Vander Wal, J. S., and E. R. Mitchell. 2011. Psychological complications of pediatric obesity. Pediatric Clinics of North America 58(6):1393-1401.
Wang, Y. C., S. N. Bleich, and S. L. Gortmaker. 2008. Increasing caloric contribution from sugar-sweetened beverages and 100% fruit juices among US children and adolescents, 1988-2004. Pediatrics 121(6):e1604-e1614.
Wear, D., J. M. Aultman, J. D. Varley, and J. Zarconi. 2006. Making fun of patients: Medical students’ perceptions and use of derogatory and cynical humor in clinical settings. Academic Medicine 81(5):454-462.
White House. 2010a. First Lady Michelle Obama launches Let’s Move: America’s move to raise a healthier generation of kids. http://www.whitehouse.gov/the-press-office/first-lady-michelle-obama-launches-lets-move-americas-move-raise-a-healthier-genera (accessed January 4, 2012).
White House. 2010b. Presidential memorandum—establishing a task force on childhood obesity. http://www.whitehouse.gov/the-press-office/presidential-memorandum-establishing-a-task-force-childhood-obesity (accessed January 4, 2012).
White House Task Force on Childhood Obesity. 2010. Solving the problem of childhood obesity within a generation: White House Task Force on Childhood Obesity report to the President. Washington, DC: Executive Office of the President of the United States.
Willeumier, K. C., D. V. Taylor, and D. G. Amen. 2011. Elevated BMI is associated with decreased blood flow in the prefrontal cortex using SPECT imaging in healthy adults. Obesity (Silver Spring) 19(5):1095-1097.
Williams, K. J., C. A. Taylor, K. N. Wolf, R. F. Lawson, and R. Crespo. 2008. Cultural perceptions of healthy weight in rural Appalachian youth. Rural Remote Health 8(2):932.
Wolf, A. M. 1998. What is the economic case for treating obesity? Obesity Research 6(Suppl. 1):2S-7S.
Wolf, A. M., and G. A. Colditz. 1998. Current estimates of the economic cost of obesity in the United States. Obesity Research 6(2):97-106.
Woodward-Lopez, G., J. Kao, and L. Ritchie. 2010. To what extent have sweetened beverages contributed to the obesity epidemic? Public Health Nutrition 1-11.
Young, D. R., G. M. Felton, M. Grieser, J. P. Elder, C. Johnson, J. S. Lee, and M. Y. Kubik. 2007. Policies and opportunities for physical activity in middle school environments. Journal of School Health 77(1):41-47.


