
3
The Food and Nutrition Environment
Key Points Noted in Presentations
• The food environment is complex, and food consumption is influenced by many factors at different levels. Research examines mainly the community environment (types, locations, marketing, and accessibility of food outlets) and the consumer environment (foods found within stores, restaurants, and other outlets, as well as marketing and information about the foods, such as price).
• Although a primary focus has been on individual consumption, many ongoing efforts to collect data, as well as newer research designs and data collection tools, have expanded knowledge of food environments and policies.
• Any environment in which food is marketed, offered, or sold can be assessed in terms of dietary quality.
• Areas suggested for additional progress include
![]() tracking change over time;
tracking change over time;
![]() developing standardized definitions of key variables and other ways of facilitating the sharing and integration of data from different sources; and
developing standardized definitions of key variables and other ways of facilitating the sharing and integration of data from different sources; and
![]() matching measures and methods to questions of interest to allow for meaningful analysis and comparison at all levels of the food stream.
matching measures and methods to questions of interest to allow for meaningful analysis and comparison at all levels of the food stream.
Measures of the food and nutrition environment have much in common with those used to measure physical activity, and many parallel issues arise in both contexts. Karen Glanz, George A. Weiss University Professor, professor of epidemiology in the Perelman School of Medicine, and professor of nursing in the School of Nursing at the University of Pennsylvania, provided an overview of the ways in which food environments—and the effects of policies that influence them—are measured, and reviewed some limitations of the measurement tools currently available. Susan M. Krebs-Smith, chief of the Risk Factor Monitoring and Methods Branch in the Division of Cancer Control and Population Sciences at the National Cancer Institute, focused on surveillance in this area and the potential for expanding the focus of dietary surveillance from individual-level behaviors to the community- or national-level food environment.
UNDERSTANDING FOOD ENVIRONMENTS AND POLICIES
Presenter: Karen Glanz
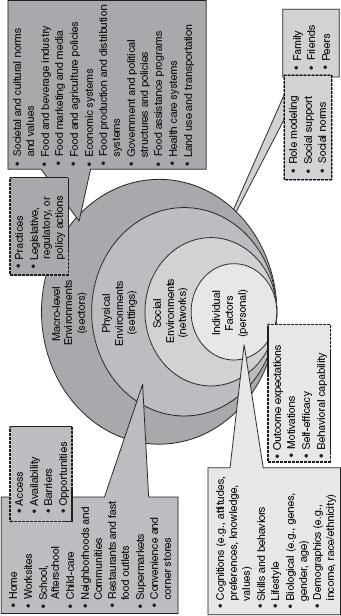
As with physical activity, food choices are influenced by many factors. Glanz presented an ecological model (Figure 3-1) to illustrate these factors, similar to the physical activity model presented by Sallis. In the food choice model, the large boxes connecting to the concentric circles list the specific influences by category; the smaller boxes list the primary means by which these influences affect behavior.
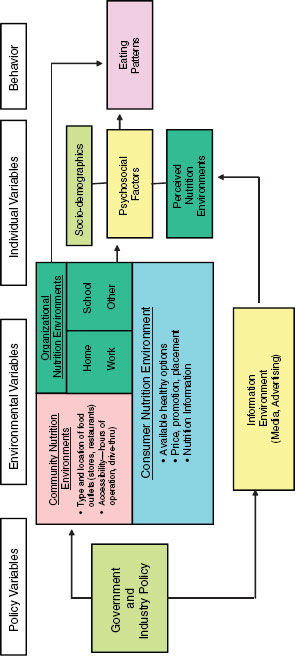
The picture is highly complex, Glanz acknowledged. A second illustration (Figure 3-2) models similar ideas but highlights the environmental variables that she believes can be measured but have not been adequately studied, such as the locations of food outlets and the availability of healthy options at a given outlet.
In Glanz’s view, it is important when considering food issues to distinguish between the community environment (encompassing the types and locations of restaurants and supermarkets and their accessibility within a particular community) and the consumer environment (what consumers encounter when they go out to eat or to purchase food, whether in a restaurant, at school, or elsewhere) (Glanz et al., 2005). The consumer environment is the category that encompasses such factors as the availability of healthful or less healthful food choices within food establishments, the availability of nutrition information, pricing, and product placement. “Food is a commodity, and food products are a big business,” Glanz added. While many industries and government sectors have an interest in physical activity, it is a behavior, not a commodity, and industry is “very invested in food in a different way” she said. Food is also highly regulated through safety and hygiene rules, taxation, and policies regarding both foods and
nutrients, for example, which adds considerable complexity to the business of food.
Policy can influence food availability and food choices in a variety of ways, Glanz added. Federal and state policies regarding the nutritional value of foods served in public schools, price supports for agricultural products, and food assistance policies may all have significant influence, and Glanz noted that changes in such policies during the last decade are beginning to yield benefits. “We’d like to think,” she observed, “that most food-related government policies are designed to improve health,” but not all are, and other efforts to promote health may be defeated politically. The food environment also can evolve in the absence of policies, she added, because commercial enterprises do not necessarily look to government’s goals as they make marketing decisions.
Given this complex picture of influences on food choices, Glanz explained, there are five reasons for the measurement of food and nutrition environments:
• Observation, or simply observing what is available and what people eat and why they eat the way they do in the different environments to which they are exposed
• Explanation of the reasons for people’s choices
• Evaluation of the results of programs and strategies
• Support for advocacy or other actions
• Surveillance, or ongoing monitoring to identify trends and problems
A variety of data sources support these goals. Glanz noted, much the same as those used to measure physical activity: self-report surveys; observations and audits; databases that may exist for other purposes but contain food-related information; and GIS-based measures, which track the locations of food outlets, for example.
Glanz described a few examples of current efforts to measure food environments and policies in schools, worksites, food stores, restaurants, and local/state communities. There is a long history of measuring health policies affecting public schools, she noted, and this is an area in which the Centers for Disease Control and Prevention (CDC) has taken the lead. The School Health Policies and Programs Study, for example, has assessed such issues as vending machines’ offerings of junk foods (Kubik et al., 2010) and offerings of fruits, vegetables, french fries, and high-fat baked goods in elementary, middle, and high schools in all states since 1994. The School Nutrition Environment State Policy Classification System compares
state policies in 11 policy areas related to food (Masse et al., 2007). A third study that explores the school context is the Food and Beverage Environmental Analysis and Monitoring System (FoodBEAMS), in which competitive foods and beverages offered in schools are assessed and linked to nutritional databases so that adherence to nutritional guidelines can be monitored (Bullock et al., 2010). Glanz observed that studies tend to focus on the availability of healthy foods but, she believes, should also examine the availability of unhealthy, competing choices.
A modest amount of research has explored the food environments in worksites. One example is the Working Well Trial (WWT) (Patterson et al., 1998), in which researchers examined access to healthy food and nutrition information in more than 100 worksites as part of a cancer prevention trial. The researchers collected self-report data and found an association between interventions designed to alter food choices and changes in workers’ choices. An Australian study of a number of aspects of the workplace included a nutrition component, collecting data on such features as availability of nutrition information, cafeteria options, and food in vending machines (Oldenburg et al., 2002). The researchers used a measure developed by Australia’s National Heart Foundation to track workers’ food choices.
Data are available regarding the types and locations of food stores and restaurants, but less measured are variables affecting access to these outlets, such as hours of operation and drive-through options, Glanz explained. States, counties, and cities all maintain lists of food establishments for licensing purposes, she noted, and commercial enterprises such as Dun & Bradstreet and InfoUSA also collect such data. Wang and colleagues (2006) found, however, that these data generally are not complete, up to date, or altogether accurate. They noted, for example, large discrepancies in the counts produced by state boards and by business directories. Using any single list is not likely to be adequate, Glanz observed. Counting food establishments is “a messy business,” she suggested, because, for example, some may be located within other buildings and not fully accessible to the public.
The consumer nutrition environment also has attracted considerable research attention. Observational measures have been used to assess the environments within food stores. An early example is the Food Availability Survey, conducted in 1986 (Sallis et al., 1986), which audited the presence of 71 different heart-healthy foods in food stores. Cheadle and colleagues (1990, 1991, 1993) built on this work by reporting on a smaller number of items but comparing results with those from community surveys. Glanz also described the Nutrition Environment Measures Survey (NEMS), which
has examined foods in retail stores, as well as restaurant offerings.1 The restaurant component of NEMS addresses such issues as price, promotion, and children’s menus, along with choices available in stores and vending machines. Measures used in stores cover the availability of healthful choices, prices of healthy and less-healthy foods and how they vary by store type and neighborhood, and the quality of fresh produce.
NEMS was originally developed for research purposes, but the information collected has also been used for community assessments, for advocacy, and in the design of interventions. The measurement tools developed for NEMS proved useful for these other purposes, Glanz explained. Funding from foundations and state health departments has allowed for expanded dissemination of results as well as tools and training for those who wish to use the data. The measures are widely available in different technological formats, and individuals from 40 states have now been trained.
Glanz also described a CDC project, the Common Community Measures for Obesity Prevention (which has a physical activity component as well). This project, she explained, was designed to provide communities and local governments with measures they could use to plan and monitor environmental and policy changes related to obesity prevention. The food-related measures included whether communities had a plan for applying the Dietary Guidelines for Americans2 in their government facilities and largest school district, the numbers of full-service grocery stores (per 10,000 people) in their three largest underserved census tracts, and the availability of government incentives to retailers for offering healthy food and beverages.
In answer to a question, Glanz noted that some surveys focus on consumer behavior and attitudes, but those topics have been relatively difficult to study. One approach used has been to look at receipts or intercept customers as they exit food stores to do a quick survey of their purchases as a way of assessing responses to calorie labeling. It is not always easy to obtain sales data, however, which, according to Glanz, would be “much stronger and more comprehensive.” The issue of attitudes and other influences on individuals’ choices is important, a workshop participant noted, because time pressure has meant that a shrinking proportion of food consumed is actually prepared at home from unprocessed ingredients. Glanz agreed, and said that prepared, take-out food is the fastest-growing segment of the supermarket business and that foods obtained away from home generally have more fat and calories than those prepared at home. Furthermore,
________________
1For more information about NEMS, see http://www.med.upenn.edu/nems/ (accessed July 2011).
2For more information about the Dietary Guidelines for Americans, a source of research-based nutrition recommendations, see http://www.health.gov/dietaryguidelines/ (accessed July 2011).
studies of behaviors and attitudes could better assess, for example, whether declines in cooking skills are now playing a role in people’s food choices.
Glanz noted that many measures now available did not exist even 4 or 5 years ago, so “tremendous progress” has been made.3 Published studies have used a variety of research designs: cross-sectional or correlational, comparative, longitudinal or prospective, experimental (looking at pre- and post-intervention, for example), and quasi-experimental. Randomized controlled trials are sometimes conducted, but in Glanz’s view they are not essential; they are expensive, and in many circumstances they are either inappropriate or infeasible.
Glanz also stressed that available measures may be quite accurate for a single point in time but less useful for tracking change over time. Studies by Cheadle and colleagues (1991, 1993, 1995) illustrate this point. The early studies identified a clear association between the characteristics of a grocery store environment and community members’ reports of their eating patterns. The correlations were less strong, however, as the researchers followed the community over time, and when they were able to compare three points in time, the results were inconsistent and contradictory.
Thus, for Glanz, examining the capacity of measurement tools is an important component of the needed research on food and nutrition, but many unanswered questions remain. It is not clear, she observed, what degree of environmental change will be needed to bring about meaningful changes in food intake and, ultimately, in obesity, or how long meaningful change might take. Relatively little is known about which people respond to interventions that have been tried.
Efforts to measure the food environment are hampered by several factors, Glanz noted. The food environment is complex, variable, and far from static. For example, the variation in portion sizes at restaurants makes it difficult to assess nutritional value. Field-based measures have practical limitations because of this complexity. Researchers also lack common metrics for many of the features they want to measure, and not all measures
________________
3Glanz suggested several resources for further information: a web compilation of measures and articles, at https://riskfactor.cancer.gov/mfe/; the Healthy Eating Research website, at www.healthyeatingresearch.org; Your Food Environment Atlas, at http://www.ers.usda.gov/foodatlas/; and the NCCOR Catalogue of Surveillance Systems, at http://tools.nccor.org/css/ (accessed July 27, 2011).
are of equal psychometric rigor. Limited archival measures4 are available, and researchers do not know how sensitive measures are to change. Glanz’s hope is that the field will eventually have a set of measures, based on shared definitions, that have been tested and proven valid and are feasible to use, adaptable to changing circumstances, and able to yield results that are easy to disseminate for wide use. In her view, it is also “increasingly important to tie those measures to calories, or to the foods that contribute the most calories to the diet.” With those tools, she concluded, well-designed studies that permit reasonable inferences about the impact of interventions should help accelerate progress in reducing obesity.
SURVEILLANCE OF FOOD ENVIRONMENTS
Presenter: Susan M. Krebs-Smith
Currently, national surveys related to food and obesity focus mainly on the behavior of individuals, Krebs-Smith noted, but she believes a national surveillance system is needed to track nutrition-related environmental and policy changes and their effects. She offered her thoughts about what such a system would look like and the lessons that could be drawn from individual-level surveys.5
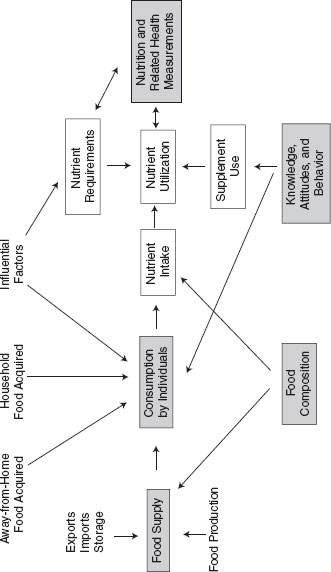
Prior studies have explored these questions in limited ways, Krebs-Smith noted. A series of reports issued by the National Nutrition Monitoring and Related Research Program during the early 1990s explored and developed a model of the relationships between food and health (Figure 3-3). The shaded boxes in this figure show the areas for which data have traditionally been collected.
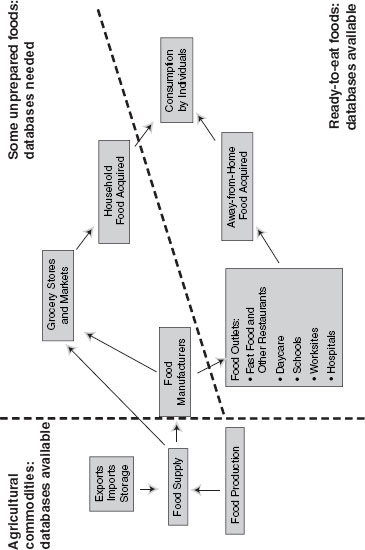
More recently, Krebs-Smith explained, researchers have focused increased attention on the food stream and the additional levels through which food travels from the food supply to consumption by individuals. Figure 3-4 illustrates Krebs-Smith’s suggested expansion of the various levels in the food stream that connect the food supply to individual consumption. Foods are in different forms as they travel through the levels from the food supply to individual consumption; the food supply contains raw agricultural commodities, foods in markets may be raw or processed, and foods consumed by individuals are ready to eat (and may include raw agricultural commodities or processed or prepared foods). This is an important
________________
4That is, preexisting data that do not require new collection.
5Krebs-Smith noted that she was using “level” to refer to the unit of analysis (e.g., individuals’ dietary intake) and “scope” to refer to the area to which a particular study’s results apply, or the sampling frame.
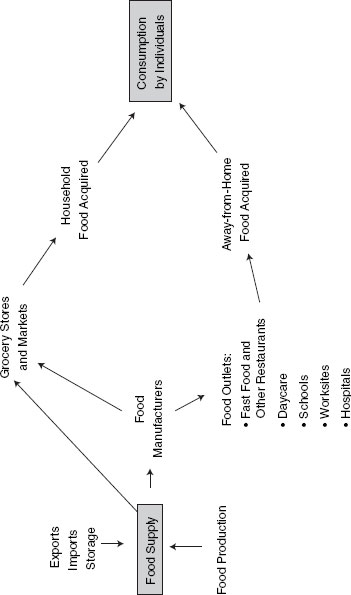
point because characterizing foods at all levels requires databases that reflect these various forms.
Both individual-level surveys and food supply data have evolved in the last couple of decades, and these methodological and database improvements provide lessons for how the food environment might be examined. In the past, researchers reported such findings as, for example, that 6 percent of individuals did not eat any vegetables during a 3-day period, noting, however, that the value reported did not include vegetables eaten as part of food mixtures (i.e., foods containing multiple ingredients, such as a casserole).6 Researchers did not have the tools to discriminate in detail, and the only way they could approximate usual intakes was to take a mean across 3 days. Similarly, a finding that all individuals consumed an average of 88 grams of mixtures, mainly meat, poultry, and fish, was of somewhat limited value because there were no dietary recommendations for how many grams of such mixtures individuals should eat.
Responding to these difficulties, nutritionists devised improved ways to capture the intake of specific foods of interest, to estimate usual intake distributions, and to relate this information to caloric density. They also identified some gaps in food-related databases, Krebs-Smith added. Traditional food composition databases provided the amounts of various nutrients and other dietary elements in particular foods that can be determined using chemical analysis, typically in terms of the amount contained in 100 grams of the food. Thus, for example, they listed energy (in kcal), carbohydrates (g), protein (g), beta carotene (IU), calcium (mg), fiber (g), sodium (mg), and fat (g). These data provide valuable information, Krebs-Smith explained, but “don’t tell us everything we need to know about comparing intakes to recommendations.” Guidance-based databases have since been developed that link to dietary recommendations; they measure, for example, cups of fruit, vegetables, or milk (or milk equivalents in the form of cheese or yogurt); ounces of whole grains, total grains, and meat; and teaspoons of added sugars.
Researchers now can measure the prevalence of usual intakes above or below a particular level (Carriquiry, 2003), so they can report, for example, that over the long run, 95 percent of the population consumes an amount of empty calories that exceeds the discretionary calorie allowance in national guidelines. This sort of finding is compelling, Krebs-Smith added. Nutritionists can identify the food sources of empty calories or other elements that
________________
6Examples in this paragraph are paraphrased from the Third Report on Nutrition Monitoring in the United States (FASEB, 1995).
should be curtailed, and the newer data provided the evidence base for the Dietary Guidelines Advisory Committee’s most recent recommendations.7
Advances also have occurred in the collection of data on the food supply, Krebs-Smith noted. Here as well, traditional methods produced valuable information, such as pounds of caloric sweeteners consumed per capita in a year, but the implications were not completely clear because there was no guideline as to how many pounds were advisable. Researchers were interested in the issue, as consumption of regular and low-calorie soft drinks climbed from 26 to 44 gallons per capita between 1972 and 1992 (FASEB, 1995), but the data did not translate easily to recommendations. Moreover, measuring quantities of particular commodities in the food supply gives only an approximation of consumption because of losses from food waste.
These measures have now been translated into waste-adjusted servings per person per day, making it easier to assess the food supply’s alignment with food guidance, Krebs-Smith explained. Thus, for example, “we know that in order to meet recommendations we’d need to be producing about twice as many fruits and vegetables and much more whole grains and milk.” Newer forms of data also have made it possible to project the agricultural needs that will come with population shifts; current growth indicates an even greater need for fruits, vegetables, and whole grains (along with a decrease in the production of caloric sweeteners) by approximately 17 billion pounds in the United States (McNamara et al., 1999). The United States has price and incentive structures in its agricultural policies, Krebs-Smith noted, explaining that farmers are paid not to grow fruits and vegetables on key acreage. In this light, she said, it is interesting to note that the amount of fruits and vegetables in the food supply would be insufficient if everyone wanted to eat according to dietary recommendations.
Researchers also have been able to look across decades to track changes in the quality of the U.S. food supply from 1970 to 2007 (Krebs-Smith et al., 2010). Despite the existence of dietary guidelines, Krebs-Smith explained, little improvement has been seen in the consumption of fruits, vegetables, and grains, and some aspects of the U.S. diet have worsened from a nutritional perspective. Researchers can use tools such as the Healthy Eating Index (a measure developed by U.S. Department of Agriculture’s Center for Nutrition Policy and Promotion to monitor the quality of diets in the United States) to assess the nutritional quality of specific menu items at fast-food restaurants and determine relative diet quality, for example.8
________________
7For more information on the dietary guidelines and the committee that developed them, see http://www.cnpp.usda.gov/dietaryguidelines.htm.
8For more on the Health Eating Index, see http://www.cnpp.usda.gov/healthyeatingindex.htm.
There is a lack of data with which to describe the full array of foods—raw, semiprepared (such as a cake mix or boxed macaroni meal), and ready-to-eat—offered in a grocery store. If more information linked to particular foods were available from the outlets that sell such products, Krebs-Smith explained, researchers could apply an index of diet quality to assess the nature and mix of foods available within a particular area. With more complete data, researchers could also look at, for example, the food consumed by a family over 1 week and assess its quality and nutrition density. More complete food-linked data also would allow for a more detailed assessment of the progress of such initiatives as the Healthy Weight Commitment Foundation, an effort in which food manufacturers and other food-related businesses have pledged to support consumers in reducing obesity by changing their products, packaging, and labeling and reducing the calories in the food supply by 1.5 trillion by the end of 2015.9 It would be valuable, Krebs-Smith explained, to look at whether the calorie reduction goal was achieved through limits on empty calories, as opposed to the more valuable calories supplied by fruits, vegetables, and whole grains.
Workshop participants pointed out that each sort of measure entails complications, observing that individuals make errors when responding to surveys in recalling and recording what they have eaten, while imprecise estimates regarding food waste may introduce error in food supply data. Krebs-Smith noted that some accounting of the waste is included in data analysis and emphasized that each data source is important, although more could be done to reconcile discrepancies.
Krebs-Smith closed by showing an altered version of the model depicting the flow of foods from the food supply to the individual (Figure 3-5). Each element is shown in a box to signal the ideal situation, in which measures of each would be available. As the figure shows, however, databases still are needed to provide data for some elements in the model.
If the data were complete, Krebs-Smith observed, it would be possible to describe any environment in which food is marketed, offered, or sold in terms of dietary quality. Interventions designed to reduce obesity or target other health objectives could be evaluated for their effect on dietary quality, and the relationships between diet quality and other factors, within and across levels, could be examined. “We’ve learned a lot by matching our measures and methods to questions of interest, and there is a potential for gaining a lot of new knowledge by doing this at multiple levels,” Krebs-Smith concluded.
________________
9For more on the Healthy Weight Commitment Foundation, see http://www.healthyweightcommit.org/.
Bullock, S. A., L. Craypo, S. E. E. Clark, J. Barry, and S. E. Samuels. 2010. Food and beverage environment analysis and monitoring system: A reliability study in the school food and beverage environment. Journal of the American Dietetic Association 110(7):1084-1088.
Carriquiry, A. L. 2003. Estimation of usual intake distributions of nutrients and foods. Journal of Nutrition 133(2):601S-608S.
Cheadle, A., B. Psaty, E. Wagner, P. Diehr, T. Koepsell, S. Curry, and M. Von Korff. 1990. Evaluating community-based nutrition programs: Assessing the reliability of a survey of grocery store product displays. American Journal of Public Health 80(6):709-711.
Cheadle, A., B. M. Psaty, S. Curry, E. Wagner, P. Diehr, T. Koepsell, and A. Kristal. 1991. Community-level comparisons between the grocery store environment and individual dietary practices. Preventive Medicine 20(2):250-261.
Cheadle, A., B. M. Psaty, S. Curry, E. Wagner, P. Diehr, T. Koepsell, and A. Kristal. 1993. Can measures of the grocery store environment be used to track community-level dietary changes? Preventive Medicine 22(3):361-372.
Cheadle, A., B. M. Psaty, P. Diehr, T. Koepsell, E. Wagner, S. Curry, and A. Kristal. 1995. Evaluating community-based nutrition programs: Comparing grocery store and individual-level survey measures of program impact. Preventive Medicine 24(1):71-79.
FASEB (Federation of American Societies for Experimental Biology, Life Sciences Research Office) (prepared for the Interagency Board for Nutrition Monitoring and Related Research). 1995. Third report on nutrition monitoring in the United States: Executive summary. Washington, DC: U.S. Government Printing Office.
Glanz, K., J. F. Sallis, B. E. Saelens, and L. D. Frank. 2005. Healthy nutrition environments: Concepts and measures. American Journal of Health Promotion 19(5):330-333.
HHS (Department of Health and Human Services) and USDA (U.S. Department of Agriculture). 1993. Ten-year comprehensive plan for the National Nutrition Monitoring and Related Research Program. Federal Register 58(111):32752-32806.
Krebs-Smith, S. M. 2011. Expanding dietary surveillance from individuals to food environments. Presented at the Institute of Medicine Workshop on Measurement Strategies for Accelerating Progress in Obesity Prevention, March 23, Irvine, CA.
Krebs-Smith, S. M., J. Reedy, and C. Bosire. 2010. Healthfulness of the U.S. food supply: Little improvement despite decades of dietary guidance. American Journal of Preventive Medicine 38(5):472-477.
Kubik, M. Y., M. Wall, L. Shen, M. S. Nanney, T. F. Nelson, M. N. Laska, and M. Story. 2010. State but not district nutrition policies are associated with less junk food in vending machines and school stores in US public schools. Journal of the American Dietetic Association 110(7):1043-1048.
Masse, L. C., M. M. Frosh, J. F. Chriqui, A. L. Yaroch, T. Agurs-Collins, H. M. Blanck, A. A. Atienza, M. L. McKenna, and J. F. Igoe. 2007. Development of a School Nutrition-Environment State Policy Classification System (SNESPCS). American Journal of Preventive Medicine 33(4 Suppl. 4):S277-S291.
McNamara, P. E., C. K. Ranney, L. S. Kantor, and S. M. Krebs-Smith. 1999. The gap between food intakes and the pyramid recommendations: Measurement and food system ramifications. Food Policy 24(2-3):117-133.
Oldenburg, B., J. F. Sallis, D. Harris, and N. Owen. 2002. Checklist of Health Promotion Environments at Worksites (CHEW): Development and measurement characteristics. American Journal of Health Promotion 16(5):288-299.
Patterson, R. E., A. R. Kristal, L. Biener, J. Varnes, Z. Feng, K. Glanz, G. Stables, R. M. Chamberlain, and C. Probart. 1998. Durability and diffusion of the nutrition intervention in the Working Well Trial. Preventive Medicine 27(5 I):668-673.
Sallis, J. F., P. R. Nader, J. W. Rupp, C. J. Atkins, and W. C. Wilson. 1986. San Diego surveyed for heart-healthy foods and exercise facilities. Public Health Reports (Washington, D.C.: 1974) 101(2):216-219.
Story, M., K. M. Kaphingst, R. Robinson-O’Brien, and K. Glanz. 2008. Creating healthy food and eating environments: Policy and environmental approaches. Annual Review of Public Health 29:253-272.
Wang, M. C., A. A. Gonzalez, L. D. Ritchie, and M. A. Winkleby. 2006. The neighborhood food environment: Sources of historical data on retail food stores. International Journal of Behavioral Nutrition and Physical Activity 3:15.


