
Key Points Noted in Presentations
• The National Collaborative on Childhood Obesity Research (NCCOR) is a collaborative effort designed to improve the efficiency, effectiveness, and application of research related to childhood obesity. It has developed new tools for obesity researchers: (1) a Measures Registry—a searchable online registry of diet and physical activity measures at the individual and environmental levels; and (2) a Catalogue of Surveillance Systems—an online directory of national, state, and local data resources available at multiple levels.
• The body mass index (BMI) can be useful in screening to identify those at either an elevated weight for height or a low weight for height, but it is not a precise measure of adiposity and must be interpreted with care. The significance of this ratio is affected by variations in body structure across ethnic groups, growth and development in children and adolescents, and loss of height with aging.
• From one economist’s perspective, the argument that reducing and preventing obesity will save money is not robust. Improvements in measurement and analyses would strengthen the ability to support detailed claims for most interventions. An argument based on cost-effectiveness—taking into account the trade-offs that come with any intervention and focusing on health benefits rather than cost savings—may be more effective.
In addition to measures of the built environment for physical activity and of the food and nutrition environment, there are measures, data resources, and methods that relate to both of these environments and may help researchers and policy makers assess progress in obesity prevention. Robin McKinnon, health policy specialist in the Risk Factor Monitoring and Methods Branch at the National Cancer Institute, described research activities of the National Collaborative on Childhood Obesity Research. Robert Malina, professor emeritus in the Department of Kinesiology and Health Education at the University of Texas, Austin, and research professor in the Department of Kinesiology at Tarleton State University, described research related to growth and BMI. Roland Sturm, senior economist at RAND and professor of policy analysis at the RAND Pardee Graduate School, discussed economic perspectives on nutrition, physical activity, and obesity interventions.
NEW TOOLS FOR CHILDHOOD OBESITY RESEARCH
Presenter: Robin McKinnon
The National Collaborative on Childhood Obesity Research is an effort to enhance coordination of activities related to childhood obesity research.1 Four of the major funders in this area—the Centers for Disease Control and Prevention (CDC), the National Institutes of Health (NIH), the Robert Wood Johnson Foundation (RWJF), and the U.S. Department of Agriculture (USDA)—joined forces to improve the efficiency, effectiveness, and application of research related to childhood obesity, McKinnon explained. Newly available NCCOR tools are designed to address a range of issues facing researchers interested in childhood obesity, she noted. To make optimal research decisions, researchers need to know, for example, what data resources exist and how to gain access to them, how much they cost, and which variables can be linked across data systems, as well as what measures exist and which ones have been tested for validity and reliability.
NCCOR’s priorities include promoting the use of common measures and methods across childhood obesity prevention efforts and research, and encouraging the development of standard measures with which to describe and evaluate interventions, especially projects that address policies and environments, McKinnon explained. NCCOR has produced a new Measures Registry to facilitate access to available measures, identify gaps in measures, and foster the development of new measures. This searchable,
________________
1 For more information about NCCOR, see www.nccor.org (accessed August 26, 2011). NCCORs Measures Registry is available at www.nccor.org/measures, the Catalogue of Surveillance Systems at www.nccor.org/css.
web-based tool includes nearly 750 measures in four domains: individual dietary behavior, individual physical activity behavior, the food environment, and the physical activity environment. Questionnaires, diaries, logs, electronic devices, and direct observations of people and environments are among the types of measures included.
The Measures Registry provides such information as which domains are measured; validity and reliability; settings, geographic areas, and populations measured; and protocols for use. Measures in the registry focus on individual behaviors and the environments that may affect those behaviors. Information in the registry is based on literature searches, a best-practice review, lists of recommended measures prepared by experts in the areas covered, and a tailored abstraction tool. The registry allows users to search and browse for measures, search for specific details related to those measures, link to other measures and other studies that have been conducted using a particular measure, and find measures that are in development and have not yet been published. Researchers may also submit their own measures for inclusion.
NCCOR also has developed the Catalogue of Surveillance Systems, which is intended to increase awareness and use of existing obesity-related data resources at the individual, household, organizational, community, and macro/policy levels. Knowledge of the broad array of relevant surveillance systems has been limited, given that there has been no easy way to locate these systems. In addition, relatively little research has taken advantage of possibilities for linking data across the spectrum of influences on behavior.
As of the time of the workshop, 77 surveillance systems, providing national, state, and local data, were featured in the catalogue, which is updated continually. Only systems that provide data collected in the United States within the last 10 years and make raw data publicly available (so that researchers can access and manipulate the data for themselves) are included. Extensive reviews are part of the process of selecting systems for inclusion and creating their web-based profiles. Using the catalogue, researchers can search by topic, compare system attributes, and gain access to related resources such as summary statistics or legislative databases. Figure 4-1 illustrates the breadth of the resources represented in the catalogue, superimposed on an ecological model of factors that influence obesity.
NCCOR has plans for sustaining and updating these two resources, McKinnon explained, and for expanding awareness of what they have to offer. She also noted some early feedback that can be used in assessing the measures and data resources featured in the NCCOR tools. Although a wide range of measures already is available, she observed, the degree to which they have been tested for validity and reliability varies considerably. Relatively few surveillance systems include measured height and weight data (instead, most include self-reported data), and very few include objective
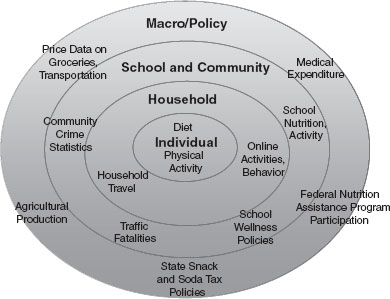
FIGURE 4-1 Example of the breadth of resources or data sets represented within the NCCOR Catalogue of Surveillance Systems, categorized by levels of a social ecological model.
SOURCE: McKinnon, 2011.
measures of physical activity. Data from nutrient and food group databases can be linked to individual surveys, but not to surveys of grocery stores or markets. Also, surveillance of obesity-related policies is limited. McKinnon concluded by noting that NCCOR is working to build awareness of resources already available, to identify gaps and priorities for future work, to spur innovation in research, and ultimately to reduce rates of childhood obesity.
Presenter: Robert Malina
BMI is the most frequently used measure of individuals’ weight status. Malina described its use and a number of related issues. BMI—an index of weight for height—was originally developed by Adolphe Quetelet, a 19th-century sociologist who calculated it in terms of weight in kilograms divided by height in meters squared (it was called the Quetelet Index until the early 1970s). Its primary use is as a screening tool to identify those at
an elevated weight for height or a low weight for height. Current BMI standards for overweight and obesity in the United States are based on weight for height distributions from certain health surveys over a period of time. The World Health Organization (WHO) defines an adult as overweight if his or her BMI is at or above 25 kg/m2. Children and adolescents in the United States are classified based on growth charts developed by CDC, and are considered overweight if they are between the 85th and 95th percentiles in weight for their age and obese if they are at or above the 95th percentile.
Even these simple calculations, however, raise issues, Malina noted. CDC did not include weight data from the 1988-1994 National Health and Nutrition Examination Survey (NHANES)2 in determining overweight and obesity criteria for U.S. growth charts because the gain in weight across surveys was viewed as undesirable from a public health perspective, Malina explained, even though that survey was the first to reveal the obesity epidemic.
In most countries, people use the International Obesity Task Force (IOTF) criteria for overweight and obesity. These criteria were derived from a data set based on six cross-sectional studies that includes U.S. data collected in the 1970s and 1980s—before the obesity epidemic had emerged, Malina noted. As Figures 4-2 and 4-3 show, however, use of these criteria results in significantly different prevalence rates of overweight and particularly of obesity for male (Figure 4-2) and female (Figure 4-3) children and adolescents.
BMI growth rates vary significantly among children, Malina added. At birth children are fairly consistent in size, but they follow their own trajectories as they grow. Based on data for French children, Rolland-Cachera and colleagues (1991) show (Figure 4-4) that there is a rapid rise in BMI from birth to age 1 or 2, followed by a gradual decline into middle childhood. This phase is followed by an “adiposity rebound,” as Rolland-Cachera calls it, which may have important implications for children’s later rates of overweight and obesity. Children who begin this rebound early—before age 5 ½—are more likely to have a higher BMI in young adulthood than are those who begin the rebound after age 7, said Malina.
Other evidence reinforces this point, Malina explained. Children who are more active at ages 4 to 11 years experience the rebound at later ages and are not as fat in early adolescence as less active children (Moore et al., 2003). Thus, the “rebound” period may be an important window for intervention, Malina suggested. Not only would it potentially be valuable to delay the rebound, but there is also reason to believe that children’s basic
________________
2For more information about NHANES, see http://www.cdc.gov/nchs/nhanes.htm (accessed August 2011).
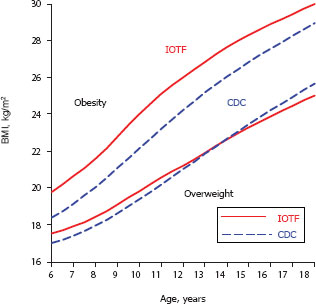
FIGURE 4-2 Differences in overweight and obesity prevalence among male children and adolescents using Centers for Disease Control and Prevention (CDC) criteria versus International Obesity Task Force (IOTF) criteria.
NOTE: Based on CDC percentiles for overweight and obesity and IOTF cut-offs for overweight and obesity.
SOURCE: Malina, 2011.
movement skills are fairly set by age 6 or 7 years, and that obese youngsters have deficiencies in movement coordination that limit their physical activity opportunities as they age. Workshop participants suggested that the best target for intervention might be even earlier if data indicating that very young children who are overweight or obese have significantly increased odds of being so as adults and experiencing the health problems that often come with excess weight.
Greater variation in weight trajectory is evident as children enter adolescence, Malina explained, because of the differential timing of growth spurts. Generally, these spurts affect height first—the legs and then the trunk—and then weight. Girls experience the spurts significantly earlier than do boys, Malina added, but he noted that it is necessary to view data collected across at least 5 or 6 consecutive years of growth to see the patterns. Looking only at maturity indicators, such as stages of puberty, age at menarche, or peak height velocity (the period of fastest growth) is a limited
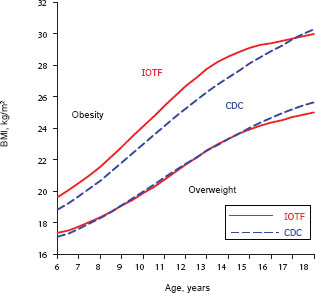
FIGURE 4-3 Differences in overweight and obesity prevalence among female children and adolescents using Centers for Disease Control and Prevention (CDC) criteria versus International Obesity Task Force (IOTF) criteria.
NOTE: Based on CDC percentiles for overweight and obesity and IOTF cut-offs for overweight and obesity.
SOURCE: Malina, 2011.
approach, he noted, because these measures identify discrete milestones or stages that are really part of a continuous process lasting several years. Youngsters reach these stages at a range of ages, and chronological age matters as well. For example, observed Malina, “A post-menarcheal 11 year-old girl is very different from a pre- or post-menarcheal 14 year-old girl.”
The significance of the timing of growth spurts is suggested by findings from the Leuven Growth Study (Beunen et al., 1994). This mixed longitudinal study of boys in Belgium revealed that those who attained their peak height velocity at earlier ages had higher BMIs than those who did so later, and that this difference lasted at least until age 30. Two other studies (Guo et al., 1994; Rolland-Cachera et al., 1991) reinforced the connection between elevated BMI levels during childhood and adolescence and in young adulthood. In particular, Malina noted, study data from Guo and colleagues (1994) showed that youngsters at the higher BMI percentiles (e.g., 75th, 85th, 95th) were most at risk for obesity at age 35.
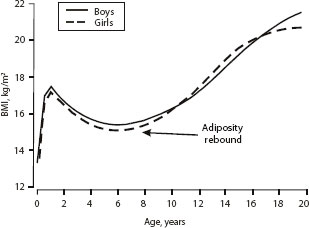
FIGURE 4-4 The rapid rise in BMI from birth to age 1 or 2 years is followed by a decline and then an “adiposity rebound” in middle childhood.
SOURCE: Adapted, with permission, from R. M. Malina, C. Bouchard, and O. Bar-Or, 2004, Growth, maturation, and physical activity, 2nd ed. (Champaign, IL: Human Kinetics), 64. Data from M. F. Rolland-Cachera, T. J. Cole, M. Sempe, et al., 1991, “Body mass index variations: Centiles from birth to 87 years,” European Journal of Clinical Nutrition 45:13-21.
Also important, Malina observed, is that BMI is an indicator of weight for height, not of fatness. The calculation does not discriminate between lean and fat tissue, and the correlation between BMI and percentage fat varies by individual. BMI is about equally correlated with fat-free mass (lean tissue) and fat mass and percentage fat in youth (Malina and Katzmarzyk, 1999). For men, he added, the correlation between BMI and percentage lean tissue is greater than the correlation between BMI and percentage fat tissue (Romero-Corral et al., 2008). The reverse is true for women, which probably reflects sex differences in the ratio of lean to fat tissue, Malina explained.
Figure 4-5 illustrates the point: the upper right and lower left quadrants on both graphs represent men and women for whom BMI and percentage fat tissue are either both above or both below the target range. The upper left and lower right quadrants on both graphs represent those for whom the two measures do not match. Thus, Malina explained, “something is being missed by the BMI.”
Another issue to consider is that people lose height as they age, a fact that should be taken into account in the interpretation of BMI measures. As data from Sorkin and colleagues (1999) and others show, the decrease usually
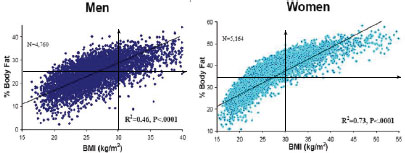
FIGURE 4-5 Age- and race-adjusted correlation between body mass index and body fat percentage for men and women less than 60 years of age.
NOTE: The World Health Organization reference standard for obesity is body fat >25 percent in men and >35 percent in women; the Centers for Disease Control and Prevention defines obesity as BMI >30 kg/m2, as indicated by the arrows in the figure.
SOURCE: Adapted by permission from Macmillan Publishers Ltd: [International Journal of Obesity] Romero-Corral, A., V. K. Somers, J. Sierra-Johnson, R. J. Thomas, M. L. Collazo-Clavell, J. Korinek, T. G. Allison, J. A. Batsis, F. H. Sert-Kuniyoshi, and F. Lopez-Jimenez. “Accuracy of Body Mass Index in Diagnosing Obesity in the Adult General Population.” International Journal of Obesity 32, no. 6 (2008).
begins at age 30 to 35 and accelerates after age 55, with women losing height more rapidly than men. Body composition also varies, on average, among ethnic groups, Malina added. Asian populations, for example, tend to have lower BMIs but higher percentages of body fat than other groups, as well as more abdominal fat at lower BMI levels (Malina, 2005). Thus, WHO has identified different overweight and obesity thresholds for these populations (WHO, 2000). In general, people who are shorter in stature and have shorter legs will have higher BMIs, and the distribution of fat in the body also varies with ethnicity (Malina, 2005; Malina et al., 1995).
These points suggest that BMI may be a less sensitive indicator of health concerns for some populations than for others, Malina observed. A number of observers have suggested that other measures—such as waist circumference, an indicator of abdominal fat (which has the greatest health significance), or ratio of waist circumference to height (e.g., Ardern et al., 2004; Cleeman, 2001; Hsieh et al., 2003)—may be better tools for identifying the presence of excess weight that may be a health concern. However, defining the thresholds for these measures is still complex because of variation by ethnicity and other characteristics, Malina explained. A 0.50 waist-to-height ratio has been proposed as the cut-off between normal and overweight individuals in Japan (Hsieh et al., 2003), he noted, but in
another population, the Zapotec Indians of Oaxaca, Mexico (whom he has studied), who are extremely small in stature, the mean waist-to-height ratio is 0.53, and they “are by no means overweight.”
Malina also noted that recent studies of the correlations among different measures have yielded mixed results (Flegal et al., 2009). BMI, waist circumference, and waist-to-height ratio were more strongly correlated with each other (correlations ranged from 0.85 to 0.97) than with measures of percentage of body fat (correlations ranged from 0.65 to 0.87). From another perspective, the data showed that none of the measures were excellent at classifying individuals as normal, overweight, or obese. For example, BMI correctly classified only 46 percent of men and 49 percent of women, while waist circumference correctly classified 51 percent of men and 42 percent of women (Flegal et al., 2009).
In conclusion, Malina commented that BMI is a useful measure that is easy to calculate and is good for showing trends among populations and subgroups. Because it is affected by growth and pubertal maturation, by aging, and by ethnicity it must be interpreted carefully. Research is needed to monitor BMI rates longitudinally, in Malina’s view, “so we can find out how the BMI changes and what factors affect individual change.” For example, little is known about how sensitive BMI is to physical activity, particularly in youngsters, but BMI could be an important tool for tracking the role of physical activity in preventing unhealthy weight gain.
Several participants agreed that BMI and basic height and weight measures can be valuable tools for screening in schools to identify children and families who could benefit from counseling about nutrition and physical activity (several states currently use such screens, Malina noted). Malina cautioned that the information needs to be interpreted and communicated with care, not only because of the variation in healthy physical proportions among ethnic groups, but also because the information can do more harm than good if individuals draw the wrong conclusions—for example, developing anorexic behaviors because of concern about modest excess weight.
MAKING THE ECONOMIC CASE FOR OBESITY PREVENTION
Presenter: Roland Sturm
Making sustainable progress against obesity requires strong public support. Both economic and public health perspectives play an important role in the policy process, and the interventions supported by both perspectives are most likely to be effective and politically acceptable, Sturm explained. Yet there is a gulf between these two research perspectives, and they often appear to be at odds with each other. “Without understanding the economic perspective,” Sturm suggested, “public health professionals will
have limited influence and sometimes may appear out of touch with public opinion.” Sturm suggested that the reputation of public health experts is that their focus on health status and willingness to intervene if health could be improved may ignore individual preferences and fail to take into account other important goals that people have. When public health messages seem to be too heavy-handed or out of touch with majority opinion, the messages of industry lobbyists seem more reasonable. “They know how to play the game,” he added, expressing his view that “they resonate with the public” and are talented at communication.
From an economic point of view, health (and even more so a healthy diet or physical activity) is just one of many competing goals that people must reconcile in their daily lives. In contrast to a public health perspective in which decisions are made by experts, an economic perspective tackles questions with the assumption that people can and do make their own decisions, Sturm said. In the United States, more than in most other countries, the belief in consumer sovereignty has a strong influence and affects how institutions work. Long-standing federal guidelines, for example, require agencies to identify market failures (i.e., situations where market forces by themselves cannot achieve desirable outcomes) before issuing regulations. Moreover, considering benefits and costs, as well as their distribution, is important in deciding what interventions might be valid and useful. Thus, Sturm explained, interventions are most likely to be successful and politically sustainable when public health and economic perspectives are integrated.
Cost-effectiveness or cost-utility analysis is applicable to obesity prevention, Sturm explained, because the goal is to improve health in an optimal way, given constrained resources. In this sort of analysis, economists prefer to quantify outcomes using natural units, which in this instance might be cases of obesity or disease prevented, or life-years saved, perhaps accounting also for years of disability saved. Since the field may not readily produce those units, a more general measure is used, such as morbidity and mortality rates. Economists also strive to account honestly for all costs of an intervention, and Sturm stressed that when this is not done, the credibility of the analysis is undermined, and the result is likely to polarize the debate further rather than broaden support for the intervention. Obesity prevention efforts cost money, and making a strong case for such efforts requires more than saying they improve health, Sturm observed. Nor should we make promises that may not be fulfilled, he said. He shared his belief that from an empirical point of view, the claim that money could be saved is almost certainly wrong, saying that prevention improves health but “almost never saves costs.” Of course, obesity is associated with higher health care costs, and preventing obesity would avoid these excess expenditures, which are about one-third higher among obese than nonobese individuals
and even double among those with a BMI more than 40 (Andreyeva et al., 2004; Sturm, 2002). Yet Sturm posed the question of whether there would actually be cost savings after intervention costs were taken into account. He noted that promises of such savings have been made in other areas and reliably failed to materialize on a larger scale (Sturm, 2001). In his view, however, an even larger conceptual flaw is involved in trying to justify obesity prevention with an offset in medical costs. If reducing costs were the true goal, he observed, eliminating doctors and hospitals—or increasing smoking, which could lead to earlier deaths and thus save the costs of Social Security pensions and Medicare—would be a surer way to accomplish that goal.
Sturm summarized his points by explaining that cost-effective is not the same as cost savings. Cost-effective means “good value for the resources compared to alternative interventions or policies,” he said, reiterating his belief that cost savings are unlikely to exist for many obesity interventions.
Turning next to the sorts of evidence he believes would be useful in developing an approach to obesity prevention, Sturm described a review of behavioral physical activity interventions. Wu and colleagues (2011) identified 91 such interventions for which there was evidence of effectiveness and for which cost information was available. They calculated cost-effectiveness ratios for these interventions and found that the ratios ranged from $0.001 to $60 per MET3 hour. They found that the most cost-effective interventions were also the least expensive per individual reached, but also had only “tiny” absolute effects. The least cost-effective interventions were those that provided some type of social support as part of an effort to promote behavior change in individuals. If we could take those published estimates at face value, Sturm said, they would provide exactly the information needed to develop the most cost-effective obesity prevention interventions. Unfortunately, while this is the direction research should pursue more intensively, the research field is not yet at this point, Sturm noted. One indication is the wide range of cost-effectiveness among interventions designed to improve access to opportunities for physical activity or community-wide health campaigns. To further illustrate his point, Sturm analyzed the quality of 136 studies of physical activity interventions cited in the appendix of the systematic review by Wu and colleagues (2011) and compared the effects reported. After controlling for such factors as whether the study was a randomized trial, length of follow-up, and degree of attrition, he found that
________________
3MET = metabolic equivalent of the task. One MET hour is the equivalent of the energy expended by the body during 1 hour of rest and is standardized based on body weight. Several MET hours of exercise can be accumulated during 1 real-time hour; for example, 1 hour of moderate walking is approximately equal to 3 MET hours (http://www.johnshopkinshealthalerts.com/alerts/healthy_living/JohnsHopkinsHealthyLivingHealthAlert_1821-1.html; http://mbsrunner.com/mtp/Forms/glossaryreg.aspx).
the lower the quality of the evaluation, the lower was the cost-effectiveness ratio (dollars per increase in activity) that was found. In other words, the most positive results came from the weakest studies.
At present, Sturm noted, no single study provides sufficient information to support cost-effectiveness analysis for many of the most common policy suggestions, such as food taxes, advertising bans, or fast-food bans. An alternative is to use modeling or simulation approaches (e.g., Levy et al., 2011). However, these approaches are still in the developmental stage. The best example to date is the Australia Assessing Cost-Effectiveness in Obesity (ACE-Obesity) project, which has produced a number of publications (e.g., Magnus et al., 2009; Moodie et al., 2009, 2010; Sacks et al., 2011). ACE-Obesity uses a speculative measure of health outcomes, and more reliable estimates of effectiveness are needed for this work to inform policy, Sturm said. Noting that the general approach is promising, he discussed a few of that project’s findings. Traffic-light nutrition labeling (an approach used in Australia and the United Kingdom, in which red, yellow, and green color symbols indicate foods that are unhealthy, okay occasionally, and healthy) and junk food taxes appeared to be highly cost-effective (Sacks et al., 2011), although Sturm noted that some of the underlying assumptions used in these studies are questionable. Removing television advertising for unhealthy foods also appeared to be highly cost-effective among Australian children (Magnus et al., 2009).
The picture is similar for cost-effectiveness analysis of the built environment, Sturm explained. The methodology of the available studies varies significantly, limiting the conclusions that can be drawn (Feng et al., 2010). In Sturm’s view, the findings that are frequently cited in public debate have been “cherry-picked and are likely to dramatically overstate possible outcomes.” Further, the details of some interventions under discussion (e.g., increasing the number of supermarkets in underserved areas) are not sufficient for costs to be calculated.
The rate of false published research results is high in new and competitive research topics that are still “quite experimental,” in Sturm’s view. This does not mean that this research area is inherently flawed, but rather that more systematic research is needed. It is a well-documented phenomenon in new fields that some initial results do not hold up when replicated, Sturm said, citing as an example findings that there are genetic markers for obesity and diabetes, which could not be replicated (Redden and Allison, 2003). The key to improving policy recommendations is to accelerate this “shake down” phase in the obesity prevention area through systematic replications, he suggested.
“[Publication] biases may be amplified in the policy process,” Sturm added. Policy makers have a natural tendency to use the most convenient data. Cohen and colleagues (2010, p. 88) write, “it may be politically more
expedient to promote an increase in consumption of healthy items rather than a decrease in consumption of unhealthy items, but it may be far less effective.”
Sturm offered several recommendations for identifying more efficient and sustainable means of preventing and reducing obesity:
• Integrating economic perspectives with public health goals—specifically, taking into account the many trade-offs involved in such decisions—will help to minimize ideological battles and build broader support for interventions.
• Sturm urged policy makers and others to make an argument based on health benefits and avoid using the argument that an intervention will save money, stating his opinion that the latter argument is “not credible, conceptually flawed, and likely to be counterproductive.”
• Sturm also argued that cost-effectiveness estimates for obesity prevention measures need further development and are most suitable at this stage for identifying broad classes of interventions that are more or less cost-effective. It is difficult to conduct more detailed comparisons of cost-effectiveness with currently available data. Modeling and simulation are more usable now, Sturm added, although even these approaches are in the early stages of development.
• It is important to avoid exaggerating the findings from early research. Emerging areas of investigation commonly yield high rates of false positives and overestimates of effects, and such results are often not replicated in later studies. “This is a good, healthy process,” Sturm explained. “We just have to watch out for it.”
• At the same time, replication is important, Sturm added. Promising results from early studies need to be tested with different data sets. It can be difficult to secure funders for replication studies, but policy makers need these possibly less visible, second-round studies if they are to have reliable and credible data.
• Sturm urged the field to “keep a diversified portfolio.” At present, the evidence is not strong enough to support dedicating major investments in particular areas, and doing so would likely squeeze out less ambitious but possibly more promising interventions.
Participants had a number of comments and questions about Sturm’s perspective. One suggested that the logical implication of his view is that if there is no clear evidence that reducing obesity rates saves money, there must not be a problem, asking “Why don’t we all just be fat and not worry about it?” Others shared this concern, noting, for example, that the diseases
(such as heart disease and diabetes) that account for 80 percent of health care costs in the United States are all obesity related. They questioned how it then could be possible that investing resources in reducing obesity is not cost-effective.
Sturm reiterated his basic argument that “we don’t have doctors to save medical costs; we have doctors to improve health care.” Acknowledging the importance of this point, a participant suggested that members of the health community turn to cost arguments because they do not know how to frame the potentially stronger arguments about the intrinsic value of improving health outcomes. But she lamented that the economists’ perspective does not appear to offer a way to bolster the health argument. Another participant agreed that it is difficult to make the case for interventions because while they can be demonstrated to work, people tend to revert to their former behaviors as soon as an intervention stops. Convincing people to believe in interventions designed not only to reduce but also to prevent obesity is thus very challenging. Another participant observed that the argument could be taken as more about messaging than about economics. Sturm closed with the observation that “we want to maximize health benefits,” but resources are limited. Ideally, cost-effectiveness analyses would support optimal decisions, but “we need to make them better,” he said.
Andreyeva, T., R. Sturm, and J. S. Ringel. 2004. Moderate and severe obesity have large differences in health care costs. Obesity Research 12(12):1936-1943.
Ardern, C. I., I. Janssen, R. Ross, and P. T. Katzmarzyk. 2004. Development of health-related waist circumference thresholds within BMI categories. Obesity Research 12(7): 1094-1103.
Beunen, G., R. M. Malina, J. Lefevre, A. L. Claessens, R. Renson, J. Simons, H. Maes, B. Vanreusel, and R. Lysens. 1994. Size, fatness and relative fat distribution of males of contrasting maturity status during adolescence and as adults. International Journal of Obesity 18(10):670-678.
Cleeman, J. I. 2001. Executive summary of the third report of the National Cholesterol Education Program (NCEP) expert panel on detection, evaluation, and treatment of high blood cholesterol in adults (adult treatment panel III). Journal of the American Medical Association 285(19):2486-2497.
Cohen, D. A., R. Sturm, M. Scott, T. A. Farley, and R. Blumenthal. 2010. Not enough fruit and vegetables or too many cookies, candies, salty snacks, and soft drinks? Public Health Reports 125(1):88-95.
Feng, J., T. A. Glass, F. C. Curriero, W. F. Stewart, and B. S. Schwartz. 2010. The built environment and obesity: A systematic review of the epidemiologic evidence. Health and Place 16(2):175-190.
Flegal, K. M., J. A. Shepherd, A. C. Looker, B. I. Graubard, L. G. Borrud, C. L. Ogden, T. B. Harris, J. E. Everhart, and N. Schenker. 2009. Comparisons of percentage body fat, body mass index, waist circumference, and waist-stature ratio in adults. American Journal of Clinical Nutrition 89(2):500-508.
Guo, S. S., A. F. Roche, W. C. Chumlea, J. D. Gardner, and R. M. Siervogel. 1994. The predictive value of childhood body mass index values for overweight at age 35 y. American Journal of Clinical Nutrition 59(4):810-819.
Hsieh, S. D., H. Yoshinaga, and T. Muto. 2003. Waist-to-height ratio, a simple and practical index for assessing central fat distribution and metabolic risk in Japanese men and women. International Journal of Obesity 27(5):610-616.
Levy, D. T., P. L. Mabry, Y. C. Wang, S. Gortmaker, T. T. K. Huang, T. Marsh, M. Moodie, and B. Swinburn. 2011. Simulation models of obesity: A review of the literature and implications for research and policy. Obesity Reviews 12(5):378-394.
Magnus, A., M. M. Haby, R. Carter, and B. Swinburn. 2009. The cost-effectiveness of removing television advertising of high-fat and/or high-sugar food and beverages to Australian children. International Journal of Obesity 33(10):1094-1102.
Malina, R. M. 2005. Variation in body composition associated with sex and ethnicity. In Human body composition. 2nd ed., edited by S. B. Heymsfield, T. G. Lohman, Z. M. Wang, and S. B. Going. Champaign, IL: Human Kinetics. Pp. 271-298, 473-476.
Malina, R. M. 2011. Body mass index: For better or worse. Presented at the Institute of Medicine Workshop on Measurement Strategies for Accelerating Progress in Obesity Prevention, March 23, Irvine, CA.
Malina, R. M., and P. T. Katzmarzyk. 1999. Validity of the body mass index as an indicator of the risk and presence of overweight in adolescents. American Journal of Clinical Nutrition 70(Suppl.):131S-136S.
Malina, R. M., Y. C. Huang, and K. H. Brown. 1995. Subcutaneous adipose tissue distribution in adolescent girls of four ethnic groups. International Journal of Obesity 19(11):793-797.
Malina, R. M., C. Bouchard, and O. Bar-Or. 2004. Growth, maturation, and physical activity. 2nd ed. Champaign, IL: Human Kinetics.
McKinnon, R. A. 2011. Measures registry & catalogue of surveillance systems. Presented at the Institute of Medicine Workshop on Measurement Strategies for Accelerating Progress in Obesity Prevention, March 23, Irvine, CA.
Moodie, M., M. Haby, L. Galvin, B. Swinburn, and R. Carter. 2009. Cost-effectiveness of active transport for primary school children—Walking School Bus program. International Journal of Behavioral Nutrition and Physical Activity 6:63.
Moodie, M. L., R. C. Carter, B. A. Swinburn, and M. M. Haby. 2010. The cost-effectiveness of Australia’s active after-school communities program. Obesity 18(8):1585-1592.
Moore, L. L., D. Gao, M. L. Bradlee, L. A. Cupples, A. Sundarajan-Ramamurti, M. H. Proctor, M. Y. Hood, M. R. Singer, and R. C. Ellison. 2003. Does early physical activity predict body fat change throughout childhood? Preventive Medicine 37(1):10-17.
Redden, D. T., and D. B. Allison. 2003. Nonreplication in genetic association studies of obesity and diabetes research. Journal of Nutrition 133(11):3323-3326.
Rolland-Cachera, M. F., T. J. Cole, M. Sempe, J. Tichet, C. Rossignol, and A. Charraud. 1991. Body mass index variations: Centiles from birth to 87 years. European Journal of Clinical Nutrition 45(1):13-21.
Romero-Corral, A., V. K. Somers, J. Sierra-Johnson, R. J. Thomas, M. L. Collazo-Clavell, J. Korinek, T. G. Allison, J. A. Batsis, F. H. Sert-Kuniyoshi, and F. Lopez-Jimenez. 2008. Accuracy of body mass index in diagnosing obesity in the adult general population. International Journal of Obesity 32(6):959-966.
Sacks, G., J. L. Veerman, M. Moodie, and B. Swinburn. 2011. “Traffic-light” nutrition labelling and “junk-food” tax: A modelled comparison of cost-effectiveness for obesity prevention. International Journal of Obesity 35(7):1001-1009.
Sorkin, J. D., D. C. Muller, and R. Andres. 1999. Longitudinal change in the heights of men and women: Consequential effects on body mass index. Epidemiologic Reviews 21(2):247-260.
Sturm, R. 2001. The myth of medical cost offset. Psychiatric Services 52(6):738-740.
Sturm, R. 2002. The effects of obesity, smoking, and drinking on medical problems and costs. Health Affairs 21(2):245-253.
WHO (World Health Organization). 2000. Obesity: Preventing and managing the global pandemic. Technical report series no. 894. Geneva, Switzerland: WHO.
Wu, S., D. Cohen, Y. Shi, M. Pearson, and R. Sturm. 2011. Economic analysis of physical activity interventions. American Journal of Preventive Medicine 40(2):149-158.


