
2
Physical Activity and the Built Environment
Key Points Noted in Presentations
• Physical activity is encouraged or discouraged by characteristics of the physical and built environment (such as walkability or the availability and condition of parks and recreational spaces), none of which are under the control of the public health sector.
• Researchers use surveys, observations or audits, geographic information system (GIS)-based data, policy measures, and crime data to assess physical activity environments and policies, but a surveillance system that provides accurate, reliable, and complete data currently does not exist.
• Non-health sectors need to be engaged in the collection of these data because data related to the built environment are not routinely collected by the health sector.
• Clear national objectives need to be established for the collection and use of data related to physical activity environments.
The reasons people become overweight or obese are multifaceted, but the story begins with a mismatch between calories consumed and the body’s capacity to burn that energy. Many factors influence the rate at which an individual burns calories and the number of calories he or she consumes
and burns in a day, but the environments in which people live can have a profound impact on the amount of physical activity in which they engage. Public policy plays a role: declines in the rates at which children walk to school and adults use public transportation, for example, have coincided with the obesity epidemic, and such trends in part reflect changes in zoning and land use, funding for public transportation, and other policies. James Sallis, professor of psychology at San Diego State University, and Christine Hoehner, assistant professor in the Division of Public Health Sciences at Washington University in St. Louis, discussed the environmental and policy factors that likely affect physical activity levels, especially in young people; the pros and cons of existing ways of measuring the effects of the environment; and possible ways to improve measurement in this area.
ENVIRONMENTAL AND POLICY INFLUENCES ON PHYSICAL ACTIVITY
Presenter: James F. Sallis
An ecological model of health behavior, Sallis explained, is a way of taking into account the impacts of society and culture, the physical environment, and public policy on the behavior of individuals, who are also influenced by biological and psychological factors and their own skills and knowledge. Figure 2-1 illustrates the complexity of the ways in which the environment affects levels of physical activity. The shaded circle represents the four domains in which people can be active: at home, at work or school, during recreation, and in moving from place to place. The other circles depict the many factors that influence how active people are in each domain. Thus, for example, the upper right quadrant shows how people’s level of activity while commuting, doing errands, and making other trips depends on their own characteristics; their perceptions of how convenient and accessible different modes of transport might be; the characteristics of the immediate environment (e.g., paths for biking and walking, traffic); and policies such as zoning codes, traffic management, and investments in public transportation.
Settings where it is possible to walk and bike to everyday destinations and to engage in outdoor recreation (such as in parks and playground) support physical activity. What these settings have in common, Sallis noted, is that none of them are under the control of the public health sector. He explained that policies, whether formal or informal, issued by government or the private sector, can affect physical activity in four ways. First, zoning and building codes and the design of transportation and recreation facilities all affect the built environment. Second, policies affect programs, such as physical education requirements in schools and sports programs and
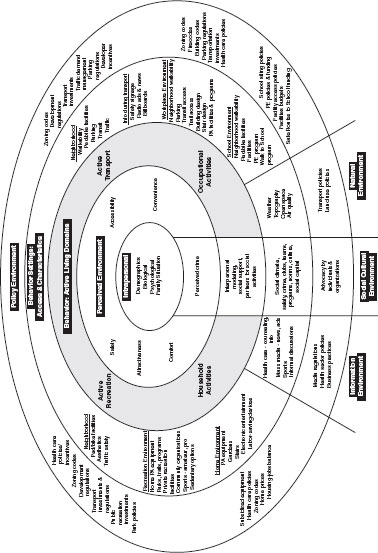
FIGURE 2-1 Ecological model of four domains of active living.
NOTES: PA = physical activity; PE = physical education; ped = pedestrian.
SOURCE: Sallis et al., 2006. Annual Review of Public Health Copyright 2005 by ANNUAL REVIEWS, INC. Reproduced with permission of ANNUAL REVIEWS, INC. in the format Other book via Copyright Clearance Center.
leagues in parks and recreation centers. Policies can also offer incentives, such as insurance discounts, subsidies for parking or commuting by bicycle, or cash in lieu of parking subsidies for workers who commute without cars. Finally, whatever the approach, secure funding for policies and programs is a critical element.
Researchers have examined the relationships among these factors and physical activity systematically, and Sallis summarized their findings on attributes of the built environment (Sallis and Kerr, 2006). One example is walkability. Numerous studies have shown that when it is easy to walk to school, work, and local businesses, people do walk, as well as ride bicycles, more. A more modest number of studies have shown that people are more likely to walk where there are sidewalks, although the relationship here is less consistent. People who live near parks, private health clubs, playgrounds, and other recreational facilities engage in more physical activity, researchers have found, but the aesthetic characteristics of the facilities make a difference. Thus, not surprisingly, a park that is run down and not kept clean and safe is less likely to attract those who live nearby to engage in physical activity. In answer to a question, Sallis noted that a small amount of research has begun to explore the associations between the built environment and levels of fitness, although one would expect the higher activity levels in supportive environments to lead to increased fitness.
Sallis presented preliminary results from a review he and colleagues were conducting of several hundred studies of the specific associations between attributes of the built environment and physical activity levels in youth (Figures 2-2a and 2-2b). The results are in line with the general findings from studies of adults. However, studies of youth appear to show less consistent associations between neighborhood environments and physical activity. The bars represent the percentages of studies that demonstrate the associations one would expect for particular features, and they point to features that might be most rewarding from a policy perspective, such as walkability. For youth, the most consistent associations are with mixed land use (a component of walkability) and access to parks and recreational facilities. Findings differed according to whether environmental attributes and physical activity were measured objectively or by self-report.
For reducing childhood obesity, Sallis added, characteristics of schools are key. He noted that the quantity and quality of physical education time, recess, classroom breaks, after-school programs and joint-use agreements that allow community access after school hours, the nature of the school grounds, and the distance of schools from students’ homes all are related to activity levels. Measuring the degree to which these features influence
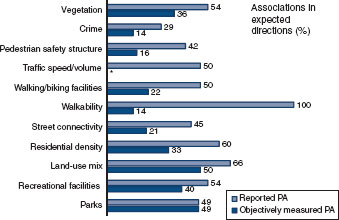
FIGURE 2-2a Associations between objectively measured attributes of the built environment and physical activity among youth.
NOTE: Data presented were preliminary; final results were separated by children aged 3-12 and adolescents aged 13-18 and are presented in Ding and colleagues (2011). PA = physical activity. * Data not reported for objectively measured PA for this attribute.
SOURCE: Sallis, 2011.
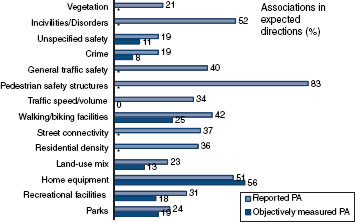
FIGURE 2-2b Associations between perceived attributes of the built environment and physical activity among youth.
NOTE: Data presented were preliminary; final results were separated by children aged 3-12 and adolescents aged 13-18 and are presented in Ding and colleagues (2011). PA = physical activity. * Data not reported for objectively measured PA for this attribute.
SOURCE: Sallis, 2011.
physical activity would require another, more complicated, type of analysis, he noted in response to a question. He concluded from these preliminary results that there is strong support for the value of a few features, whereas others have not been extensively studied.
Sallis summarized the role of policy in Table 2-1. The table shows the relationships among attributes that can influence physical activity, the policies that shape those attributes, and the decision makers who can implement the policies.
TABLE 2-1 Relationships Among Selected Influences on Physical Activity
| Environment Attribute | Policy Determinant | Decision Makers |
| Mixed land use | Zoning | Local governments (as informed by planning officials) |
| Street connectivity | Guidelines, standards | Institute of Transportation Engineers; developers; local governments |
| Residential density | Zoning | Local governments (as informed by planning officials) |
| Pedestrian/bicycle facilities | Transport/complete streets* | Transportation departments; state and local governments |
| Traffic volume/speed | Transport | Transportation departments; governments |
| Transit access | Transport | Transportation departments; governments |
| Parks, trails | Park and recreation standards and funding | Developers of national standards; local governments |
| Private recreation facilities | Marketplace | Business owners |
| Aesthetics, vegetation | Various | Multiple |
| School grounds, siting | Standards, joint-use agreements | State education departments and governments |
*A complete street is a road designed and operated to be safe for all users, including drivers, bicyclists, transit vehicles and users, and pedestrians of all ages and abilities.
SOURCE: Sallis, 2011.
Given this portrait of the possible ways of boosting physical activity levels, what would be the objectives of measuring progress? First, Sallis observed, one would want to measure the simple presence or absence of an environmental attribute or policy, as well as its characteristics and quality. For example, does the park have a playground? Second, the quality of the attribute should be evaluated. For example, is the equipment in good shape? Is the physical education program required or recommended? Third, are there disparities in access? In using data on these attributes and policies, one must also consider the geographic scale of the measures, Sallis added. For example, if a county had 5 acres of park land for every 1,000 people, one would still want important to know how the parks were distributed by neighborhood, so local-level data are important. Sallis outlined a number of options for measuring environmental attributes and policies.
Surveys
In surveys, people are asked to report on the attributes of their neighborhoods. There are validated measures of attributes of neighborhood environments, and the Centers for Disease Control and Prevention (CDC), for example, has funded a brief survey (Sallis et al., 2010) on neighborhood environments that provides a validated measure. However, Sallis said, validated, self-reported surveys of parks, trails, and school environments are lacking. He also said that measures need to be adapted for racial and socioeconomic status subgroups, and that measures for rural environments are still in development. Sallis believes a survey approach could be used for national surveillance, but research is needed to refine such an approach. Surveys would be the lowest-cost option and could be deployed nationwide relatively quickly.
Observation or Audits
Trained data collectors can count streets, parks, trails, and other features, and these counts provide useful data. However, Sallis explained, these data are expensive to collect. They can yield large amounts of information, but there is as yet no accepted method of scoring and summarizing the findings. Researchers also have not yet devised ways to connect these counts to people’s behaviors or to place them in context. Ideally, Sallis suggested, more concise instruments and improved scoring procedures would allow community or advocacy groups to assess their own neighborhoods. In addition, web-based programs such as Google could be a lower-cost alternative to in-person audits.
Geographic Information System (GIS)
A GIS has been defined as the “integration of software, hardware, and data for capturing, storing, analyzing, and displaying all forms of geographically referenced information.”1 This sort of mapping can provide highly detailed data, for example, about the land devoted to different purposes in a local area and, Sallis explained, has the potential for managing and displaying national-level data as well. At present, however, data are collected by a variety of local and national entities, including tax assessors, departments of parks and transportation, and private companies. The quality and currency of the data are inconsistent, Sallis said, and there is little standardization in what is collected or how, or in what is accessible to researchers. For example, a transportation department might have detailed information about local roads but collect nothing on sidewalks or bicycle facilities because they are not a priority. Thus, Sallis explained, if agencies not typically concerned with public health issues could be persuaded to include health-related data in their collection efforts, and if consensus could be developed on variables, a GIS could be much more useful for collecting data related to physical activity.
Policy Measures
Enumerating and rating policies at the local level that may have an impact on physical activity is another approach. However, Sallis explained, it is difficult to collect information on and monitor local policies, and there is significant variation in their nature and purpose. An online system for tracking such policies would be useful, he suggested, as would increased standardization of ways to describe policies and their specific attributes. Further work on ways to assess variations in the ways policies are implemented would also be valuable.
Crime Measures
Crime data are useful for understanding local environments, and a national system for collecting such data would be useful. Unfortunately, Sallis explained, the way information is coded in this area also lacks standardization. Connecting data to specific geographic points can be difficult, and the associations between crime levels and physical activity have not been clearly identified in research. Public health researchers would benefit from a systematic research agenda and from work with the Department of Justice to develop standardized accessible data.
________________
1See http://www.gis.com/content/what-gis (accessed August 30, 2011).
Collaboration with Non-health Sectors
Sallis concluded by noting that, while health researchers and agencies need more and better data to understand clearly the influence of the physical environment on obesity, improved data systems to meet this need will depend on collaboration with other groups outside of the health field. Such groups have different priorities from health research entities and are just as likely to face tight budgets. Nevertheless, much of the data on land use, transportation, education, crime, and commerce already being collected could be useful for health research, and could be more useful if coordinated and expanded in even modest ways. Such data would be extremely helpful to local and state health departments, but the existing state of affairs is difficult for them to sort out. “Health agencies will need to invest in these systems,” said Sallis. “Who will take the lead?”
Presenter: Christine Hoehner
Surveillance is important for public health researchers in any field, and each of the measures Sallis described may be used in surveillance, explained Hoehner. Surveillance serves numerous purposes. Using surveillance, researchers can assess the magnitude of a problem and how it is distributed geographically, as well as monitor changes over time in its patterns. Surveillance can also help in defining a problem and generating hypotheses or research targets and in evaluating the effectiveness of intervention strategies, as well as support planning decisions and policy development. Most important, Hoehner observed (quoting a publication by Institute of Medicine committee member Jamie Chriqui and colleagues), is that “what gets measured, gets changed” (Chriqui et al., 2011). She explored whether current measures related to physical activity and the built environment are “accurate; reliable; feasible to collect across diverse communities; sensitive in detecting change to the environment and policies associated with physical activity; and responsive to the data needs of advocates, decision makers, and planners at the local level.”
When surveillance is effective, the result is an ongoing information loop, Hoehner explained, that works as shown in Figure 2-3. In practice, however, the surveillance loop for a given public health issue is usually incomplete because connections may not have been forged, and data may be unavailable. In these cases, decisions are made without the necessary data. The loop also illustrates that the physical environment and activity levels are influenced by many sectors of public life and levels of government and that policies involve many stages, said Hoehner.
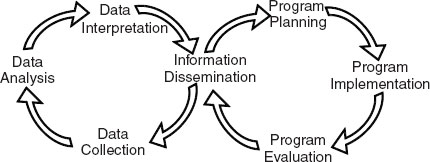
FIGURE 2-3 Public health surveillance loop.
SOURCE: Remington and Goodman, 1998. Reprinted with permission from the Sheridan Press: [American Public Health Association] Remington, P. L., and R. A. Goodman. 1998. Chronic disease surveillance. In Chronic disease epidemiology and control. 2nd ed., edited by R. C. Brownson, P. L. Remington, and J. R. Davis. Washington, DC: American Public Health Association.
National Objectives for Physical Activity Environments and Policies
Ideally, surveillance is guided by national objectives. Hoehner explained that in the case of physical activity, the National Physical Activity Plan—developed under the sponsorship of numerous organizations, including the YMCA, the American Cancer Society, and the American Heart Association, and launched in 2010—describes policies and programs designed to promote physical activity “to improve health, prevent disease and disability, and enhance quality of life.”2 The plan offers recommendations directed to eight sectors with potential influence: business and industry; education; health care; mass media; parks, recreation, fitness, and sport; public health; transportation, land use, and community design; and volunteer and nonprofit organizations. These recommendations include surveillance and reporting of data.
Another initiative, Healthy People 2020, outlines a set of specific objectives for boosting physical activity (selected objectives are shown in Box 2-1) and emphasizes the importance of nationally representative data. CDC also includes among its objectives for reducing obesity three that are specific to physical activity, along with suggested measures. All of these plans highlight the fact that the necessary data are not consistently available, particularly at the local level, Hoehner pointed out.
________________
BOX 2-1
Physical Activity Environment/Policy Objectives for Healthy People 2020
1. Increase the proportion of the nation’s public and private schools that require daily physical education for all students.
2. Increase regularly scheduled elementary school recess in the United States.
3. Increase the proportion of school districts that require or recommend elementary school recess for an appropriate period of time.
4. Increase the proportion of the nation’s public and private schools that provide access to their PA [physical activity] spaces and facilities for all persons outside of normal school hours.
5. Increase the number of states with licensing regulations for PA provided in child care.
6. (Developmental)* Increase the proportion of employed adults who have access to and participate in employer-based exercise facilities and exercise programs.
7. ( Developmental)* Increase legislative policies for the built environment that enhance access to and availability of PA opportunities.
*There is currently no national baseline data for developmental objectives, but they should have a confirmed nationally representative data source that will ultimately provide baseline data and at least one tracking point. Developmental objectives address areas of national importance for which investments should be made over the next decade to measure their change (http://healthypeople.gov/2020/about/aboutdata.aspx [accessed August 30, 2011]).
At present, surveys, GIS, and auditing and observational tools are the primary sources of data for physical activity and the built environment, as Sallis described. Hoehner provided additional detail on how these three approaches are used to measure physical activity.
Surveys
Surveys generally are conducted by mail or telephone and provide specific information about the characteristics of an environment, depending on the number of questions asked (which may vary significantly). Two instruments used for surveillance of the built environment are the Environmental Supports for Physical Activity survey (SIP 4-99 Research Group, 2002) and the Physical Activity Neighborhood Environment Scale (PANES) (Sallis et al., 2010). While these instruments provide valuable data at low
cost and cover many regions where observational data are unavailable, it is important to note, Hoehner explained, that agreement between the perceptions captured by surveys and objective measures is relatively low. Differences may be accounted for by differing definitions of a neighborhood’s boundaries or other relevant factors, variation in people’s expectations and perceptions, or measurement error. Hoehner stressed that, although the difference should not be overlooked, the perceived environment can be measured reliably and is associated with physical activity. She noted that it would be useful to collect more of this type of data because the tools needed to do so are available at the national level.
Geographic Information Systems
GIS data provide the only feasible objective measures of the built environment across large areas, Hoehner explained. Although much of this type of data currently is collected by non-health sectors, she continued, it provides information about parks, indoor recreation facilities, land use, streets and public transit, vegetation, traffic accidents, and neighborhood deprivation. The sources and scope of these data are shown in Table 2-2.
Although valuable, GIS-based data can be costly to collect, and they currently vary considerably in terms of regions covered, geographic scale, and type of data. Locally collected data may not be readily available to researchers, for example. Quality may vary as well, and in some cases the origin of the data is unknown. There is relatively little standardization in what is included in the data, and in many cases, details about features particularly relevant to physical activity are lacking. For example, Hoehner described her experience with data on parks in the Dallas-Fort Worth area that were difficult to use for research. From an initial count of 2,800 parks, she and her colleagues eventually arrived at a count of approximately 2,000 because records from multiple sources may have included features that were not actually parks, such as medians, cemeteries, or mobile home parks. At the same time, some parks evident in aerial photographs or other sources had to be added.
Commercial databases are another source of information about the locations of food and physical activity establishments that can be integrated with GIS, Hoehner noted, and two studies have examined their validity. Boone and colleagues (2008) compared commercial data with data from a field census and found moderate agreement: 39 percent for nonurban areas and 46 percent for urban areas. The agreement varied by facility type. Hoehner and Schootman (2010) conducted a similar comparison—of measures by InfoUSA and Dun & Bradstreet (two major commercial data sources) versus independent measures of census tracts in the St. Louis area. They found “mostly fair” agreement among databases: 32 percent. These
TABLE 2-2 GIS-Based Data Collected by Non-health Sectors
| Type | Source | Scale |
| Parks and open space | Park and recreation departments National/state parks | Local National/state |
| Indoor recreation facilities | Commercial databases (InfoUSA, Dun & Bradstreet) | National |
| Land use | Parcel databases | Local |
| Density Streets | U.S. Census/American Community Survey Census TIGER ESRI Streetmap Transportation or planning agency | National National National Local |
| Sidewalks and bicycle facilities | Transportation or planning agency | Local |
| Vegetation | U.S. Geological Survey’s Landsat* USDA National Agriculture Imagery Program | National National |
| Crime | FBI Uniform Crime Reports (city/county) Local police departments | National Local |
| Traffic accidents | Motor vehicle accident reports | State or local |
| Neighborhood deprivation | U.S. Census/American Community Survey observations | National |
NOTES: ESRI = Environmental Systems Research Institute; ESRI develops GIS to address social, economic, business, and environmental concerns at the local, regional, national, and global scales. FBI = Federal Bureau of Investigation. TIGER = Topologically Integrated Geographic Encoding and Referencing; Census TIGER is the name for the system and digital database developed at the U.S. Census Bureau to support its mapping needs for the decennial census and other Bureau programs. USDA = U.S. Department of Agriculture.
*Landsat is a global land-imaging project that provides space-based images of the earth’s land surface, coastal shallows, and coral reefs. SOURCE: Hoehner, 2011.
databases contain a great deal of error, Hoehner observed, so researchers should exercise caution when using them.
In short, GIS-based measures are valuable, but the lack of standardization in the underlying spatial data limits their usefulness, and there is a paucity of studies including measures of sidewalks, crime, park qualities,
and vegetation. Additionally, GIS-based measures provide limited information about many features, particularly those related to the interactions between the built and social environments, such as crime, disorder, and public access.
Audits and Observational Tools
These tools provide measures of urban design features that are not observable remotely as with GIS or aerial photographs, such as sidewalk quality, incivility, or lighting.3 They are more useful for community assessment and advocacy than for surveillance. Hoehner and her colleagues (Brownson et al., 2009) reviewed 20 tools used for audits and observations and found that they covered a range of domains. Most covered land use, streets and traffic, sidewalks, bicycling facilities, public space/amenities, building characteristics, parking, maintenance, and safety. Few, however, covered such issues as the presence of dogs, noise, or signage. These tools have high rates of interrater reliability, in the range of 0.6 to 0.8; the rates are highest for measures of physical features, such as land use and transportation environments, and lower for other attributes, such as social and physical disorder. Challenges in the use of these tools are similar to those for GIS-based data: cost, lack of scoring protocols, and difficulty of analyzing complex data.
Analysis, Interpretation, and Dissemination of Data
Given the available measures described above, Hoehner noted, a variety of questions about analyzing, interpreting, and disseminating the data must be considered. For example, if improving GIS measures in order to develop an improved national sample were identified as a goal, one would need to consider who would be responsible for collecting, analyzing, and disseminating the data (for example, CDC, state or local health departments, universities); which geographic areas should be covered; what resources would be required; what measures would be reported; and how the data would be made accessible and useful to advocacy groups and decision makers.
Several current initiatives, Hoehner observed, involve collecting standardized data across jurisdictions. Communities Putting Prevention to Work, a project of the U.S. Department of Health and Human Services, has engaged approximately 50 communities in working to reduce the rate of diseases related to obesity and tobacco consumption using environmental
________________
3Many tools for audits and observations are listed on the Active Living Research website, maintained by the Robert Wood Johnson Foundation (www.activelivingresearch.org [accessed July 2011]).
policy strategies. Communities are encouraged to use an evaluation tool—designed to identify existing community activities and develop action plans—that Hoehner said has been deemed useful for surveillance. Bridging the Gap, a program funded by the Robert Wood Johnson Foundation, is examining policy and environmental measures in a nationally representative sample of 150 to 200 communities defined by school catchment areas. Other initiatives include Healthy Kids; Healthy Communities, which uses online tracking to explore community partnerships; and the Childhood Obesity GIS System, an online tool for mapping many types of data. Finally, the National Collaborative on Childhood Obesity has developed a web-based registry of valid and reliable measures4 (discussed in greater detail in Chapter 4), which Hoehner explained is expected to help in identifying gaps in measurement.
Hoehner closed by offering some recommendations, many of which echoed Sallis’s comments. Working with those outside the health sector who do or can collect valuable data, she believes, will be critical to improving the information base. At the same time, it will be important to give priority to measures that address national objectives and strategies. Collecting data periodically will enable the assessment of trends over time. Hoehner also argued that methods and measures that can be developed most easily and quickly to support the development and modification of policies for the built environment should be an early priority. Finally, both the establishment of priorities and the lessons to be learned from existing initiatives should support sound decisions about the collection, analysis, and interpretation of these data.
Boone, J. E., P. Gordon-Larsen, J. D. Stewart, and B. M. Popkin. 2008. Validation of a GIS facilities database: Quantification and implications of error. Annals of Epidemiology 18(5):371-377.
Brownson, R. C., C. M. Hoehner, K. Day, A. Forsyth, and J. F. Sallis. 2009. Measuring the built environment for physical activity. State of the science. American Journal of Preventive Medicine 36(Suppl. 4).
Chriqui, J. F., J. C. O’Connor, and F. J. Chaloupka. 2011. What gets measured, gets changed: Evaluating law and policy for maximum impact. Journal of Law, Medicine and Ethics 39(Suppl. 1):21-26.
Ding, D., J. F. Sallis, J. Kerr, S. Lee, and D. E. Rosenberg. 2011. Neighborhood environment and physical activity among youth: A review. American Journal of Preventive Medicine 41(4):442-455.
________________
4See www.nccor.org/measures (accessed September 14, 2011).
Hoehner, C. M. 2011. The physical inactivity, inactivity, and built environments: Current and potential sources of measures for assessing progress in obesity prevention. Presented at the Workshop on Measurement Strategies for Accelerating Progress in Obesity Prevention, March 23, Irvine, CA.
Hoehner, C. M., and M. Schootman. 2010. Concordance of commercial data sources for neighborhood-effects studies. Journal of Urban Health 87(4):713-725.
Remington, P. L., and R. A. Goodman. 1998. Chronic disease surveillance. In Chronic disease epidemiology and control, 2nd ed., edited by R. C. Brownson, P. L. Remington, and J. R. Davis. Washington, DC: American Public Health Association.
Sallis, J. 2011. Measuring environmental and policy exposure: Which ones? Presented at the Workshop on Measurement Strategies for Accelerating Progress in Obesity Prevention, March 23, Irvine, CA.
Sallis, J., and J. Kerr. 2006. Physical activity and the built environment. President’s Council on Physical Fitness and Sports Research Digest 7(4).
Sallis, J. F., R. B. Cervero, W. Ascher, K. A. Henderson, M. K. Kraft, and J. Kerr. 2006. An ecological approach to creating active living communities. Annual Review of Public Health 27:297-322.
Sallis, J. F., J. Kerr, J. A. Carlson, G. J. Norman, B. E. Saelens, N. Durant, and B. E. Ainsworth. 2010. Evaluating a brief self-report measure of neighborhood environments for physical activity research and surveillance: Physical Activity Neighborhood Environment Scale (PANES). Journal of Physical Activity and Health 7(4):533-540.
SIP 4-99 Research Group. 2002. Environmental supports for physical activity questionnaire. Columbia, SC: University of South Carolina, Norman J. Arnold School of Public Health, Prevention Research Center. http://prevention.sph.sc.edu/tools/Env_Supports_for_PA.pdf (accessed August 17, 2011).


