
6
Assessing State and Community Efforts
Key Points Noted in Presentations
• Policies at the state, county, and community levels are designed to reduce obesity by addressing physical activity opportunities and nutrition issues. These policies are highly varied in quality, purpose, and implementation.
• The content of these policies is difficult to measure because of the variability of available data and because the policies themselves vary to such a great degree.
• Innovative approaches to mining available data and fostering collaboration across sectors and academic disciplines hold promise for providing more comprehensive information about obesity prevention-related policies.
Like federal policy makers, policy makers at the state, county, and municipal levels all have an interest in the health of their citizens and can play a significant role in efforts to reduce obesity. However, assessing the effectiveness of policy interventions related to healthy eating, active living, and obesity prevention can be difficult, Eduardo Sanchez, vice president and chief medical officer, Blue Cross and Blue Shield of Texas, noted in introducing a session on the role of states and communities. He observed that it is frustrating to see effected policy change not have the accompanying action necessary for the policy to make a difference, and that health
impact assessments are important tools for guiding the development and implementation of policies and programs. Panelists discussed existing measures for monitoring the reach and impact of the strategies used by state, local, and municipal policy makers and the sorts of data that can be used to track the progress of policy initiatives.
Maya Rockeymoore, president and CEO of Global Policy Solutions and program director of Leadership for Healthy Communities (LHC), discussed efforts of the LHC program to reach policy makers about ways to promote healthy eating and physical activity, with a particular emphasis on reducing childhood obesity. Laura Kettel Khan, senior scientist for policy and partnerships, Division of Nutrition, Physical Activity, and Obesity, Centers for Disease Control and Prevention (CDC), spoke about community strategies and measures in obesity prevention. Amy A. Eyler, associate research professor, George Warren Brown School of Social Work and Prevention Research Center, Washington University in St. Louis, described efforts of the Physical Activity Policy Research Network (PAPRN) to foster research collaboration. Jamie Chriqui, senior research scientist, Health Policy Center, Institute for Health Research and Policy, and research associate professor in political science, University of Illinois at Chicago, described approaches to surveillance of public policies. Finally, Brian Cole, program manager and lead analyst, Health Impact Assessment Group, University of California, Los Angeles (UCLA) School of Public Health, addressed assessment of health impacts.
Presenter: Maya Rockeymoore
Obesity prevention involves “thinking about everything from the types of commercials we watch to the types of foods we have available in our communities to how communities are built, how buildings are constructed, and even how streets and sidewalks are laid out,” explained Rockeymoore. Most of these aspects of life are usually taken for granted, she added, so efforts to reduce obesity entail “systematically calling into question fundamental assumptions about our daily lives.” Doing so requires a broad policy perspective. It is policy makers who are responsible for the laws, regulations, and other factors that affect these aspects of society, she explained, and the LHC program works with national associations of policy makers to help educate their memberships about ways to promote healthy eating and physical activity; as noted, the emphasis of the program is on reducing
childhood obesity.1 Rockeymoore described the organization and a recent evaluation of some of its results.
The program has two goals, Rockeymoore explained: to help build policy makers’ commitment to pursuing policies that encourage healthy eating and active lifestyles, and to assist them in adopting, implementing, and strengthening such policies. LHC gives grants to organizations that serve those who govern tribes, states, local jurisdictions, and schools, in both the executive and legislative branches of government. The National Conference of State Legislators, the National Congress of American Indians, and the Association of State and Territorial Health Officials are just a few of the approximately 15 associations with which the program has worked. The grants support a range of activities all designed to promote, sponsor, and support public policies and programs that encourage healthy diets and physical activity. Examples of the ways the program works through these leadership associations to influence policy makers include educating members about promising policies and new research findings; elevating childhood obesity as a priority focus; and promoting, supporting, and sponsoring public policies that support obesity prevention.
LHC funds programs with a wide range of purposes and designs, Rockeymoore explained. Some programs work with policy makers in different roles at the state level, for example, to encourage them to collaborate on specific issues. Others provide technical assistance at the city or school level. One program that works at the national level (the National Association of Latino Elected and Appointed Officials) engages policy makers from every level of government. That group provides training in the nature of the childhood obesity problem and policy options for addressing it, as well as technical assistance to policy makers as they implement changes in their own communities.
LHC itself provides technical assistance and various forms of communication and outreach on reducing obesity. It also evaluates the results of the outcomes of programs it funds, impacts on policy makers, and the effectiveness of its own efforts. Evaluating the results of policy advocacy is difficult and is an evolving science, Rockeymoore observed. “Outcomes are often nebulous, attribution is difficult… and external influences are numerous and dynamic,” she added. For example, the Let’s Move Cities and Towns initiative launched by First Lady Michelle Obama2 is likely to have had an impact in many of the same areas that LHC is targeting, and identifying the respective influence of each is difficult.
________________
1For details about the organization, see http://www.leadershipforhealthycommunities.org/ (accessed August 2011).
2For more information about the initiative, see http://www.letsmove.gov/ (accessed September 2011).
LHC, which was formed in 2002, completed an evaluation of the first cohort of organizations to which it awarded grants (Leadership for Healthy Communities, 2011). The evaluation was designed to collect information about the extent to which these 11 organizations increased their capacity to address childhood obesity, the nature and results of the outreach in which these 11 organizations engaged, the extent to which they effected increase in the political will of their members to act on obesity reduction goals, and the effectiveness of the processes they used. LHC used a range of evaluation tools. It asked both staff at the grantee institutions and policy makers targeted by the funded projects to complete surveys and conducted interviews with the policy makers. It required grantees to distribute evaluation forms at events and tallied those results. It also reviewed resolutions passed by grantee institutions and external data on state policy trends.
Rockeymoore presented the evaluation’s findings. One is that through its grantees, LHC has reached a group of lawmakers who are primarily nonpartisan (although those with a declared affiliation are more likely to be Democrats), and 70 percent are white. Of the 11 grantees, 7 reported new commitments by their governing bodies related to reducing childhood obesity. Many increased staffing for obesity-related efforts and held workshops or conferences on the topic. All of the organizations also endorsed a strategy toolkit prepared by LHC, and many distributed LHC-sponsored publications. Several obtained additional funding from other sources to expand their efforts.
Rockeymoore reported a 19 percent increase in the number of “policy makers who agree or strongly agree that it is a policy maker’s role to take action to help solve the childhood obesity crisis”—an increase from 79 percent in 2006 to 94 percent in 2009. She also noted that high proportions of the surveyed policy makers reported that the LHC-sponsored programs had raised their awareness and influenced them to take a range of actions. For example, the city of Charleston, South Carolina, created a master plan for children’s health that incorporates obesity-reduction goals; the Colorado State Board of Education enacted new school beverage regulations that included a ban on the sale of sodas; and San Fernando, California, developed a new park—all changes initiated or supported by organizations that had received LHC grants.
COMMUNITY STRATEGIES AND MEASURES
Presenter: Laura Kettel Khan
Like the LHC program, CDC supports local governments and communities in obesity prevention. As Kettel Khan explained, CDC recommends both strategies and corresponding measures with which local governments
can plan and monitor their progress. These recommendations were developed in collaboration with an expert advisory group and the International City/County Management Association, a professional organization for urban planners and city managers, so that communities could use common measures that are relatively easy to put in place as they engage in long-term planning and funding decisions.
The approach to designing the recommendations grew out of recognition that there is scant knowledge of what works best for community efforts toward population-based obesity prevention, Kettel Khan explained. The process is grounded in existing evidence and expert opinion—as opposed to consensus—and is in some ways “aspirational, or even exploratory,” she added. The developers hoped that by ensuring an open process, in which all stakeholders would be involved in both decision making and documentation of each step, they would be able to begin the process of building a base of evidence about what works.
Kettel Khan and her colleagues used a two-part methodology for the analysis on which the recommendations were based. They developed a set of rating criteria to identify the highest-priority strategies:
• Reach—the strategy is likely to affect a large percentage of the target population
• Mutability—the strategy is in the realm of the community’s control
• Transferability—the strategy can be implemented in communities that differ in size, resources, and demographics
• Sustainability—the health effects of the strategy will endure over time
• Effect size—the potential magnitude of the health effect for the strategy is meaningful
A similar process was used to nominate and select the most useful measures, based on the following criteria:
• Utility—the measure serves the information needs of communities for planning and monitoring community-level programs and strategies
• Feasibility—the measure can be collected and used by local governments (e.g., cities, counties, and towns) without the need for surveys, access to proprietary data, specialized equipment, complex analytical techniques and expertise, or unrealistic resource expenditure
• Construct validity—the measure accurately assesses the environmental strategy or policy it is intended to measure
Having little basis for the initial selection of measures, the development team pilot tested possible measures to ensure that their collection was truly feasible. For example, one strategy selected was to improve access to supermarkets. One possible measure for this strategy was the number of supermarkets per capita, and another was the percentage of households within a 2-mile radius of each supermarket in a community. Applying the above criteria pointed the team to the second measure, which they pilot tested in 20 communities. They found that this was a feasible measure and selected it.
The results of this analysis were published in 2009. An article in Morbidity and Mortality Weekly Report details the methodology in detail (Khan et al., 2009), while another document describes the implementation of the strategies and measures and provides examples for communities to use as guidance (Keener et al., 2009). Kettel Khan stressed, however, that while the recommended strategies are grounded in evidence, they are suggestions, not validated standards.
This was a novel process for CDC, Kettel Khan explained, and she summarized what was learned from it. First, she noted, “simplicity was the key.” These strategies engage local government personnel who are not deeply involved in research or prepared to conduct primary data collection. Thus, the strategies need to be grounded in secondary data sources that are easy to obtain. Second, the partnership between local government officials and public health professionals that is needed for these strategies is not well established and requires attention. Kettle Khan explained that both sides had to think in new ways about the vocabulary they use and that public health workers needed to focus on messages that appealed to the interests of local government workers. In response to a question, she noted that at present, there is a paucity of data available to support guidance to communities about how long it is likely to take before results from any of these strategies are evident, and she agreed that that this represents an added challenge for those implementing strategies at the community level.
Many states have started to implement some or all of the recommended strategies, Kettel Khan noted, while a smaller number of states have made efforts to implement some of the measures. Minnesota, for example, which has an advanced state department of health surveillance system, has committed to incorporating all of the recommended obesity measures into its system, and Wisconsin has undertaken a validation study, using its electronic medical record system, of all 24 recommended measures. Funding from a CDC Preventive Health and Health Services Block Grant and a decision by the Department of Housing and Urban Development to incorporate the measures into several initiatives are likely to further expand the reach of the recommendations. In response to a question about whether CDC planned to systematically monitor or conduct surveillance of adoption of
the recommendations in communities statewide or nationwide, Kettel Khan indicated that there was no formal plan or designated funding to do so at the time of the workshop.
A number of other programs, both within CDC and sponsored by others, target obesity in various ways, Kettle Khan noted. Another CDC program, Communities Putting Prevention to Work (CPPW), which is focused on reducing morbidity and mortality associated with obesity and tobacco use, provides a “phenomenal, once-in-a-lifetime opportunity for investment in prevention,” Kettel Khan explained.3 It has several components, including $450 million in funding to support 50 communities (urban, rural, and tribal) in efforts to:
• stabilize or decrease the prevalence of obesity,
• increase levels of physical activity,
• improve nutrition,
• decrease the prevalence of smoking and decrease teen smoking initiation, and
• decrease exposure to second-hand smoke.
Some of the funding will be in the form of direct grants to communities, and some will provide technical support for implementation and evaluation. Another component of CPPW is an investment of $125 million at the state and territory level, and the program is reaching every state and territory and numerous communities around the country, Kettel Khan explained.
Kettel Khan also mentioned the Nutrition and Obesity Policy Research and Evaluation Network, a group of researchers who conduct transdisciplinary research on policy identification, development, and implementation.4 This is one example of a research network designed to link research efforts focused on an obesity-related theme, and PAPRN is another, discussed next.5
FOSTERING RESEARCH COLLABORATION
Presenter: Amy A. Eyler
PAPRN was developed in response to a finding that population-based improvements in physical activity “will most likely come from changes at
________________
3For details about this program, see http://www.cdc.gov/communitiesputtingpreventionto work/ (accessed September 2011).
4For details, see http://www.nopren.org/ (accessed September 2011).
5More information on PAPRN can be found at http://paprn.wustl.edu/Pages/Homepage.aspx (accessed September 2011).
the macro, policy, or environmental level,” Eyler explained. PAPRN is a special-interest project funded through CDC’s Prevention Research Centers. It facilitates coordination among approximately 15 research centers around the country, some funded and some participating on a volunteer basis. With this many partners, Eyler explained, challenges were initially encountered in reaching consensus on PAPRN’s mission and the projects it would undertake. The mission ultimately developed was to identify physical activity policies and their determinants, describe the process of their implementation, and determine their outcomes. Figure 6-1, a framework that guides the network in developing its projects, illustrates the way policies operate at different levels and how they interact.
PAPRN also needed to establish what sorts of policies it would consider, and Eyler and her colleagues developed a working definition of a physical activity policy: “a legislative action, organized guidance, or rule that may affect the physical activity environment or lifestyle behavior. These policies can be in the form of formal written codes, written standards that guide choices, or common practices.” Because this definition encompasses many different approaches, studying their outcomes can be difficult, Eyler observed. As discussed in Chapter 2, physical activity policies may affect such aspects of a community as access to recreation areas or parks; bicycle rack policies at schools, libraries, or community centers; school recess options; the safety of play areas for children; workplace exercise options; and access to public transportation.
Data on such policies are collected in different formats, and the evidence base is better for some than for others, Eyler noted. For example, research has shown that physical education classes in schools will increase children’s exercise rates if they include significant amounts of moderate and vigorous physical activity for allotted times in a conducive environment. The evidence regarding the effects of building a community trail or sidewalk is still emerging, however. Comprehensive policy study requires multiple methodologies: surveys, case studies, and detailed qualitative studies set the stage for larger, more quantitative studies. In addition, evaluation must take into account the specific ways in which policies are implemented, which will also affect outcomes, Eyler added.
Eyler described several PAPRN studies and some of the lessons she and her colleagues have learned. Two PAPRN studies have examined state legislation. For a study of physical education (PE) plans (Eyler et al., 2010a), researchers used a legislative database called Netscan to identify almost 800 bills related to physical activity. For the years 2001 through 2007, they found that approximately 20 percent of the bills were enacted (a rate similar to that for other health-related bills) but that very few of those bills contained the components of PE that research has identified as important: time allotted, activity level, teacher certification, and the environment in

FIGURE 6-1 Physical Activity Policy Research Network framework.
SOURCE: Reprinted, with permission, from T. L. Schmid, M. Pratt, and L. Witmer, 2006, “A framework for physical activity policy research,” Journal of Physical Activity and Health 3(Suppl 1):S20-S29.
which the PE is offered. Moreover, little funding has been allocated for evaluation of these bills’ effects. Although PAPRN found that more work is needed on the content of legislation, as well as implementation and evaluation, Eyler noted that these results provide a good basis for future policy surveillance. The content analysis tool developed for this study has also been valuable in other PAPRN studies.
Another study of state legislation focused on provisions for public walking trails between 2000 and 2008 (Eyler et al., 2010b). Of the 991 bills the researchers found on this subject, a little more than half concerned the allocation of federal funds, so they analyzed those bills separately from purely local measures. Of the 475 bills not related to federal funds, 29 percent were enacted. Emerging evidence indicates that such factors as connectivity, accessibility, maintenance, funding, and liability influence the extent to which a new trail will boost physical activity, but the data are not as firm as those for the critical components of PE.
From these two studies, Eyler and her colleagues found, first, that states collect a significant amount of information on legislation and that it is relatively easy to scan some physical activity-related topics—such as PE—using databases such as Westlaw or Lexis-Nexis. Other topics require more tedious effort, she added, and states vary in the quality of both what they report and the legislation they put forward, as well as in the language they use to refer to physical activity-related elements. This variation can make it difficult to interpret and compare bills without the assistance of
policy experts or lawyers. Looking at bills that were not enacted can also be instructive, Eyler added, and it is critical to look as well at the implementation of those that were.
PAPRN researchers also analyzed state obesity plans and programs, comparing the planning that was done, the frameworks, and the goals and objectives related to physical activity. Forty-three states have some sort of plan, although they vary in form and focus. Few have an in-depth orientation toward physical activity, Eyler noted, and none address all the components of the National Physical Activity Plan.6 State plans are more likely to focus on traditional approaches, such as PE, she added, than on such emerging issues as land use and community design, transportation, and parks and recreation. Like the legislation research, Eyler explained, this study provides a good basis for further study. PAPRN is developing a template states can use to develop more comprehensive plans that is based on this research, as well as a similar tool based on a study (Steinman et al., 2010) of regional master plans for bicycle use and pedestrian traffic.
Another PAPRN study (Eyler and Swaller, in press) examined policies on community use of public school facilities (also known as “joint use”) in Missouri school districts. The researchers found that 71 percent of the districts had a plan for community use in place, but that the majority had copied the policies of either the School Board Association or Missouri Consultants for Education. They concluded that influencing policies at the school board level or the consultant level is likely to have a wide influence on district policy.
Eyler highlighted several conclusions from the work PAPRN has done. First, she noted that experience with other issues that have been the focus of public health efforts for some time, such as tobacco and food policy, is likely to be useful in work on physical activity. Consistent methodology—for example, for tracking, evaluation, and measures—makes it easier to compare and assess existing efforts. Also important is to pay attention to the level at which policies are initiated and the settings in which they are to be implemented. The ways in which policies at different levels may interact are important influences on outcomes, Eyler added. Above all, policy makers and funders want to know whether policies work and if so, how.
SURVEILLANCE OF PUBLIC POLICIES
Presenter: Jamie Chriqui
Understanding the precise nature of existing laws and policies is critical to assessing implementation and impact, observed Chriqui. She described
________________
6See http://www.physicalactivityplan.org/ (accessed September 2011) for more information.
several approaches to conducting surveillance of public policies, and offered a definition of public health policy surveillance similar to that of the more familiar surveillance of public health issues: “the ongoing, systematic collection, analysis, interpretation, and dissemination of information about a given body of public health law and policy” (Chriqui et al., 2011).
Chriqui distinguished policy surveillance from policy tracking, noting that surveillance is a way of examining change over time. Quantitative measures that can be linked with epidemiologic and other outcome data are used in surveillance, whereas policy tracking systems tend to use text to describe the elements of bills or simply record the existence of bills that address a particular issue. Surveillance data are tied to specific points in time so that the elapsed time between enactment and impact can be assessed, whereas tracking systems tend to report on new bills introduced within a time window. Policy surveillance, Chriqui added, is designed primarily for evaluation, whereas policy tracking is designed for reporting and advocacy.
Box 6-1 lists examples of both tracking and surveillance systems. Chriqui highlighted in particular the CLASS (Classification of Laws Associated with School Students) and Bridging the Gap programs as providing a wealth of information on state laws associated with school-based nutrition and physical education issues and with state nutrition and obesity laws, respectively. State governments and boards of education use these data as they plan changes to their laws and policies. Data from these projects have supported such initiatives as the federal Healthy, Hunger-Free Kids Act, the U.S. Department of Agriculture’s efforts to develop nationwide standards for competitive foods in schools, and the White House report on childhood obesity (White House Task Force on Childhood Obesity, 2010).
Policy measurement is “an emerging area of need,” Chriqui observed, but like any other science, it requires systematic, reliable, and valid measures. “It’s easy to do it wrong,” she noted, “and very hard to do it right.” Existing measures vary. For example, current measures of the policies affecting the built environment were not formulated for scientific purposes, but groups such as the American Planning Association have developed auditing tools to fill the gap. As an example of what can be done, said Chriqui, researchers have developed a detailed tool for coding wellness policies that provides approximately 50 pages of coding guidance. It includes individual variables for each category of nutrition education, physical activity and physical education, school meals, competitive foods sold in schools, implementation, evaluation, communications, and marketing environments in schools (Schwartz et al., 2009).
Several resources exist for state-level data, Chriqui noted, such as Westlaw, Lexis-Nexis, and State Net, but there are no comparable, comprehensive resources for community-level policies. In many cases researchers must collect information directly from municipalities and counties or school
BOX 6-1
Examples of Public Policy Tracking and Surveillance Systems
Obesity-Related Tracking Systems
• Centers for Disease Control and Prevention’s (CDC’s) Division of Nutrition and Physical Activity Legislative Database (http://apps.nccd.cdc.gov/DNPALeg/index.asp)
• National Association of State Boards of Education (NASBE) School Healthy Policies Database (http://nasbe.org/healthy_schools/hs/index.php)
• National Conference of State Legislatures Bill Summaries Database (http://www.ncsl.org)
• Yale Rudd Center for Food Policy & Obesity Legislative Updates (http://www.yaleruddcenter.org/legislation/)
Obesity-Related Surveillance Systems
• National Cancer Institute’s Classification of Laws Associated with School Students (CLASS) System (school-based nutrition and physical education policies currently) (http://class.cancer.gov/About.aspx)
• Bridging the Gap/ImpacTeen State Obesity-related Policy Data (http://www.bridgingthegapresearch.org/research/sodasnack_taxes)
• Bridging the Gap Wellness Policy Coding System (http://www.bridgingthegapresearch.org/research/district_wellness_policies)
Surveillance Systems Not Related to Obesity
• CDC’s State Tobacco Activities Tracking and Evaluation System (http://apps.nccd.cdc.gov/statesystem/Default/Default.aspx)
• National Institute on Alcohol Abuse and Alcoholism (NIAAA) Alcohol Policy Information System (APIS) (http://alcoholpolicy.niaaa.nih.gov/)
SOURCE: Chriqui, 2011.
districts if they are interested in district-level policies. Chriqui suggested that data collected directly tend to be more accurate than survey data when the goal is to understand what policies are “on the books” compared with what policies are being implemented in practice (surveys of local officials being well suited to the latter).
Collecting such data is time and resource intensive, Chriqui pointed out, explaining that this is an emerging field in which relatively few researchers are engaged. Most currently available obesity-related policy measures focus on school settings, she added; fewer address broader aspects of the community, the built environment, and the food environment. Therefore, much work remains to be done. Nationwide measures of such polices would be valuable, Chriqui added, so that researchers and policy makers could look
more systematically at the policies that are being implemented in order to understand why or why not they are having the intended effect. As others had mentioned earlier in the workshop, few existing measures correspond specifically to research-based recommendations for reducing obesity. Thus in Chriqui’s view, “we need the capacity to develop systems to do longitudinal, ongoing policy surveillance on issues related to the physical and food environments.”
Several participants probed the challenges of understanding what states and communities are doing, given their significant variability, and wondered how that variability might be reduced. “The next stage of policy change may be to work closely with policy makers to help them understand the elements that make policies stronger, such as accountability structures and funding mechanisms,” one observed. In response to a question, Chriqui explained that while 43 states have obesity plans, most adopted them because doing so is a requirement for receiving CDC funding, and few states have focused on implementation and evaluation. Comparing policies is difficult, Eyler added, because there is no common unit. Looking just at, say, bicycle-pedestrian master plans, “a city as big as Chicago or a group of three communities in Missouri [might have plans, so] we’re comparing apples to oranges,” she noted.
Presenter: Brian Cole
Cole discussed two tools for influencing decision making related to obesity reduction efforts: health impact assessment (HIA) and health forecasting. HIA is a way of systematically evaluating, synthesizing, and communicating information, but it typically focuses outside the sectors with which public health and health care experts are usually concerned, he added. It is based on the idea that many opportunities for significant improvements in public health may lie outside the typical public health purview, such as, in the case of obesity reduction, farm subsidies or transportation policy. Some of the connections to obesity are straightforward, Cole noted, but others are less so. For example, an HIA of oil and gas production on the north slope of Alaska identified significant impacts on subsistence hunting and probable increases in rates of diabetes among neighboring populations. A similar analysis of proposed drilling in an oil field located in a high-density park area in Los Angeles showed that it would significantly reduce opportunities for physical activity in that area.
HIA is designed to identify the potential health effect of a proposed policy or project, Cole explained, including intended and unintended benefits and harms. In this way it differs from environmental impact assessments,
which focus only on the prevention of harm. HIA uses a mix of qualitative and quantitative methods within a standardized framework, with the goal of producing information that stakeholders and policy makers can readily use in decision making. For that reason, Cole added, it is important for experts from different sectors and community stakeholders to help guide the assessment.
Health forecasting, which can be a tool in an HIA or be used on its own, is way of applying different scenarios—such as environmental exposures, demographic shifts, or policy changes—to a synthetic population to explore possible outcomes. In conducting such analyses, researchers apply existing research evidence—such as data on associations between particular exposures and effects or trends in the prevalence and distribution of health conditions and risk factors—as well as established rules regarding the interactions among risk factors, to develop alternative models of what might happen over time. “The time component is really important,” Cole added, because HIAs generally do not look at incremental changes that manifest themselves gradually. Health forecasting models have been used to address such issues as the health and economic costs of overweight in California (Fielding et al., 2007), associations between physical activity and coronary heart disease (van Meijgaard et al., 2009), and the lifetime medical cost burden of overweight and obesity (Finkelstein et al., 2008) (for other examples, see Edwards and Clarke, 2009, and Roux et al., 2008).
Both HIA and health forecasting, Cole explained, bring a structured analytic approach to bridging the gap between research and policy. For example, based on the findings from an HIA of the Atlanta Beltline Project (a program to improve a land corridor surrounding Atlanta), the Environmental Protection Agency awarded a $1 million grant to help clean up abandoned industrial sites in the study area. Another HIA in Atlanta, of the Buford Highway corridor, spurred DeKalb County to invest in improving pedestrian infrastructure to enhance safety and boost physical activity. An HIA of California’s Proposition 49 revealed that it could potentially exacerbate existing disparities in access to after-school programs. After release of the HIA and briefings with state lawmakers, rules implementing the law were modified to help ensure that after-school funds would go to schools and students most in need.
Since 2000, the year the first HIA was completed in the United States, approximately 130 such analyses have been conducted, Cole noted. His review of the 75 for which comprehensive information was available revealed that many (32) examined local projects such as urban redevelopment transit efforts; 22 concerned land use; and 16 focused on social policies such as labor laws, living wage policies, paid leave, and school policies. Only a few such analyses to date have examined resource policies, but Cole regards those as important because they offer the potential to establish links
with environmental impact assessments. These studies have explored factors, or potential disease pathways, such as
• exposure to air pollutants;
• housing adequacy and affordability;
• traffic injuries;
• parks and green space;
• income adequacy and social equity;
• noise;
• mental health;
• social capital and community cohesion;
• access to jobs, stores, schools, and recreation;
• walkability and physical activity; and diet, nutrition, food safety, and food insecurity.
Many sorts of data are used in HIAs, Cole explained. Figure 6-2 illustrates the data needed for an HIA of a redevelopment project designed to improve walkability. Baseline data on the original conditions and prevalence of walking in the targeted areas are needed. Analysts also need details on the effects the project was expected to have. Thus, the researchers examine audits, survey data, the research literature, and other materials. Cole noted, however, that in many cases, improved data are needed to support an HIA of physical activity. Specifically, he cited the importance of:
• assessing total minutes of physical activity (on a daily or weekly basis), as opposed to bouts or days;
• using higher sampling rates to provide robust estimates of physical activity for small areas and populations (i.e., at the level of counties or smaller);
• including all types of physical activity, not just activities labeled “exercise”;
• using longitudinal data to track physical activity over the life span;
• evaluating community interventions that track cohorts before and after interventions;
• paying greater attention to cross-validation of self-reported physical activity and accelerometry7 data in diverse populations; and
• using off-the-shelf tools8 to estimate physical activity in small areas—for example, to infer physical activity for small areas or
________________
7An objective measure of physical activity.
8For example, akin to those developed for the EpiQMS (Epidemiologic Query and Mapping System) developed by the Pennsylvania Department of Health; see http://app2.health.state.pa.us/epiqms/Asp/ChooseDataset.asp (accessed October 14, 2011).
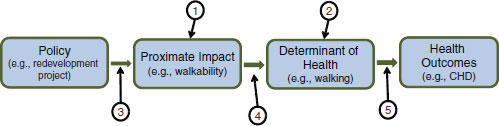
1. Baseline walkability (walkability audit, planning data)
2. Baseline walking in the affected population (survey data)
3. Information on the expected direct impact of policy or project on walkability (specifications of policy/project)
4. Dose-response effect of walkability on walking (review of research)
5. Research on the dose-response effect of walking on CHD risk
FIGURE 6-2 Data needed for a health impact assessment of a redevelopment project designed to improve walkability.
SOURCE: Cole, 2011.
populations from larger samples for which demographic and environmental determinants are known.
Cole closed with a few thoughts on how HIA and health forecasting could be used even more effectively. Sharing of data resources—particularly those not typically used in peer-reviewed studies, such as analyses conducted by county health departments—is important. Cross-sector and interdisciplinary meetings and other connections can facilitate data sharing and build awareness of what is available from other sectors. Important as well is to include more environmental factors associated with physical activity in data collection, and greater communication and collaboration can help with that. A national, web-based clearinghouse called HIA-CLIC (Health Impact Assessment Clearinghouse Learning and Information Center)9 provides information, tutorials, and other resources related to HIAs, Cole noted, including an archive of HIAs that have been conducted in the United States.
Workshop participants discussed ways to increase the use and reach of HIAs. One noted that during the Clinton administration, “there was a mandate for environmental justice to be considered in environmental impact statements,” and wondered whether a similar mandate could work in the case of obesity. Environmental impact statements are required only when there is an expected change in the environment as a direct result of
________________
9See http://www.hiaguide.org/ (accessed September 2011).
a proposed project, another participant noted. Another promising avenue might be funding mechanisms, a participant suggested. If an HIA requirement were integrated into the funding arrangements for new developments, it might help to “integrate [HIA] into the way we conceptualize building our communities—and be a mechanism for considering the health impact of everything from walkability to the quality of the air we breathe.” This participant suggested that environmental impact statements have had the greatest benefit by affecting planning from the outset—once people are aware that minimizing environmental impacts is easiest if it is a design consideration from the beginning.
Chriqui, J. 2011. Nutrition and physical activity policy surveillance and measurement: What do we know, what do we need to know, and what challenges should we consider? Presented at the Institute of Medicine Workshop on Measurement Strategies for Accelerating Progress in Obesity Prevention, March 24, Irvine, CA.
Chriqui, J. F., J. C. O’Connor, and F. J. Chaloupka. 2011. What gets measured, gets changed: Evaluating law and policy for maximum impact. Journal of Law, Medicine and Ethics 39(Suppl. 1):21-26.
Cole, B. L. 2011. Accelerating progress in obesity prevention with health impact assessment and health forecasting. Presented at the Institute of Medicine Workshop on Measurement Strategies for Accelerating Progress in Obesity Prevention, March 24, Irvine, CA.
Edwards, K. L., and G. P. Clarke. 2009. The design and validation of a spatial microsimulation model of obesogenic environments for children in Leeds, UK: SimObesity. Social Science and Medicine 69(7):1127-1134.
Eyler, A. A., and E. Swaller. in press. Community use policies in Missouri. Journal of School Health.
Eyler, A. A., R. C. Brownson, S. A. Aytur, A. L. Cradock, M. Doescher, K. R. Evenson, J. Kerr, J. Maddock, D. L. Pluto, L. Steinman, N. O’Hara Tompkins, P. Troped, and T. L. Schmid. 2010a. Examination of trends and evidence-based elements in state physical education legislation: A content analysis. Journal of School Health 80(7):326-332.
Eyler, A., T. Lankford, J. Kruger, J. Chriqui, K. Evenson, N. Ohara-Tompkins, C. Voorhees, S. Zeiff, and R. Brownson. 2010b. An analysis of state legislation on community trails. Journal of Physical Activity and Health 7(Suppl. 1):S40-S47.
Fielding, J. E., G. F. Kominski, D. E. Hayes-Bautista, and J. van Meijgaard. 2007. Trends and forecast of health and economic costs of overweight and obesity in California. July issue brief. Los Angeles, CA: UCLA Health Forecasting Project.
Finkelstein, E. A., J. G. Trogdon, D. S. Brown, B. T. Allaire, P. S. Dellea, and S. J. Kamal-Bahl. 2008. The lifetime medical cost burden of overweight and obesity: Implications for obesity prevention Obesity 16(8):1843-1848.
Keener, D., K. Goodman, A. Lowry, S. Zaro, and L. Kettel Khan. 2009. Recommended community strategies and measurements to prevent obesity in the United States: Implementation and measurement guide. Atlanta, GA: U.S. Department of Health and Human Services, Centers for Disease Control and Prevention.
Khan, L. K., K. Sobush, D. Keener, K. Goodman, A. Lowry, J. Kakietek, and S. Zaro. 2009. Recommended community strategies and measurements to prevent obesity in the United States. Morbidity and Mortality Weekly Report 58(RR-7):1-26.
Leadership for Healthy Communities. 2011. Leadership for Healthy Communities program evaluation report: 2007-2010. Washington, DC: Leadership for Healthy Communities.
Roux, L., M. Pratt, T. O. Tengs, M. M. Yore, T. L. Yanagawa, J. Van Den Bos, C. Rutt, R. C. Brownson, K. E. Powell, G. Heath, H. W. Kohl III, S. Teutsch, J. Cawley, I. M. Lee, L. West, and D. M. Buchner. 2008. Cost effectiveness of community-based physical activity interventions. American Journal of Preventive Medicine 35(6):578-588.
Schmid, T. L., M. Pratt, and L. Witmer. 2006. A framework for physical activity policy research. Journal of Physical Activity and Health 3(Suppl. 1):S20-S29.
Schwartz, M. B., A. E. Lund, H. M. Grow, E. McDonnell, C. Probart, A. Samuelson, and L. Lytle. 2009. A comprehensive coding system to measure the quality of school wellness policies. Journal of the American Dietetic Association 109(7):1256-1262.
Steinman, L., M. Doescher, D. Levinger, C. Perry, L. Carter, A. Eyler, S. Aytur, A. L. Cradock, K. Evenson, K. Heinrich, J. Kerr, J. Litt, Y. Severcan, and C. Voorhees. 2010. Master plans for pedestrian and bicycle transportation: Community characteristics. Journal of Physical Activity and Health 7(Suppl. 1):S60-S66.
van Meijgaard, J., J. Fielding, R. Shimkhada, and S. Teutsch. 2009. How do improvements in physical activity compare to better clinical coronary heart disease management? August policy issue brief. Los Angeles, CA: UCLA Health Forecasting Project.
White House Task Force on Childhood Obesity. 2010. Solving the problem of childhood obesity within a generation: White House Task Force on Childhood Obesity report to the President. Washington, DC: Executive Office of the President of the United States.


