
Analyzing Food Safety Alerts in European Union Rapid Alerts Systems for Food and Feed
Ying Zhang, Elizabeth Wells, and Jake Chen
This paper presents an overview of the types of problems different countries have in meeting import requirements of one of the biggest global importers: the European Union (EU). This paper uses publicly available data to identify patterns in the types of problems different countries have in meeting import requirements; to understand where in the supply chains the product safety failures occur; to explain the types of threats border inspectors commonly identify; and to evaluate the types of data that are most needed for tracing safety trends.
Many countries collect and make public data on their food regulatory authority’s border rejections, but there is no single international federated database combining these records. This study uses tracking data from the European Union Rapid Alert Systems for Food and Feed.
DATA AND METHODS
Data Sources
This paper uses official food safety information from the European Union Rapid Alert Systems for Food and Feed (EURASFF). EURASEF is an information sharing framework managed by the European Free Trade Association in coordination with the European Food Safety Authority (EFSA) and the European Commission. Foods and animal feeds that pose risk to human health requiring official action, “such as withholding, recalling, seizure or rejection of the products concerned” (Europa, 2011), are reported to EURASFF under article 50 of Regulation (EC) No.
178/2002.1Table G-1 presents the inclusion criteria for records included in this paper’s analysis.
The EURSAFF database presents the number of recalls and safety notifications recorded at their ports. This paper attempts to put these raw numbers in a context that accounts for the amount of trade the exporting country does with the EU. Therefore, we have retrieved trade data from Eurostat external trade statistics for food (European Commission, 2011), which classifies traded products using the WTO’s Harmonized System Codes. Table G-2 presents the criteria used to draw data from Eurostat, and lists the Harmonized System Codes we included.
Coding Metrics
Each safety alert in the database contains a short description of the product, origin countries, transit countries and the reason for the notification. This study used a coding system to categorize the type of threat reported and the place on the supply chain where it might have occurred. Briefly, the risk code refers to the reason that the product was rejected. This suspected risk can be microbial, chemical, physical, mycotoxins, or problems in processing or labeling. There is also another category that was used for rejections that resisted classification, or unclear records. Table G-3 describes the risk codes, labeled A-Y.
The supply chain categorizes the point at which the product became unsuitable for human consumption. This may have occurred at any point between the farm and the port. In most cases it is not explicit where on the supply chain contamination occurred, these entries are coded as 0. Table G-4 shows how the coder combined risk codes and supply chain codes.
Limitations
The quality of the publicly available data is one major limitation of this study. Also, the reasons for the safety alert and recall are recorded in free text; there is no standard language used for reporting in these databases. Some notes are ambiguous or confusing. For example, “unauthorized usage” of certain ingredients in food production can be interpreted as an administrative issue when a novel food ingredient was introduced without approval. It might also be a violation of using prohibited chemicals as food additives or dyes. The coding matrix also has limitations. Some cases can
![]()
1 Laying down the general principles and requirements of food law, establishing the European Food Safety Authority and laying down procedures in matters of food safety. Regulation (EC) No. 178/2002, art. 50. The European Parliament and the Council of Europe (28 January 2002).
TABLE G-1
Inclusion and Exclusion Criteria for Data Collection
| EURASFF |
| Inclusion criteria |
| 1. Notified between January 2006 and June 2011 |
| 2. Search type is limited to food only |
| 3. Reported by any EU member country |
| Exclusion Criteria |
| Food produced in EU member countries |
TABLE G-2
Inclusion Criteria Trade Statistics
| Inclusion criteria |
| 1. Reporter countries are limited to EU 27 members |
| 2. Trade partners are limited to 60 countries from which more than 10 food safety alerts were generated between 2006 and 2010 |
| 3. Product types are limited to HTS code 1-23 |
be given more than one code. For instance, “bad preservation state” or “bad hygienic state” can be interpreted as a processing problem (code F) when the food product is not stored or transported properly; it could also be coded as a physical defect (code E).
This analysis was also held back by the lack of a comprehensive up-to-date master list for chemicals prohibited in food and food packaging, especially food dyes and additives. It is not always clear if a consignment was problematic because the chemicals detected were illegal (code C) or in violation of threshold levels (code D). Therefore, when analyzing the coding results, we do not over-interpret codes that might overlap.
Findings
As the world biggest food importer and exporter (European Commission, 2010), the European Union has a well-developed and rigorous food safety alert reporting and information sharing system. EURASFF 2010 records identified 2,878 risky food products in 2010, half of them coming from outside the EU.
TABLE G-3
Risk Content Code
| Risk/Content | Code | Description | Example |
| Microbial Contamination | A | Microbial pathogen identified in the product | Escherichia coli (940 CFU/100g) in clams (Tapes decussatus) from Tunisia |
| Mycotoxin Contamination | B | Mycotoxin (a toxin produced by pathogenic microbes) identified in the product | Aflatoxins (B1 < 0.1; Tot. < 0.1 / B1 < 0.1; Tot. < 0.1 / B1 = 10.0; Tot. = 10.9 μg/kg - ppb) in peanuts in shell from China |
| Chemical Contamination (Absolutely Prohibited) | C | Chemical prohibited in the reporting country or region identified in a product | Prohibited substance metronidazole (0.2 μg/kg—ppb) in honey from China |
| Chemical Contamination (Over Threshold) | D | Chemical over the maximum residue level of the reporting country or region standards identified in a product | Zinc (14.5 mg/l) in cane vinegar from Senegal |
| Physical Contamination | E | Contamination that can be identified through organoleptic inspection | Dried peas from Ukraine infested with insects (Bruchus Pisorum) |
| Processing | F | Inadequate or inappropriate processing | Bad temperature control—rupture of the cold chain—of frozen poultry meat from Brazil |
| Labeling | G | Ingredients not labeled or labeled incorrectly | Absence of labeling on linoleic acid soft capsules from China |
| Administrative Reason | H | Absent, improper, fraudulent, or expired documents according to the reporting country standards | Absence of health certificate(s) for corned beef from Brazil |
| Other | X | Risk not clearly defined | Suffocation risk as a result of the consumption of mini cup jelly from Taiwan |
| Issues Not Interested | Y | Issues that are not concerns of the United States (e.g., genetically modified food, irradiation, etc.) | Unauthorized genetically modified (presence of GM rice BT 63) rice spaghetti from China |
TABLE G-4
Coding Metrics Combining Risk Content Codes with Supply Chain Codes
| Risk/Content | Supply Chain | ||||||
| Raw Material 1 |
Manufacturing 2 |
Packaging 3 |
Transportation 4 |
Market 5 |
Others 0 |
||
| Microbes | A | A1 | A2 | A3 | A4 | A5 | AO |
| Mycotoxin | B | B1 | B2 | B3 | B4 | B5 | BO |
| Chemical (Absolutely Prohibited) |
C | C1 | C2 | C3 | C4 | C5 | CO |
| Chemical (Over Threshold) |
D | D1 | D2 | D3 | D4 | D5 | DO |
| Physical | E | El | E2 | E3 | E4 | E5 | EO |
| Processing | F | Fl | F2 | F3 | F4 | F5 | FO |
| Labeling | G | Gl | G2 | G3 | G4 | G5 | GO |
| Administrative Reason | H | HI | H2 | H3 | H4 | H5 | HO |
| Others | X | XI | X2 | X3 | X4 | X5 | XO |
| Issues Not Interested | Y | Y1 | Y2 | Y3 | Y4 | Y5 | YO |
Figure G-1 shows the 15 countries whose food exports to the EU triggered official actions. between 2006 and 2010. However, when the cumulative number of safety alerts is divided by the cumulative food import volume, only seven countries—India, Morocco, Pakistan, Turkey, Egypt, the United States, and Iran—still rank in the top 15 (Figure G-2).
Figure G-3 and G-4 attempt to illustrate the relationship between the number of safety alerts associated with a country’s exports to the European Union, the amount of trade the country does with the European Union, and the country’s wealth. In these graphs the x-axis shows the number of safety alerts, the y-axis shows food import volume in billions of euros, and the radius represents the country’s gross domestic product (GDP) in U.S. dollars according to the World Bank (World Bank, 2010), with the exception of the GDP of Taiwan, which is from the International Monetary Fund (IMF, 2010).
Figure G-3 shows that China is the subject of many safety alerts and also does a great deal of trade with the European Union. The United States is the subject of many food safety alerts, most of them because of novel food ingredients, unauthorized irradiation, and genetically modified organisms. This is a function of different food standards between the United States and Europe.
About two-thirds of food safety alerts come from nuts and seeds, fish and seafood products, and fruits and vegetables (Figure G-5).
Mycotoxin, mainly aflatoxin, contamination is responsible for the majority of safety alerts among nuts and seed products from India, Argentina, the United States, Iran, and China (Figure G-6A). For other food categories, the nature of the risk is more diverse, but certain patterns can still be observed from some countries. For instance, while fish and seafood from Vietnam and China show relatively even distribution in microbial contamination, chemical contamination, and physical contamination, those from Bangladesh and India are mostly rejected because of prohibited chemicals (Figure G-6B). In most cases the prohibited chemicals mentioned were restricted antibiotics, nitrofurans, and cadmium. Among fruits and vegetables, more than 300 records of aflatoxin contamination on dried figs accounts for nearly half of all the alerts on Turkish fruits and vegetables, this pattern does not hold for the other countries with problems exporting fruits and vegetables (Figure G-6C). India, one of the biggest exporters of herbs and spices, seems to have aflatoxin contamination as its biggest food safety issue, while most of the records for Thailand report microbial contamination, mainly salmonella (Figure G-7D).
In Figure G-7A and G-7B, a two-dimension contour plot shows the interaction between risk and supply chain codes for Morocco and Hong Kong. The color coding indicates the number of food safety alerts, which illustrates the unique patterns of food export problems in both countries.
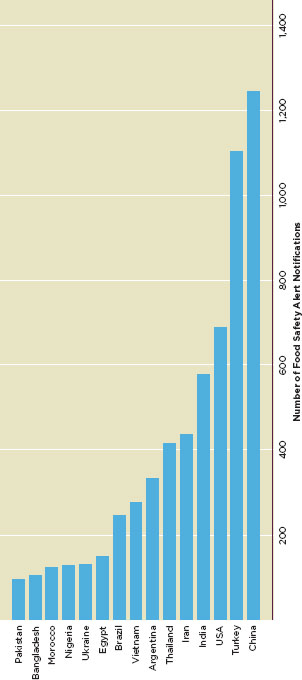
FIGURE G-1
Number of food safety alert notifications in EURASFF for top 15 origin countries, 2006-2010.
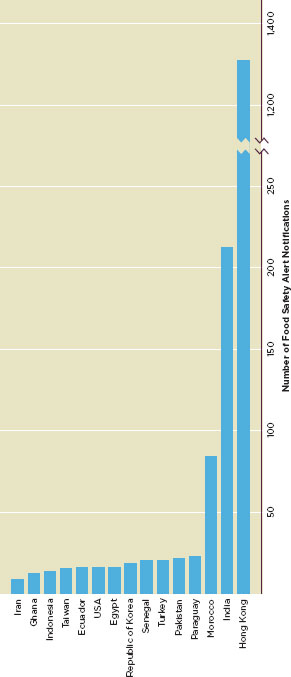
FIGURE G-2
Number of food safety alert notifications in EURASFF divided by the value of imported food for top 15 origin countries (in 1,000,000,000 Euro), 2006-2010.
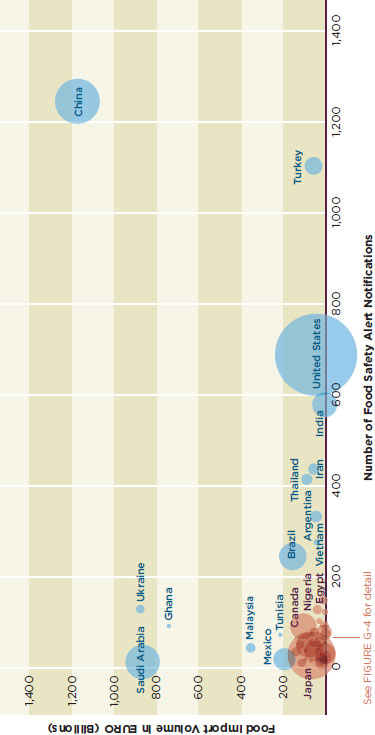
FIGURE G-3
Number of food safety alert notifications, food import volume, and GDP of EU food importers.
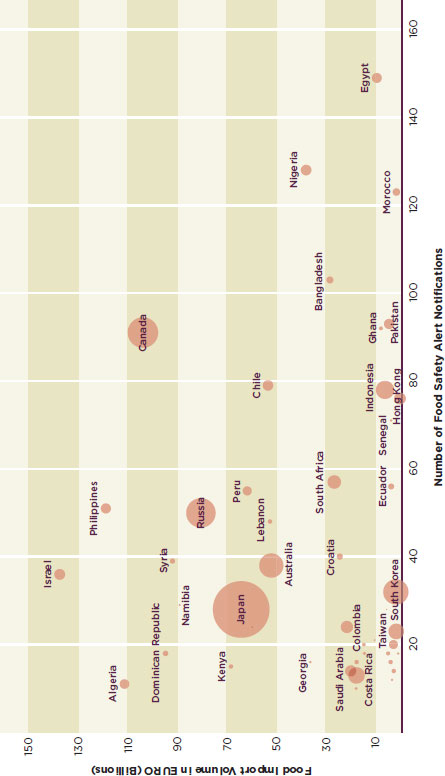
FIGURE G-4
Number of food safety alert notifications, food import volume, and GDP of EU food importers.
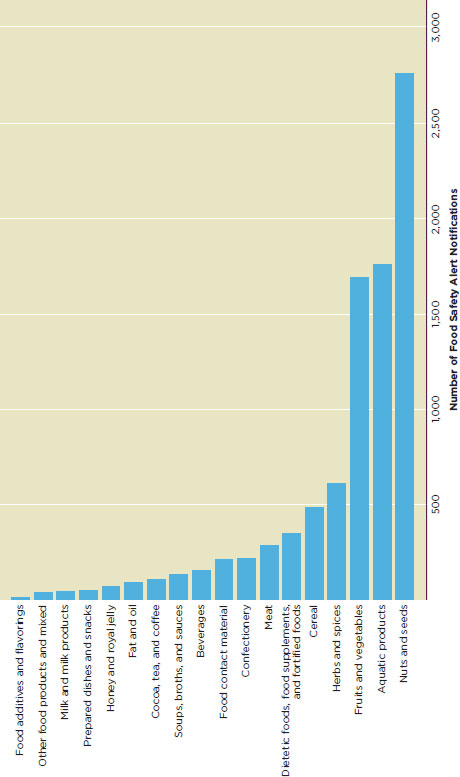
FIGURE G-5
Number of Food safety alert notifications in EURASFF by food categories, 2006-2010.
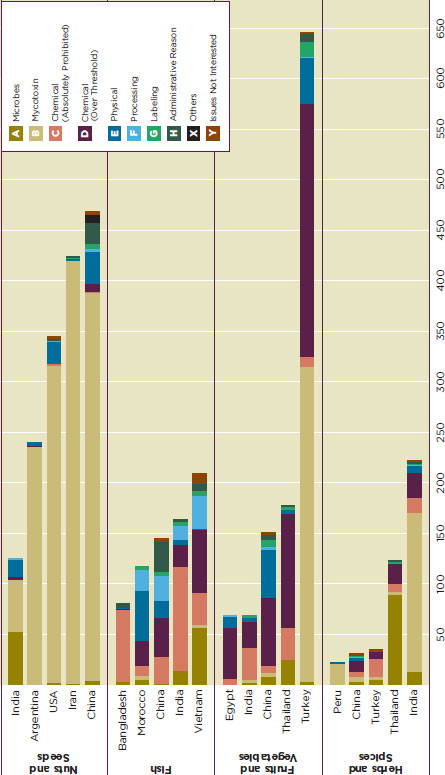
FIGURE G-6
The composition of health risks of the top four categories in EURASFF, 2006-2010.
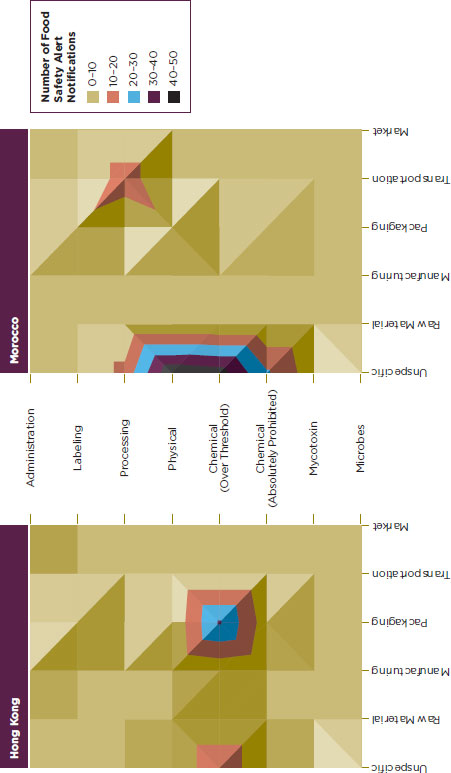
FIGURES G-7A and G-7B
EURASFF food safety alert records for all food categories coded by risk/content and supply chain stage, 2006-2010.
Data for rejections of consignments from Hong Kong shows problems with chemical contamination introduced in packing. Mostly, this was from chemicals from the packaging migrating onto the food.
Summary of the Key Findings from EURASFF Data Analysis
1. Countries named in the most food safety alert reports do not show the highest incidence after adjusting for trade volume.
2. Three categories of food products (nuts and seed products, fish and seafood products, fruits and vegetables) cause more than two-thirds of all the food safety reports.
3. Mycotoxin, mainly aflatoxin, contamination is the most commonly reported problem. It is an issue for both developed and developing countries.
DISCUSSION
The EURASFF system is operating under the provision of Regulation (EC) No. 178/2002, in which Article 50 lays down the requirement for RASFF notification, defining when a notification should be triggered, and how quickly the information should be reported to the European Union. Indeed, the RASFF has a standardized format for reporting, a real-time sharing and communication platform for all the member states, and a wide variety of data incorporating border rejections, internal communication and public safety alerts (Europa, 2009). In today’s global supply chains, foods pass through dozens of countries during production. It is not always clear what the origin country is. EURASFF documents where the raw materials come from, and where the product is in transit before entering the European Union, but the data are not consistent.
It is also important to consider the trade volume in assessing trends in product safety failures. Countries whose products trigger the most safety alerts do not necessarily have the most problems after adjusting for trade volume. Therefore different strategies might be taken to reduce rejections based on the overall amount of trade countries do. The trends identified in this paper require further analysis, however. The EURASFF database has 24 categories for food products, and these categories do not align with the WTO Harmonized Codes. It would help if regulatory agencies reported Harmonized International Commodity Codes for the products they reject.
Understanding the shared and unique patterns each country faces in exporting food may be useful in planning trainings or other capacity building projects for these countries. For instance, aflatoxin is an almost universal problem and might be best solved through global control and prevention.
More importantly, the enhanced coordination between the European Union, United States, and other developed countries could improve food safety worldwide. The European Union has just launched a system-wide re-evaluation on all approved food additives, colors and sweeteners,2 which will potentially have great impact on international trade of food products. It would be helpful for American and European regulators to cooperate on developing common standards for food additives.
REFERENCES
Europa. 2009. Scope of the RASFF. http://ec.europa.eu/food/food/rapidalert/rasff_scope_en.htm (accessed December 8, 2011).
———. 2011. Questions and answers on the role and achievements of the rapid alert system for food and feed. http://europa.eu/rapid/pressReleasesAction.do?reference=MEMO/11/729 (accessed December 8, 2011).
European Commission. 2010. Food safety—from the farm to the fork. http://ec.europa.eu/food/international/trade/index_en.htm (accessed December, 2011).
———. 2011. Eurostat data navigation tree: EU27 trade since 1988 by HS2-HS4 (DS_016894). http://epp.eurostat.ec.europa.eu/portal/page/portal/statistics/search_database# (accessed December 8, 2011).
IMF (International Monetary Fund). 2010. Report for selected countries and subjects: Taiwan. http://www.imf.org/external/pubs/ft/weo/2010/01/weodata/weorept.aspx?sy=2000&ey=2010&scsm=1&ssd=1&sort=country&ds=.&br=1&c=528&s=NGDP_R%2CNGDP_RPCH%2CNGDP&grp=0&a=&pr.x=64&pr.y=5 (accessed December 8, 2011).
World Bank. 2010. GDP. http://search.worldbank.org/quickview?name=%3Cem%3EGDP%3C%2Fem%3E+%28current+US%24%29&id=NY.GDP.MKTP.CD&type=Indicators&cube_no=2&qterm=gdp (accessed December 8, 2011).
![]()
2 Commission Regulation (EU) No 257/2010 of 25 March 2010 setting up a programme for the re-evaluation of approved food additives in accordance with Regulation (EC) No 1333/2008 of the European Parliament and of the Council on food additives Text with EEA relevance. Official Journal L 08, 26/03/2010 P. 0019–0027. [http://eur-lex.europa.eu/LexUriServ/LexUriServ.do?uri=OJ:L:2010:080:0019:01:EN:HTML], retrieved on December 8th, 2011.
This page intentionally left blankd.


