
Energy, especially electrical energy, is a resource that is essential to the growth and maintenance of quality of life in contemporary civilization. According to the Energy Information Administration (EIA), “U.S. electricity use in 2010 was more than 13 times greater than electricity use in 1950” and is expected to grow in the long term (EIA 2011a). At present, coal is the dominant energy source for electricity production (Figure 5-1). A robust group of resources for energy production, transformation, and delivery is thus essential for national security. Although natural gas is a lower-carbon
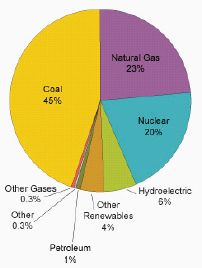
FIGURE 5-1 U.S. Net Electricity Generation by Fuel, 2010.
SOURCE: EIA 2011b, Figure 2, p. 1.
fossil fuel than coal, there is wide agreement that use of fossil fuels must be sharply reduced, at least for electricity production, in order to decrease their unfavorable impact on the environment, especially their release of carbon dioxide (CO2) to the atmosphere. Nuclear energy has potential for significant expansion in order to alleviate CO2 emission. Based upon long-standing U.S. national policy (Chu 2011): “Nuclear power will continue to be an important part of our energy mix, both in the United States and around the world. Its role grows more valuable as we confront a changing climate, increasing energy demand, and a struggling global economy.” It is this committee’s judgment that expertise in nuclear and radiochemistry is essential to ensuring that safe nuclear energy can remain part of the robust group of alternative energy sources for the United States.
The development of nuclear power is not a frontier fundamental research area of nuclear and radiochemistry, with the exception of chemical separations and some radiation chemistry topics, none of which appeared of general interest. However, the “back end” of the nuclear fuel cycle has many fundamental challenges. Box 5-1 represents the heart of the DOE Energy Frontier Research Center (EFRC) “Materials Science of Actinides,” one of 46 EFRCs initiated in 2010 after intense competition, thorough peer review, and evaluation by DOE management. It describes beautiful molecular clusters that are truly novel and that may be relevant to colloidal transport of radionuclides in repositories. The work shows how radiochemistry overlaps with colloid chemistry and nanochemistry. Other basic-research radio/nuclear chemistry areas related to nuclear power (novel chemical separations for closed fuel cycles, nuclear fission cross-sections, etc.) are far less comprehensible to non-specialists.
A BRIEF HISTORY AND CURRENT STATUS OF NUCLEAR ENERGY
An exciting milestone toward utilizing nuclear energy occurred on December 20, 1951, when Argonne National Laboratory’s reactor EBR-1 produced the first few kilowatts of nuclear electric power (Figure 5-3). In 1953, 8 years after the end of World War II, President Eisenhower spoke to the United Nations about peaceful uses of atomic energy. Five years later he opened the first atomic power station at Shippingport, Pennsylvania. In 1969, the first large-scale commercial nuclear power plant began operations in New Jersey.
The Oyster Creek Nuclear Generating Station in New Jersey was the first large-scale commercial nuclear power plant in the United States. It remains in commission as the oldest operating nuclear plant in the United States, having run since December 1969; its operator, Exelon Nuclear, plans to
BOX 5-1 ENERGY RESEARCH FRONTIERS CENTER: MATERIALS SCIENCE OF ACTINIDES
Fundamental aspects of chemical bonding of actinide elements, geochemistry of minerals, nanoscale materials, and migration of radionuclides under environmental conditions impact the nuclear fuel cycle. For example, there are very few minerals that contain peroxide because minerals form in the geosphere, where peroxide is unusual. However, the gamma radiation that exists in uranium-rich minerals produces peroxide and forms minerals with peroxide ions (O-O)2-.
Similar gamma irradiation produces peroxide in groundwater near stored used nuclear fuel and near uranium-containing nuclear waste materials (Burns 2010). Within the past decade a large number of novel uranium clusters with peroxide and hydroxide have been found to self-assemble as nanospheres from aqueous solution (Figure 5-2).
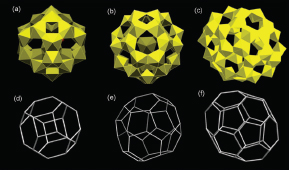
FIGURE 5-2 Clusters of uranyl peroxide hexagonal bipyramids containing topological squares. Shown are the polyhedral representations of the clusters (in yellow), and the topological graphs. (a,d) U24, (b,e) U32, (c,f) U40.
SOURCE: Burns 2010.
Most of these uranium clusters are spheroids with symmetry resembling, or even the same as, that of fullerene C60. Other uranium clusters have been prepared as tubes or crowns, some forming very quickly and subsequently rearranging into more stable solids. Related clusters have been prepared with ions of the transuranium elements neptunium and plutonium. These colloidal-size clusters (monodispersed aggregates) may form at near-ambient temperatures in alkaline solutions that are part of the nuclear fuel cycle or under environmental conditions within a nuclear waste repository.
Colloids of similar sizes are sufficiently stable that they have been shown to transport radionuclides over significant distances, providing an unanticipated mode of radionuclide migration. These uranium-peroxide-hydroxide aggregates serve as an appropriate form to study, to understand, and to control the fundamental structure-property relationships of colloidal aggregates in solution. They represent a new class of nanoscale materials for fundamental study and for applied radiochemistry related to the nuclear fuel cycle.
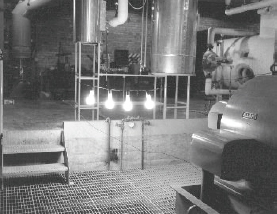
FIGURE 5-3 EBR-1 was the first nuclear reactor to generate electricity, providing power to light these four 200-watt light bulbs on December 20, 1951.
SOURCE: Argonne National Laboratory 2012.
close it in 2019. At present there are 104 nuclear power plants operating in the United States, producing 19.6 percent of all domestic electricity (NEI 2011a). As shown in Tables 5-1 and 5-2, the United States generates the most nuclear power in the world.
The first nuclear power plant in France was commissioned in 1971. With a sustained national commitment to nuclear power and nuclear deterrence, France has the largest worldwide percentage of its electricity from nuclear power (75 percent), produced by 58 reactors, the oldest having been commissioned in 1977 (World Nuclear Association 2011b).
The U.S. nuclear industry has had a sustained record of growth (Figures 5-4 and 5-5) and low production costs compared with other sources of electricity (Figure 5-6) for the past two decades, and a good safety record.1 For example, the capacity factor (shown in Figure 5-4)—which is the ratio of the amount of power generated over a time period compared to the rated 100 percent power able to be generated in the same time period—at existing U.S. nuclear power plants it is expected to remain at approximately 91 percent for the next several years (USNRC 2011a, NEI 2012). Therefore, in 2010 the capacity factor of U.S. nuclear power plants was 91.2 percent; i.e., the U.S. plants produced 91.2 percent of the maximum power possible. The other 8.8 percent was when the plants were not at 100 percent power, for outages, to perform maintenance, or testing. Taken together, this information
_______________
1 For more information, see NEI 2011b
TABLE 5-1 Worldwide Nuclear Power Plants and Nuclear Electricity Generation*
| As of October 2011 | Total for 2010 | |||||
| Country | Number of Nuclear Units |
Nuclear Capacity (MWe) |
Nuclear Generation (BkWh) |
Nuclear Fuel Share (Percent) of Electricity |
||
| Total | 431 | 367476 | 2630.2 | |||
| United States | 104 | 101229 | 807.1 | 19.6 | ||
| France | 58 | 63130 | 410.1 | 74.1 | ||
| Japan | 51 | 44642 | 280.3 | 29.2 | ||
| Russia | 32 | 23084 | 159.4 | 17.1 | ||
| Korea RO (South) | 21 | 18716 | 141.9 | 32.2 | ||
| Germany | 9 | 12003 | 133.0 | 28.4 | ||
| Canada | 17 | 12044 | 85.5 | 15.1 | ||
| Ukraine | 15 | 13168 | 84.0 | 48.1 | ||
| China | 14 | 11271 | 71.0 | 1.8 | ||
| Spain | 8 | 7448 | 59.3 | 20.1 | ||
| United Kingdom | 18 | 10962 | 56.9 | 15.7 | ||
| Sweden | 10 | 9399 | 55.7 | 38.1 | ||
| Belgium | 7 | 5943 | 45.7 | 51.2 | ||
| Taiwan | 6 | 4927 | 39.9 | 19.3 | ||
| Czech Republic | 6 | 3722 | 26.4 | 33.2 | ||
| Switzerland | 5 | 3252 | 25.3 | 38.0 | ||
| Finland | 4 | 2721 | 21.9 | 28.4 | ||
| India | 20 | 4385 | 20.5 | 2.9 | ||
| Hungary | 4 | 1880 | 14.7 | 42.1 | ||
| Bulgaria | 2 | 1906 | 14.2 | 33.1 | ||
| Brazil | 2 | 1901 | 13.9 | 3.1 | ||
| Slovakia | 4 | 1816 | 13.5 | 51.8 | ||
| South Africa | 2 | 1800 | 12.9 | 5.2 | ||
| Romania | 2 | 1310 | 10.7 | 19.5 | ||
| Argentina | 2 | 935 | 6.7 | 5.9 | ||
| Mexico | 2 | 1600 | 5.6 | 3.6 | ||
| Slovenia | 1 | 696 | 5.4 | 37.3 | ||
| Netherlands | 1 | 485 | 3.8 | 3.4 | ||
| Pakistan | 3 | 725 | 2.6 | 2.6 | ||
| Armenia | 1 | 376 | 2.3 | 39.4 | ||
* Sorted in order of 2010 nuclear generation. IAEA and WNA nuclear capacity figures vary slightly.
SOURCE: Reprinted with permission. IAEA 2011; World Nuclear Association 2011a.
indicates that nuclear energy will continue to be a part of the U.S. energy portfolio for the foreseeable future, and thus an employment sector requiring nuclear chemistry expertise.
In addition, there are several plants that are performing power upgrades, which add additional capacity to those units. On the new generation front, due to the historically low price for natural gas it is expected that new natural gas plants will be built and operated to replace the older coal plants and to cover increases in demand. Overall, the nuclear share of electricity generation in the United States is projected to remain stable or on a slight
TABLE 5-2 World Nuclear Fraction of Total Electricity Production for Selected Countries in 2010
| Country | Share of world nuclear electricity generation (6 largest) |
Nuclear fraction of country’s total electricity production |
| United States | 30.6% | 19.6% |
| France | 15.6% | 74.1% |
| Japan | 10.6% | 29.2% |
| Russia | 6.1% | 17.1% |
| South Korea | 5.4% | 32.2% |
| Germany | 5.1% | 28.4% |
SOURCE: EIA 2011c; World Nuclear Association 2011a.
decreasing trend over the next decade (EIA 2011g; NEI 2011e). Although the United States has the longest history of production of nuclear energy and the largest nuclear generating capacity, France currently has the most ambitious nuclear program with the world’s largest percentage of electricity production from nuclear reactors. Therefore, this report considers the French university and engineering academic nuclear chemistry institutions and French industrial training infrastructure as a useful model.
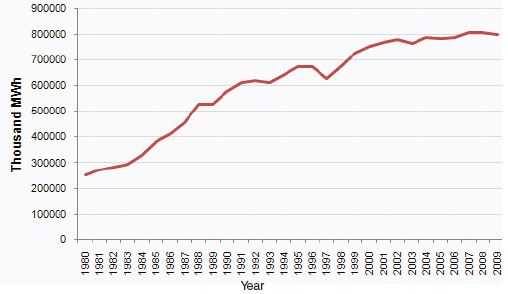
FIGURE 5-4 Growth of U.S. nuclear energy generation, 1980-2009.
SOURCE: EIA 2011d,e.
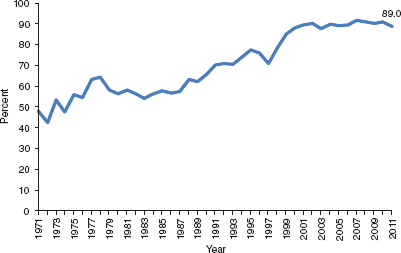
FIGURE 5-5 U.S. nuclear industry capacity factors—the ratio of the amount of power generated over a time period compared to the rated 100% power able to be generated in the same time period, 1971-2011. For comparison, France’s capacity factor was 75 percent in 2011. (World Nuclear Association 2011b).
SOURCE: NEI 2011c.
Nuclear power produces nearly 20 percent of U.S. electrical energy. This level has been achieved through growth in the nuclear power industry between 1970 and 1990. Despite the absence of nuclear power plant launchings since 1977, this 20 percent level has been maintained since about 2000 by an increase in the industry’s capacity factor to 90 percent. The reliability of delivery of nuclear energy (Figure 5-5) and its competitiveness with other sources of electric energy (Figure 5-6) underpin the nuclear power industry’s ongoing need for well-trained mid-level professionals such as nuclear and radiochemists. The nuclear power industry requires professionals with nuclear and radiochemistry expertise in each of these domains:
• Design of advanced nuclear fission reactors and implementation of both transformational and incremental improvements in reactor technology;
• Operation of existing nuclear reactors;
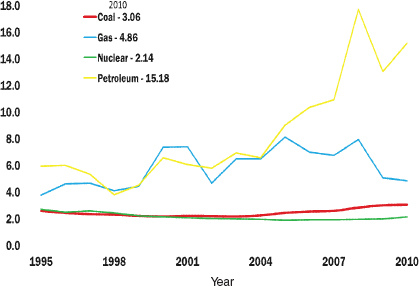
FIGURE 5-6 U.S. electricity production costs in 2010 cents per kilowatt-hour. Note that electricity production costs do not include the costs of construction, decommissioning, or indirect costs such as waste management or carbon capture.
SOURCE: NEI 2011c,d; data from EIA 2011f.
• Improvements and maintenance of components of the existing “open” nuclear fuel cycle;
• Storage and monitoring of used nuclear fuel;
• Safe and secure ultimate disposal of radioactive wastes streams from nuclear power plants;
• Environmental monitoring of all aspects of nuclear power; and
• Nuclear data (for example, half-lives, nuclear cross sections for neutronic processes including fission as a function of energy, and nuclear energy levels).
Bounding Scenarios
This chapter considers two bounding scenarios that will impact the future need for nuclear and radiochemistry expertise:
Scenario 1: Status quo
The first scenario (the lower bound) is that the existing civilian nuclear power reactor fleet is maintained, extending the operating life of the existing
nuclear fleet to 60 years, where appropriate. This is slightly more conservative than the “reference case” of the U.S. Energy Information Administration’s 2011 annual energy outlook (EIA 2011g, p.76), which assumes “3.8 gigawatts of expansion in the existing nuclear fleet with the completion of a second unit at the Watts Bar site, where construction on a partially completed plant has resumed.”
Scenario 2: Ambitious
The second scenario (the upper bound) assumes an ambitious path forward: to build the U.S. nuclear fleet to the “greenhouse gas price economy-wide” case of the U.S. Energy Information Administration’s 2011 annual energy outlook. In this scenario, “nuclear capacity additions from 2010 to 2035 will increase by 29 gigawatts as a consequence of the higher costs for operating fossil-fueled capacity.” This is based on 20 new power plants being built within the next 20 years.
Specific Sector Demand
The U.S. commercial nuclear industry comprises workers at electric power companies, power plant design firms, and nuclear power industry suppliers. According to the Bureau of Labor Statistics (BLS), 2010 employment in the nuclear electric power generation industry (NAICS 221113) was 56,778 (BLS 2012). With the inclusion of power plant design firms and supplies, the Nuclear Energy Institute (NEI) estimates the nuclear industry employed 120,000 people in 2009, that 38 percent of that workforce will be eligible to retire within the next five year, and that the industry will need to hire about 25,000 workers by 2015 to maintain the current workforce (NEI 2010). However, no further information is available on what fraction of that workforce consists of nuclear and radiochemistry experts, since the BLS has very little additional data on the nuclear industry. For example the BLS does not provide information on the occupations found in the nuclear industry nor is there information on the demographics of the nuclear industry workforce.
This committee contacted different groups of the nuclear power community to ask about the current and projected demand for nuclear and radiochemists over the next two decades. The responses received indicate a relatively small need for nuclear and radiochemists (when compared with the total nuclear industry workforce). However, the numbers are significant given the small size of the nuclear and radiochemistry workforce. The commercial nuclear power industry appears to be the segment with the most significant demand for radiochemists, particularly B.S. degree holders.
Overall, very few nuclear or radiochemists with advanced degrees will be needed at nuclear power plants.
Commercial Nuclear Power Plants
The standard organization at most nuclear power plants includes one radiochemist and one reactor chemist who is supported by chemistry technicians. Since there are 65 nuclear power plants in the United States, there are approximately 130 nuclear and radiochemists. Based on committee knowledge, out of the 130 approximately there are 4 M.S. and 1 Ph.D. level chemists, and the rest are bachelor’s degree chemists. An informal e-mail questionnaire was sent to chemistry managers at the 65 U.S. nuclear power plant sites (a total of 28 companies, which are listed in Appendix I) resulted in only 27 manager responses (41 percent). Currently, almost all plants that responded hire B.S.-level chemists and train their own radiochemistry and reactor chemists. The following table (Table 5-3) quantifies the predicted hiring needs of nuclear and radiochemists for existing nuclear power plants (lower bound “status quo” scenario, extrapolated from 27 responses to all 65 requests).
Nuclear Power Vendor Community
The nuclear power vendor-support services community was also contacted by the committee. Out of five companies contacted four responded (Westinghouse, GE-Hitachi, AREVA, Dionex). Based on the input from the vendors, the committee estimates that there are currently about 5 B.S., 5 M.S., and 5 Ph.D. level nuclear and radiochemists total employed by the nuclear power vendor community. The predicted hiring of nuclear and radiochemists for the nuclear vendors and support industry were very modest. Extrapolating from 4 responses to all 5 vendors, there was a predicted
TABLE 5-3 Estimated Hiring Needs for Radiochemists at Existing Nuclear Power Plants (status quo scenario)
| 0-5 y | 6-10 y | 11-15 y | 16-20 y | |
| B.S. | 104 | 0 | 82 | 62 |
| M.S. | 6 | 0 | 0 | 0 |
| Ph.D. | 2 | 0 | 0 | 2 |
NOTE: Numbers based on extrapolation of 27 responses to 65 requests. Data is for retirement replacement only.
SOURCE: Unidentified respondents to questionnaire sent to companies listed in Appendix I.
need for 6 B.S., 3 M.S. and 3 Ph.D. level nuclear and radiochemists over the next 20 years.
Hiring needs for additional nuclear and radiochemists for the ambitious upper-bound scenario of 20 new power plants within 20 years are estimated to be all at the B.S. level: 20 B.S.-level radiochemists during years 6-10 and 20 during years 11-15. This would be in addition to the need given for the “status quo”scenario.
National Laboratories with Focus on Reactor and Fuel Cycle Research
Idaho National Laboratory (INL) has been designated since 2005 as the lead DOE laboratory for nuclear reactor research. Other national laboratories (especially Argonne and Oak Ridge) traditionally have had and still have missions of nuclear reactor research. Demographics and projected hiring for nuclear and radiochemists in the national laboratories are presented in Chapter 2 of this report. The projected demands at the B.S.-degree level for nuclear and radiochemists at national laboratories (see Table 2-4) are small compared to projected needs within commercial nuclear power plants. However, the projected demands for M.S. and Ph.D. nuclear and radiochemists at national laboratories are larger. Therefore the recommendations for nuclear and radiochemists in the energy and power sector focus on education needs at the bachelor’s degree level.
Federal and State Nuclear Regulatory Agencies
Personnel data from the U.S. Nuclear Regulatory Commission (USNRC) indicate there may be a need for nuclear and radiochemists to replace retiring professional staff. As of December 2011, there were 3,995 total USNRC employees (USOPM 2012). Of these, 11 percent (432) had an occupation in the physical sciences (occupation code 13xx), mostly split between general physical sciences and health physics (occupational codes 1301 and 1306, respectively). However, there is no further data about educational degrees or area of expertise of the employees. Based on its own knowledge, the committee roughly estimates that 20 nuclear and radiochemistry professionals are currently employed at the USNRC at each degree level (14 percent of physical science employees). The committee further estimates that 3 M.S., and 4 Ph.D.-level nuclear and radiochemistry professionals will be needed by the U.S. NRC over the next 5 years to replace retiring staff. Projecting this estimate out over 20 years, the committee estimates that the USNRC will need 15 B.S.-, 12 M.S.-, and 16 Ph.D.-level replacement nuclear/
radiochemistry staff.2 This assumption is conservative because it does not take into account any additional demand due to the construction of new nuclear plants (see NRC Workforce projections GAO 2007, USNRC 2011b).
Most states have an agency that regulates nuclear facilities, which often have staff with nuclear and radiochemistry expertise. For example, Maryland’s Radiological Health Program fulfills this role for its one nuclear power reactor and other nuclear facilities. The Maryland agency was sent the same questionnaire that went to chemistry mangers at nuclear power plants, and responded that it employs one nuclear or radiochemist (Ph.D. level) and projects three hires within the next 15 years (1 B.S., 1 M.S., and 1 Ph.D.).3 Based on the response from Maryland and there being 31 states with nuclear power plants, the committee roughly estimates that there are 10 B.S.-, 20 M.S.-, and 20 Ph.D.-level nuclear and radiochemists employed. In addition, a conservative extrapolation, estimating only 50 percent of the Maryland projection, it expected that state regulatory agencies will hire 15 B.S., 15 M.S., and 15 Ph.D. nuclear and radiochemists in the next 15 years.
Fusion Energy Workforce
For the purposes of this study, the committee did not consider fusion energy workforce needs. While it is not yet possible to suggest the size of a workforce that would be required by a fusion energy industry, research and development efforts within the fusion community do employ radiochemists, particularly in the development of diagnostics of fusion.
Overall Demand
Overall the demand in the nuclear energy and power area, including the USNRC, and state regulatory agencies, conservatively projects the need for nuclear and radiochemists as shown in Table 5-4.
These demands do not include national laboratory needs, some of which will be in the energy and power area. The current and projected demand for nuclear and radiochemistry expertise in the national laboratories are presented in Figure 2-5 and Table 2-4.
_______________
2 Estimate determined as follows: 3 M.S. and 4 Ph.D. needed for each 5-year period over 20 yrs, thus 3×4 M.S. degree holders plus 4×4 Ph.D. degree holders. There is also an estimated need of 15 B.S.-level nuclear and radiochemists.
3 The questionnaire was also sent to representatives at state agencies in Illinois, New Jersey, and Pennsylvania, but no responses were received.
TABLE 5-4 Summary of Current and Projected Demand for Nuclear and Radiochemistry Expertise, Based on the Scenario 1—Status Quo Operation of Nuclear Power Plants
| To be hired … | |||
| Currently Employed* | …in the next 5 years | …in the next 20 years | |
| B.S. | 160 | 104 | 274 |
| M.S. | 49 | 14 | 36 |
| Ph.D. | 46 | 11 | 38 |
*Current employment: industry (125 B.S., 4 M.S., and 1 Ph.D.), vendors (5 B.S., 5 M.S., and 5 Ph.D.), USNRC (20 B.S., 20 M.S., and 20 Ph.D.), and state regulatory agencies (10 BS, 20 MS, and 20 Ph.D.).
See text for more information.
There is a critical need for nuclear and radiochemistry expertise in nuclear energy and power generation, especially at the B.S. level, based on a scenario of continued operation of nuclear power plants at current capacity:
• At the B.S. level, there is a high demand in the nuclear power industry for B.S. chemists, with a specialization in nuclear and radiochemistry. Largely due to estimates received from the U.S. nuclear power sector, there is a need over the next 20 years for approximately 274 B.S. chemistry graduates with an emphasis in nuclear or radiochemistry. Most training for nuclear or radiochemistry expertise among nuclear power operators is currently being done in-house by the industry.
• At the M.S. and Ph.D. levels, the demand in the nuclear power industry for nuclear and radiochemists with graduate degrees is small, but there is demand from federal and state regulatory agencies. The overall demand in the nuclear energy and power area (not including work at national laboratories) is projected to be 36 M.S. and 38 Ph.D. level nuclear and radiochemists over the next 20 years.
APS (The American Physical Society). 2008. Readiness of the U.S. Nuclear Workforce for 21th Century Challenges. A Report from the APS Panel on Public Affairs Committee on Energy and Environment. Washington, DC: American Physical Society. June 2008 [online]. Available: http://www.aps.org/policy/reports/popa-reports/upload/Nuclear-Readiness-Report-FINAL-2.pdf [accessed October 18, 2011].
Argonne National Laboratory. 2012. Achievements: Reactors Designed by Argonne National Laboratory [online]. Available: http://www.ne.anl.gov/About/reactors/frt.shtml [accessed April 30, 2012].
BLS (Bureau of Labor Statistics). 2012. Quarterly Census of Employment and Wages [online]. http://www.bls.gov/cew/ [accessed March 26, 2012].
Burns, P. C. 2010. From extended solids to nano-scale actinide clusters. Comptes Rendus Chimie 13:737-746.
Chu, S. 2011. IAEA General Conference. Monday, September 19, 2011. Available online at: http://energy.gov/sites/prod/files/IAEA%20General%20Conference%2009%2019%2011%20FINAL%20UPDATED.pdf (accessed December 6, 2011).
EIA (U.S. Energy Information Administration). 2011a. Use of Electricity. Energy Explained, U.S. Energy Information Administration [online]. Available: http://www.eia.gov/energyexplained/index.cfm?page=electricity_use [accessed October 21, 2011].
EIA. 2011b. Electric Power Monthly June 2011 with Data for March 2011. DOE/EIA-0226 (2011/06). U.S. Energy Information Administration [online]. Available: http://www.eia.gov/electricity/monthly/current_year/june2011.pdf [accessed November 3, 2011].
EIA. 2011c. Nuclear Statistics. Energy Explained, U.S. Energy Information Administration [online]. Available: http://www.eia.gov/energyexplained/index.cfm?page=nuclear_home#tab2 [accessed November 3, 2011].
EIA. 2011d. Electric Power Monthly July 2011 with Data for April 2011. DOE/EIA-0226 (2011/07). U.S. Energy Information Administration [online]. Available: http://www.eia.gov/electricity/monthly/current_year/july2011.pdf [accessed March 8, 2012].
EIA. 2011e. What is the Status of the U.S. Nuclear Energy? Energy in Brief, April 22, 2011. U.S. Energy Information Administration [online]. Available: http://www.eia.gov/energy_in_brief/nuclear_industry.cfm [accessed November 4, 2011].
EIA. 2011f. Total Energy: Data [online]. Available: http://www.eia.gov/totalenergy/data/annual/index.cfm [accessed October 24, 2011].
EIA. 2011g. Annual Energy Outlook 2011 with Projections to 2035. DOE/EIA-0383(2011). U.S. Energy Information Administration. April 2011 [online]. Available: http://www.anga.us/media/210391/annual%20energy%20outlook%202011.pdf [accessed November 4, 2011].
GAO (U.S. Government Accountability Office). 2007. Retirements and Anticipated New Reactor Applications Will Change NRC’s Workforce. GAO-07-106. Washington, DC: U.S. Government Accountability Office [online]. Available: http://www.gao.gov/new.items/d07105.pdf [accessed November 4, 2011].
IAEA (International Atomic Energy Agency). 2010. Human Resources for Nuclear Power Expansion. NTR2010 Supplement. Information Document at the 54th IAEA General Conference [online]. Available: http://www.iaea.org/About/Policy/GC/GC54/GC54InfDocuments/English/gc54inf-3-att5_en.pdf [accessed November 4, 2011].
IAEA. 2011. Latest News Related to PRIS and the Status of Nuclear Power Plants. International Atomic Energy Agency [online]. Available: http://www.iaea.org/programmes/a2/index.html [accessed October 21, 2011].
NEI (Nuclear Energy Institute). 2010. Nuclear Industry’s Comprehensive Approach Develops Skilled Work Force for the Future. Fact Sheet, September 2010 [online]. Available: http://www.nei.org/resourcesandstats/documentlibrary/newplants/factsheet/nuclearindustrydevelopsworkforce/ [accessed November 4, 2011].
NEI. 2011a. U.S. Nuclear Power Plants. Nuclear Statistics [online]. Available: http://www.nei.org/resourcesandstats/nuclear_statistics/usnuclearpowerplants/[accessed October 21, 2011].
NEI. 2011b. Key Issues [online]. Available: http://www.nei.org/keyissues [accessed November 2, 2011].
NEI. 2011c. Reliable and Affordable Energy. U.S. Nuclear Industry Capacity Factors (1971-2010) [online]. Available: http://www.nei.org/resourcesandstats/documentlibrary/reliableandaffordableenergy/graphicsandcharts/usnuclearindustrycapacityfactors/ [accessed November 24, 2011].
NEI. 2011d. Reliable and Affordable Energy. U.S. Electricity Production Costs (1995-2010) [online]. Available: http://www.nei.org/resourcesandstats/documentlibrary/reliableandaffordableenergy/graphicsandcharts/uselectricityproductioncosts/ [accessed October 24, 2011].
NEI. 2011e. Resources and Stats: License Renewal [online]. Available: http://www.nei.org/resourcesandstats/nuclear_statistics/licenserenewal/ [accessed October 24, 2011].
NEI. 2012. Myths & Facts: Operating Reactors Beyond 40 Years, January 2012 [online]. Available: http://www.nei.org/resourcesandstats/documentlibrary/newplants/whitepaper/myths--facts-operating-reactors-beyond-40-years/ [accessed March 8, 2012].
USNRC (U.S. Nuclear Regulatory Commission). 2011a. Fact Sheet on Reactor License Renewal [online]. Available: http://www.nrc.gov/reading-rm/doc-collections/fact-sheets/fs-reactor-license-renewal.html [accessed November 2, 2012].
USNRC. 2011b. Organization and Function. U.S. Nuclear Regulatory Commission [online]. Available: http://www.nrc.gov/about-nrc/organization.html [accessed November 4, 2011].
USOPM (U.S. Office of Personnel and Management). 2012. Fedscope: Federal Human Resources Data [online]. http://www.fedscope.opm.gov/ [accessed March 27, 2012].
World Nuclear Association. 2011a. World Nuclear Power Reactors & Uranium Requirements, October 14, 2011. World Nuclear Association [online]. Available: http://www.world-nuclear.org/info/reactors.html [accessed November 17, 2011].
World Nuclear Association. 2011b. Nuclear Power in France [online]. Available: http://www.world-nuclear.org/info/inf40.html [accessed October 21, 2011].


