
3
Scientific Advances and Discoveries
In the golden age of polar exploration at the beginning of the 20th century—when explorers like Frederick Cook, Robert Peary, Roald Amundsen, Robert Scott, and Ernest Shackleton led expeditions to the North and South Poles—science discovery was driven by the desire to fill in blank spaces on maps. Now it is driven by the desire to learn about different kinds of unknowns, such as the consequences of changing climate, ecosystems that exist on the underside of the ice, changing patterns of sea ice, and mechanisms of ice sheet flow. International Polar Year 2007-2008 witnessed a host of discoveries in a wide variety of scientific fields—from how Earth’s climate has changed in the past to how it may change in the future, from understanding what goes on in the depths of the ocean to understanding the weather out in space, and from learning about the impacts of climate change on marine ecosystems to their implications for human societies.
Many IPY discoveries relate to how quickly Earth is warming (Box 3.1). Contemporary change detection is difficult for some polar climate processes and their global linkages because the frequencies of natural change may be longer than the three decades of modern observations. It is clear, however, that global weather and climate patterns are interconnected yet spatially variable. The polar regions play key roles in this global system, in part because of the interactions of land and ice masses with ocean currents and atmospheric circulation patterns. IPY enabled scientists around the world to join forces, using new tools and bridging frontiers, in seeking information to expand knowledge of these patterns and Earth’s linked systems. Specifically, scientific results from IPY projects are shedding light on changes in the environment, including climatic responses and human-environmental dynamics.
POLAR ICE SHEET SCIENCE AND SUBGLACIAL SYSTEMS
During IPY, numerous international teams addressed scientific issues from on, within, and below the world’s two massive ice sheets, in Greenland and Antarctica (Figure 3.1). Together these ice masses contain enough water to raise global sea level by 70 m if they melted. These vast frozen expanses exist because ice loss through melting, ablation, and the calving of icebergs has been balanced or exceeded in the past by winter snowfall. But in the years leading up to and during IPY, vivid images showed ice calving along the perimeters of both Greenland and Antarctica and the rapid disintegration of vast ice shelves along the Antarctic Peninsula. Although scientists are still evaluating relationships between ice mass loss and warming of the atmosphere and oceans, it appears that continued warming will likely cause more mass loss.
The sensitivity of the Greenland and Antarctic ice sheets to climate change and their major roles in modulating sea level make their condition relevant to society. Today millions of people live along low-lying coastlines within a meter of sea level. Future sea level rise is a concern for both maritime societies and extensive seaside commercial and military infrastructure throughout the globe (see also Chapter 5). Numerous satellite data enabled international teams to make important
BOX 3.1
Climate Change and Polar Amplification
The carbon dioxide content of the atmosphere has been steadily increasing from its preindustrial value of ~280 parts per million (ppm) (Figure) (IPCC, 2007a), and the rate of increase has significantly intensified in the past 60 years, from 0.53 ppm per year in 1957 (when measurements were started) to nearly 2 ppm per year in 2008. If this trend continues, by 2057 (perhaps the time of the next IPY) carbon dioxide values may approach 500 ppm. Furthermore, there is increasing documentation that in the geologic past, continental ice sheets grew only when atmospheric carbon dioxide values were low and retreated when values were high. Such trends are in agreement with climate change projections based on increasingly sophisticated computer simulations of climatic change.
Climate changes and their impacts have considerable spatial variability due to Earth’s interlinked and moving atmospheric and oceanic circulation patterns. Although warming of the planet as a consequence of anthropogenic carbon dioxide is happening nearly everywhere (IPCC, 2007a), it is accentuated in the high latitudes due to polar amplification caused by strongly positive snow and ice feedbacks (Serreze et al., 2009; Manabe and Wetherald, 1975). Concern about this polar amplification drove much of the research carried out during IPY, and the complex nature of Earth systems and changes will require significant and continuing investigation to foster understanding and action toward sustainability.
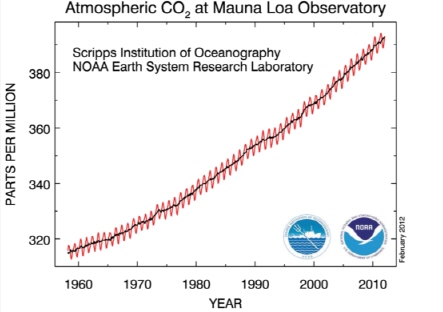
FIGURE The carbon dioxide (CO2) data (red curve) measured on Mauna Loa constitute the longest record of direct measurements of CO2 in the atmosphere. The black curve represents the seasonally corrected data.
SOURCES: NOAA Earth System Research Laboratory and Scripps Institution of Oceanography.
discoveries of large changes occurring in both ice sheets. Taken together, these assessments showed that the pace of ice sheet mass loss has been increasing since the end of the last century, accelerating sea level rise. As a result of research coming out of IPY, projections for the future show an accelerating trend for sea level rise by 2100, with model predictions ranging from 20 to 180 cm (Figure 3.2). The upward trend in sea level rise is primarily the result of melting of glaciers and small ice caps, and the thermal expansion of seawater due to ocean warming. The former accounts for about 30 percent of the contribution to sea level rise (Nicholls and Cazenave, 2010).
Ice sheet mass changes can be estimated using data from Gravity Recovery and Climate Experiment (GRACE), a satellite designed to measure gravity variations, which in this case are created by regional mass redistributions within the ice sheets. IPY findings from the LEGOS1 project using GRACE data provided evidence that the Greenland and Antarctic ice sheet contributions to sea level rise increased to 30 percent of the total sea level rise after 2003, compared to their smaller contribution of 15 percent of sea level change between 1993 and 2003 (IPCC, 2007a). Repeat observations of ice sheet elevations from the laser altimeter onboard ICESat-1 captured the detailed
______________________
1Laboratoire d’Etudes en Géophysique et Océanographie Spatiales; www.legos.obs-mip.fr/.
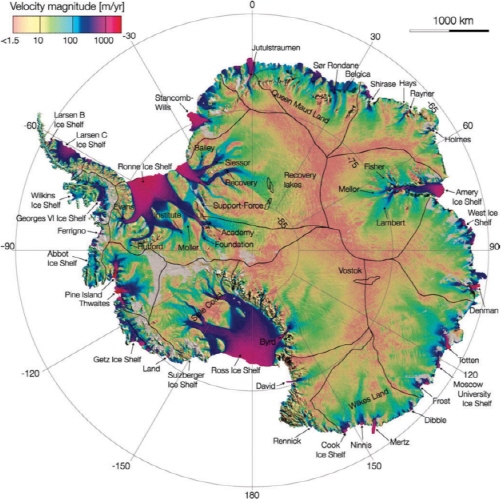
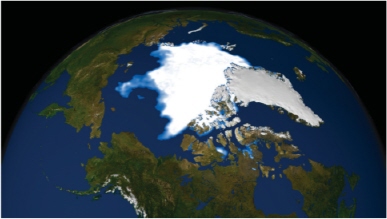
FIGURE 3.1 Maps of Arctic and Antarctic showing major ice sheets. Top: Antarctic ice velocity derived from ALOS PALSAR (Advanced Land Observing Satellite, Phased Array type L-band Synthetic Aperture Radar), Envisat ASAR (Advanced Synthetic Aperture Radar), RADARSAT-2, and ERS (Earth Remote Sensing)-1/2 satellite radar interferometry, color-coded on a logarithmic scale, and overlaid on a MODIS (Moderate Resolution Imaging Spectroradiometer) mosaic of Antarctica. Thick black lines delineate major ice divides. Thin black lines outline subglacial lakes. Thick black lines along the coast are interferometrically derived ice sheet grounding lines. Bottom: Satellite-based passive microwave images of the sea ice cover have provided a reliable tool for continuously monitoring changes in the extent of the Arctic ice cover since 1979. This visualization shows Arctic sea ice minimum area for 2010. SOURCE: Rignot et al., 2011 (top); NASA Scientific Visualization Studio (bottom).
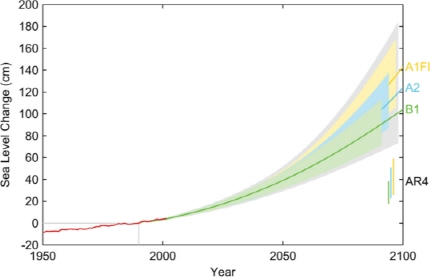
FIGURE 3.2 Projection of sea-level rise from 1990 to 2100, based on Intergovernmental Panel on Climate Change (IPCC) temperature projections for three different emission scenarios (labeled on right). The sea level range projected in the IPCC AR4 (IPCC, 2007b) for these scenarios is shown for comparison in the bars on the bottom right. Also shown is the observations-based annual global sea level data (Church and White, 2006) (red) including artificial reservoir correction (Chao et al., 2008). SOURCE: Vermeer and Rahmstorf, 2009.
pattern of changes across each ice sheet. This pattern of interior gain and marginal loss that had been seen in Greenland was detected across the Antarctic ice sheet with particularly large mass losses concentrated in the Amundsen Sea region (Pritchard et al., 2009).
The magnitude and pattern of ice mass loss directed many researchers’ attention during IPY to the margins of the ice sheet, where the ocean melts the undersides of the floating fringes, and the base of the ice. Observations of accelerating ice flow following the collapse of Antarctic ice shelves confirmed the buttressing effect of ice shelves on ice flow and underscored the importance of ice shelves to ice sheet stability (Rignot et al., 2004; Scambos, 2011; Joughin et al., 2010). Initial oceanographic measurements made during IPY in the fjords of Greenland outlet glaciers (Figure 3.3) and beneath the Pine Island ice shelf in Antarctica confirmed the presence of warm waters expected to cause elevated ice melting (Jenkins et al., 2010; Rignot et al., 2010; Straneo et al., 2010).
The ramifications for ice sheet mass change of the discovery of a surprisingly active subglacial water system beneath both ice sheets were pursued vigorously during IPY. Abrupt draining of surface-melt lakes and associated fracture propagation and glacial movement were measured on the Greenland ice sheet (Das et al., 2008; Joughin et al., 2008). Discovery of actively filling and draining Antarctic subglacial lakes was followed by a comprehensive mapping using ICESat laser altimetry, resulting in the detection of 124 lakes actively filling or draining between 2003 and 2008 (Smith et al., 2010). The first case of a direct connection between subglacial lake drainage and a surge in an East Antarctic glacier was made using a combination of satellite altimetry and imagery (Stearns et al., 2008; Figure 3.4). Other lakes, detected with surface radar are water-rich but not currently water-filled (Langley et al., 2011).
New observations were made during IPY of the potential awakening of the East Antarctic ice sheet, a potentially powerful influence on global sea levels and the climate system. Surface mass balance in East Antarctica is a fundamental but poorly known component of the ice sheet mass balance (IPCC, 2007a). Using an interdisciplinary approach and latest technologies, the Norwegian-U.S. Scientific Traverse of East Antarctica IPY project aimed to improve understanding of surface mass balance and the drivers of climate variability in East Antarctica. Findings to date show that millennial-scale net accumulation rates from ice cores are generally lower than net snowfall estimated in previously published large-scale assessments (Anschutz et al., 2009). Discoveries of links between microstructure, accumulation rate, and satellite imagery provide the means of accounting for natural variability in 20th century accumulation trends and show that current climate models likely overestimate accumulation in East Antarctica (Albert et al., 2012; Scambos et al., 2011). Firn temperature measurements suggest a recent warming trend near the crest of the East Antarctic ice sheet but cooling or no change at a lower elevation
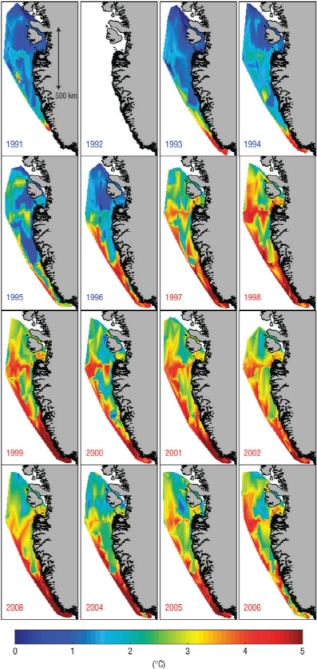
FIGURE 3.3 Warm waters located at the margins of an ice sheet can cause increased melting and thinning of the ice. This image indicates subsurface ocean temperatures over the west Greenland continental shelf showing the impact of warming fjord waters on the acceleration of ice flow. In 1997, a warm water pulse entered the region and coincided with rapid thinning and acceleration of an outlet glacier along the west coast of Greenland. SOURCE: Holland et al. (2008).
site (Muto et al., 2011). Aerosol depositions across all spatial and temporal scales across the continent show surprising similarity, supporting the importance of South American and other midlatitude source areas for dust, burning, and pollution aerosols (Bisiaux et al., 2012). Overall, our understanding of the East Antarctic Ice Sheet improved during IPY, and these observations set the baseline for continued monitoring in the future.
An entire mountain range under the Antarctic ice sheet was discovered during the 1957-1958 International Geophysical Year (IGY) but remained uninvestigated because of extreme inaccessibility until this IPY. The Antarctic Gamburtsev Province project used cutting-edge airborne radar to investigate the Gamburtsev Mountains which are completely covered by ice near the center of the East Antarctic Ice Sheet. The data reveal an Alps-like mountain range incised by fluvial river valleys in the south and truncated by the landward extension of the Lambert Rift to the north (Figure 3.5). Radar data reveal areas where hundreds of meters of ice have been frozen onto the bottom of the ice sheet, driving subglacial flow and ice sheet behavior in ways not captured in present models (Bell et al., 2011), as well as the first comprehensive view of the crustal architecture and uplift mechanisms for the Gamburtsevs (Ferraccioli et al., 2011).
IPY also created the opportunity for teachers, students, and laypersons, as well as scientists from many disciplines to access data to foster their own discoveries. The Landsat Image Mosaic of Antarctica (LIMA) IPY project produced the first-ever, true-color, high-resolution mosaic image of Antarctica using visible imagery from the years between 1999-2003 (Bindschadler et al., 2008). This tool, made available to the public,2 enables teachers, students, and scientists to explore the continent from their desks. The early completion of this mosaic allowed polar researchers the opportunity to make discoveries during IPY using LIMA data. For example, using LIMA, Fretwell and Trathan (2009) identified previously unidentified penguin rookeries and determined other rookeries that have been abandoned.
Another one of the IPY 2007-2008 projects that had its beginnings during the IGY was the McCall Glacier Research Program (Weller et al., 2007). This
______________________
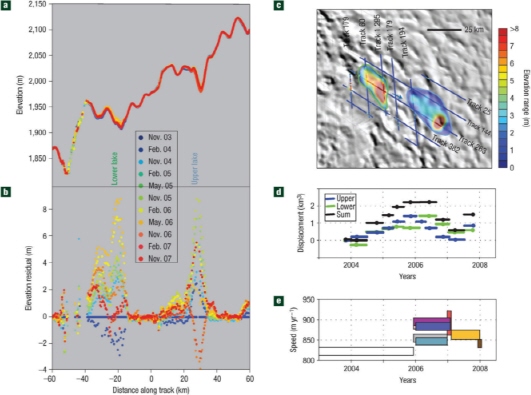
FIGURE 3.4 Subglacial systems (and the implications for ice sheet mass change) were actively studied during IPY. In fact, satellite altimetry and imagery were used to make a direct connection between subglacial lake drainage and changes in glacier dynamics. Notably, Stearns et al. (2008) show that surface elevation changes in the Antarctic Byrd Glacier reflect the filling and draining of the subglacial lakes below. (a) ICESat elevations for 11 passes between November 2003 and November 2007. (b) Elevation residuals for ICESat data after correction for topography. (c) Map of elevation ranges for 500-m sections of track, interpreted lake boundaries (green, blue outlines) and elevation ranges for gridded surface displacements. The arrow indicates the direction and orientation of the profiles in (a) and (b). (d) Estimated lake volume displacements for the downstream lake (green), the upstream lake (blue) and the two lakes together (black). The horizontal bars show time uncertainty in lake volumes. (e) Ice speed at the grounding line from 2003 to 2008. The horizontal bars indicate start and end dates for each pair of observations; the thickness of each bar represents its associated error. SOURCE: Stearns et al., 2008.
important glacier lies in the Brooks Range, near the northeast corner of Alaska and offers the longest history of research on any glacier in the U.S. Arctic. Studies revealed a long period of negative mass balance, with annual losses of–100 to–200 mm water equivalent during the period 1958-1971 (Nolan et al., 2005). The negative mass balance of the glacier persists today,3 including accelerated thinning of ice volume and retreat of the ice margin, indicating that climate warming is exerting a long-term influence on glacial systems in this region.
SEA ICE VULNERABILITY AND CONNECTIONS TO SOCIETY
Extensive research was conducted during IPY to understand the multifaceted role of sea ice—that is, ocean (salt) water that has frozen—in climate, ecologic, and socioeconomic systems. One critical element of sea ice that crosses many scientific disciplines is its influence on planetary albedo. Albedo, or reflectance,
______________________
3 Matt Nolan, University of Alaska, Fairbanks, personal communication, 2011.
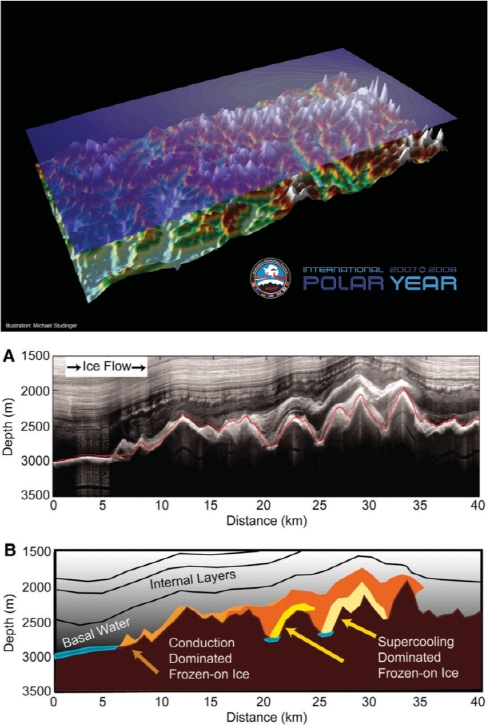
FIGURE 3.5 Top: Until IPY 2007-2008, an entire mountain range under the Antarctic ice sheet (discovered during the International Geophysical Year) remained uninvestigated because of inaccessibility. Cutting-edge airborne radar was used to investigate the Gamburtsev Mountains which are completely covered by ice near the center of the East Antarctic Ice Sheet. Bottom: (A) Radar data reveal areas where hundreds of meters of ice have been frozen onto the bottom of the ice sheet, driving subglacial flow and ice sheet behavior in ways not captured in present models. (B) A schematic of this process. SOURCES: Michael Studinger, NASA (top) and Bell et al., 2011 (bottom).
is a material property, dependent on the surface type. As the extent of the white sea ice and its associated snow cover decreases, more dark ocean surface water is exposed to the sun and warmed. This in turn melts more ice, further decreasing the extent of the ice, a positive feedback, and allows a significant increase in heating of the exposed ocean, leading to subsequent increases in the amounts of heat and moisture transferred from the ocean into the overlying atmosphere (Figure 3.6).
Because long-term studies of sea ice extent prior to 1950 were limited, and a bipolar record of the sea ice concentrations extending back to the late 19th century has only recently been attempted,4 the science community largely relies on satellite-based passive microwave data collected since 1978. Instrumental time series of minimum ice extent leading up to 2006 showed that there had been an ~8 percent areal loss per decade in Arctic sea ice, with the strongest losses occurring in areas such as the Kara and Barents Seas. Thus IPY provided an opportunity to study the changing Arctic in a time of rapid change. During the first year of IPY investigations (2007), the minimum sea ice extent value showed a sharp additional decrease below most model projections from recent trends (Stroeve et al., 2007, 2008). This was not a trivial change; rather, Arctic sea ice area at the end of the 2007 summer was 27 percent lower than the previous record low observed in 2005 (Figure 3.7). Although in 2008-2009 there was a small recovery toward the earlier (pre-2006) trend-line, the 2010 value remained well below this trend. The sea ice minimum for late September 2011 was only slightly higher than in 2007.
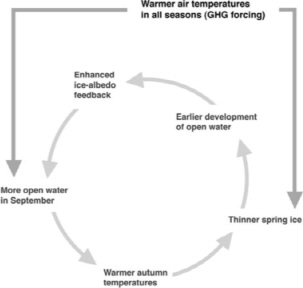
FIGURE 3.6 Cartoon of positive feedback leading to sea ice loss in the Arctic. SOURCE: Stroeve et al. 2011.
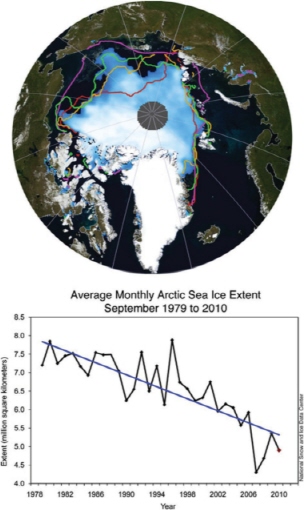
FIGURE 3.7 Instrumental records show a decrease in sea ice extent in the years leading up to IPY. As a result, IPY provided scientists an opportunity to study the Arctic in a time of rapid change. Top: Monthly sea ice concentration for September 2012. The red line marks the September 2007 extent, the orange line is the extent for September 2008, the green line the September 2009 extent, and the pink line is the climatological (1979-2000) monthly mean for September. Bottom: Time series of monthly averages of September sea ice extent with linear trend line showing decreasing trend over past three decades and sharp drop in 2007, the first year of IPY. SOURCE: Stroeve et al., 2011.
______________________
4 http://nsidc.org/data/docs/noaa/g00799_arctic_southern_sea_ice/index.html.
In addition to changes in ice extent, upwardlooking sonar data obtained via recent submarine cruises coupled with estimates based on measurements by NASA’s ICESat laser altimeter indicate that sea ice thicknesses have also shown a substantial decrease of more than a meter from values obtained prior to 1990 (Kwok and Rothrock, 2009). Satellite tracking of ice trajectories (Fowler et al., 2003; Pfirman et al., 2004; Rigor and Wallace, 2004) indicated that the ice age—which correlates with thickness—was also decreasing (Figure 3.8). Although the minimum ice extent in 2011 was slightly larger than in 2007, the actual volume of ice present was dramatically less because of the consistent thinning trend due to the loss of thicker multiyear ice (Kwok and Rothrock, 2009; Maslanik et al., 2007). Many interpretations of these measurements were quickly published; some positing that 2007 represented a tipping point leading to an
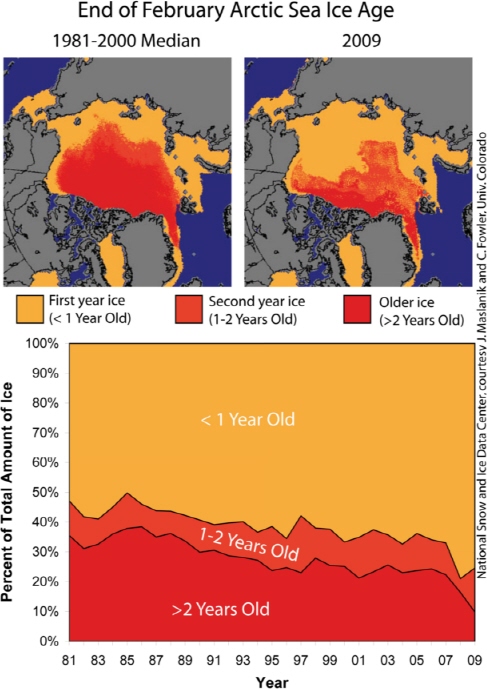
FIGURE 3.8 Satellite tracking provides information on Arctic sea ice age, which correlates with thickness. Upper panels show the spatial pattern of sea ice age at the end of February in 2009 (upper right) compared to the median age during the period 1981-2000 (upper left). The lower panel shows the relative percent composition of sea ice of different ages aggregated over the entire Arctic basin. It can be shown that sea ice cover in the Arctic is steadily decreasing both in extent and thickness, as indicated by the loss of multiyear ice. SOURCE: National Snow and Ice Data Center, courtesy J. Maslanik and C. Fowler, University of Colorado.
ice-free Arctic during Northern Hemisphere summers within the near future (Kwok and Cunningham, 2008; Stroeve et al., 2008). Replacing thick old ice floes that are currently being lost requires several years and is increasingly unlikely under current warming climatic conditions.
During periods of minimum sea ice extent, breakout events—such as the large volumes of ice swept out of the Arctic Basin during the fall of 2007—became more frequent (Stroeve et al., 2011). Current studies suggest that such events are the composite result of thermodyamic and dynamic processes, including the preconditioning of the ice by warmer than usual air and water temperatures and pressure patterns conducive to ice exiting the Arctic Basin via the Fram Strait (Perovich and Richter-Menge, 2009). In addition, studies of the ice-albedo feedback contribution to the observed warming of the upper layer of the Arctic Ocean show that although annual trends are small, cumulative effects are large, amounting to a 17 percent total increase by 2005. Although the time series of this contribution was fairly constant from 1979 to 1992, it then increased steadily from 200 MJm-2 to about 400 MJm-2. Furthermore overall negative trends in ice extent are also strongest in more northerly locations as would be expected if the icealbedo effect was a significant contributor (Perovich et al., 2007).
Changes in Arctic sea ice extent are now becoming implicated with changing weather patterns at lower latitudes. During the last few years there has been a breakdown in the stable counterclockwise polar vortex wind pattern that during recent decades has characterized the Arctic. This wind acts to keep the far north cold and isolated from temperate regions farther south. As a result, cold air outbreaks to the south have become increasingly frequent, with the Arctic and sub-Arctic consistently exhibiting above-normal temperatures and less snowfall, while typically more temperate regions to the south have been subjected to heavy snows and frigid temperatures. Major economic disruptions occurred with these events in northern Europe, eastern North America, and eastern Asia. One contributing factor to these changes may be the decrease in both the extent and thickness of the Arctic sea ice cover (Serreze et al., 2007). At present it is uncertain exactly how recent changes in the Arctic are modifying sub-Arctic climate patterns such as the North Atlantic Oscillation (Overland, 2011), but this is an area of active research (Francis et al., 2009; Overland et al., 2007, 2008; Overland and Wang, 2010).
Sea ice conditions in the Antarctic differ from the Arctic in a number of ways. Most sea ice in the Southern Ocean melts each summer, so there are only a few regions with multiyear ice. The Antarctic Peninsula region is undergoing the largest positive temperature increase of any Southern Hemisphere location: +3.7 ± 1.6°C for the 20th century based on unweighted station data as compared to a global value estimate by the Intergovernmental Panel on Climate Change of +0.6 ± 0.2°C (Vaughan et al., 2003). These pronounced temperature changes have been associated with a noticeable decrease in sea ice extent (–5.4 percent per decade for the Amundsen and Bellingshausen Seas (Domack et al., 2003; Stammerjohn et al., 2008); and with spectacular retreats and disintegrations of several ice shelves, for example, Larsen, George VI, and Wilkins (Rignot et al., 2004; Scambos et al., 2004). In contrast, the sea ice cover around West Antarctica showed a slight increase in area with the Ross Sea showing the largest increase (+4.4 percent per decade; Cavalieri and Parkinson, 2008; Stammerjohn et al., 2008). When the Southern Ocean was examined as a whole, sea ice extent showed a slightly positive trend (+1.0 percent per decade).
The mechanisms causing changes in Antarctic sea ice conditions investigated during IPY remain under intense investigation. Oceanographic factors appear to be important, and theories explaining the observed differences between the significant sea ice retreats in the Antarctic Peninsula region and the slight advances in the seas off eastern Antarctic have been suggested. One particularly interesting theory includes couplings between processes involving stratospheric ozone, changes in atmospheric pressure patterns, oceanographic upwelling, and sea ice distributions (Sigmond et al., 2011; Thompson and Solomon, 2002). Most of these linkages have been supported by an analysis of melt features on the Pine Island Glacier ice shelf (Bindschadler et al., 2011). Interesting correlations have also recently been explored between Antarctic sea ice extent changes and variations in the state of the Southern Annual Mode and the El Nino–Southern Oscillation indexes of atmospheric pressure pattern variability (Stammerjohn et al., 2008; Figure 3.9).
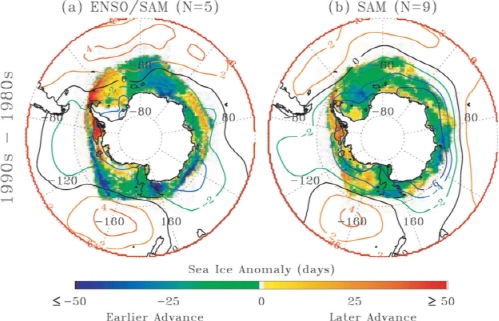
FIGURE 3.9 Decadal composite differences of sea ice advance and retreat with emphasis on ENSO and Southern Annular mode. SOURCE: Stammerjohn et al., 2008.
MARINE ECOSYSTEMS IN A WARMING WORLD
While disappearing sea ice in the Arctic, portions of Antarctic, and glaciers are among the most visible surface indications that our planet is warming, IPY research also served to highlight the vulnerability of Arctic and Antarctic polar marine ecosystems to warming and to provide benchmarks of present physical and biological ocean conditions against which changes can be quantified. In contrast to earlier international years where polar biology and ecology were nearly ignored, research conducted during IPY 2007-2008 clearly demonstrates that such changes are having a serious impact at all trophic levels—from microorganisms to top predators (Grebmeier, 2012; NRC, 2011a,b). It remains a major forecasting challenge to understand the ecological, biogeochemical, and socioeconomic implications and broader impacts of these changes and predict their future courses as warming and sea ice loss proceed over the next few decades. New international observation systems put in place during IPY (e.g., Sustaining Arctic Observing Networks [SAON]; and the U.S. Sea Ice Mass Balance in the Antarctic, IPY/ASEP, and SO GLOBEC; also see Chapter 4) are providing data critical for determining the pace of future change and identifying the complex mechanisms driving ecosystem modifications in both the Arctic (western Arctic, e.g., Chukchi Sea) and the Antarctic (western Antarctic peninsula).
Arctic Discoveries
As a consequence of a warming world and associated changes in sea ice and ocean currents, Arctic scientists anticipate significant shifts and reorganization of marine ecosystems. The dramatic sea ice loss of 2007 was depicted in images of polar bears and walruses stranded as their habitat literally melted beneath them, and there is evidence of reduced body size in polar bears caused by declining sea ice (e.g., Rode et al., 2010). Projections of future sea ice distributions (e.g., Overland, 2011) indicate that summer ice cover is likely to remain for longest in the region north of Canada and Greenland where the oldest and thickest ice now occurs (Figure 3.8). This area may become a refuge (Pfirman
et al., 2009) for ice-associated species such as seals (e.g., Kelly et al., 2010) and the polar bears that depend on them (e.g., Durner et al., 2009).
Significant shifts and reorganization of marine ecosystems are now anticipated by Arctic scientists as a consequence of environmental warming and associated changes in ocean currents. In the Norwegian, Barents, and Chukchi Seas (Figure 3.10), water temperatures have reached the highest values ever recorded (Dickson and Fahrbach, 2011; IPCC, 2007a). The Atlantic water layer that penetrates at depth into the Arctic Basin has been warming and changing salinity, especially from the Laptev Sea into the Canada Basin (Dmitrenko et al., 2009, 2008; Polyakov et al., 2007) consistent with earlier observations first documented by the Surface Heat Budget of the Arctic Ocean Program (Morison et al., 2000). At the same time, in the Pacific sector of the Arctic, North Pacific and Bering Sea water masses penetrating into the Arctic via the Bering Strait are also warming, triggering significant sea ice melt while becoming an important factor leading to thinning of the seasonal ice pack across the western Arctic (Steele et al., 2008; Woodgate et al., 2010).
For the eastern Arctic to the east and west of Svalbard, warm Atlantic water enters the Arctic Basin from the Greenland and Barents Seas. Here recent studies support the idea that the sensible heat carried by this water causes the southward moving ice to melt, resulting in a decrease in the salinity and density of the upper part of the water column and thereby contributing to
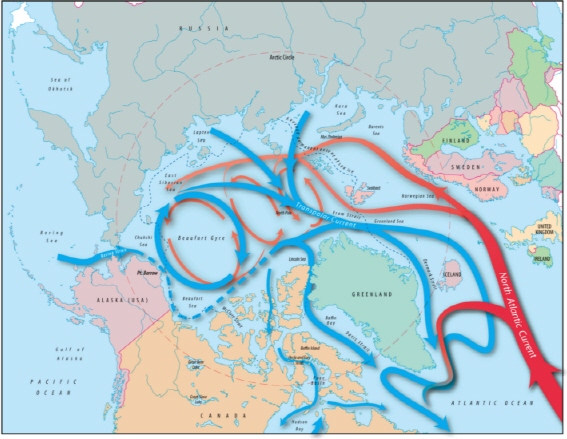
FIGURE 3.10 Cold, relatively fresh water from the Pacific Ocean enters the Arctic Ocean through the Bering Strait (blue arrows). It is swept into the Beaufort Gyre and exits into the North Atlantic Ocean through three gateways (Fram, Davis, and Hudson Straits). Red arrows indicate warmer, more saline water from the Atlantic Ocean. SOURCE: Jack Cook, Woods Hole Oceanographic Institution.
the development of a stable low salinity layer below the surviving sea ice. However, most of the Atlantic water is subducted beneath this low salinity layer to a depth where its heat content appears to have little effect on the growth and decay of the overlying ice (Maslowski et al., 2001; Polyakov et al., 2011).
The Bering and Chukchi Seas are key areas in biological terms because they are among the most productive waters on Earth; half of the marine harvest of the United States currently comes from the Bering Sea alone (King et al., 2005). Spatial and temporal shifts in the freeze-up and melt-back of seasonal ice in the Bering Strait region and western Arctic are causing measureable shifts in many marine species (Figure 3.11). Earlier ice breakup changes the timing and intensity of the ice edge bloom because of its association with seasonal changes in sunlight and day length. Such changes in primary productivity and nutrient utilization at the base of the food chain are causing reorganization of zooplankton communities, which can result in an increase in zooplankton abundance and biomass (Arrigo et al., 2008; Matsuno and Yamaguchi, 2010). Moreover, reductions in sea ice appear to be propelling the northward migration of larger warm-adapted Pacific species with faster growth rates (Grebmeier, 2012). Changes in surface water productivity drive changes throughout the water column, notably in benthic communities, which are prey for larger species including ducks, bearded seals, walrus, and whales (Bluhm et al., 2009; Grebmeier et al., 2006).
While the Beaufort and Chukchi Seas north of the Bering Strait largely support important fisheries for subsistence hunters in coastal communities, the ongoing transformation of these marine ecosystems suggests that commercial operations will eventually respond and push to follow their catch’s migration. The northward migration of commercially important pelagic and ground fish will likely keep pace with the future retreat of the summer sea ice edge, effecting changes to marine management strategies (see Chapter 5). Some commercially fished species traditionally found in the southern Bering Sea, including walleye pollack, Pacific cod, and Bering flounder, are today observed in the Beaufort Sea along with commercially sized snow crabs (Grebmeier, 2012; Rand and Logerwell, 2011). The Distributed Biological Observatory initiated during IPY is being developed across the Pacific Arctic ocean gateway as a new approach to monitor significant range extensions and ecosystem transformation into the near future. This complements other physical and biological observatories in place as part of the new SAON5 across the Arctic basin and marginal seas.
Antarctic Discoveries
Ecosystem change is also apparent across the high latitudes of the Southern Hemisphere and was further documented during IPY. The Southern Ocean Global Ocean Ecosystems Dynamics (SO GLOBEC) program is an international multidisciplinary effort designed to provide understanding of the physical and biological factors that influence growth, reproduction, recruitment, and overwintering survival of Antarctic krill (Euphausia superba), a key species in the Antarctic food web (Hofmann et al., 2011; Figure 3.12). The end-to-end food web approach that included predators and competitors of Antarctic krill, as well as the influence of habitat, makes this program unique and allowed comparative studies across ecosystems in the western Antarctic Peninsula (WAP) region (U.S. program), East Antarctica (Australian program), the Lazarev Sea (German program), and South Georgia (UK program).
The SO GLOBEC program continued through IPY to provide new insights into the functioning of the Antarctic marine food web, especially in the winter. Primary discoveries from this program showed that (1) biological distributions in many regions of the Southern Ocean, particularly the western Antarctic Peninsula region, are structured by hydrography, circulation, and sea ice; (2) Antarctic krill use a range of overwintering strategies; (3) biological hot spots (regions with enhanced predator abundance relative to other areas) exist; (4) distributions of top predators (e.g. fish, penguins, seals, and cetaceans) are correlated with habitat structure and prey availability; and (5) sympatric krill predators (crabeater seals, minke whales, humpback whales) appear to have little niche overlap (Friedlaender et al., 2011). Many SO GLOBEC studies provided the first winter observations of top predator condition, distribution, and habitat use.
The synthesis and integration of the SO GLOBEC data sets focused on comparative studies within and
______________________
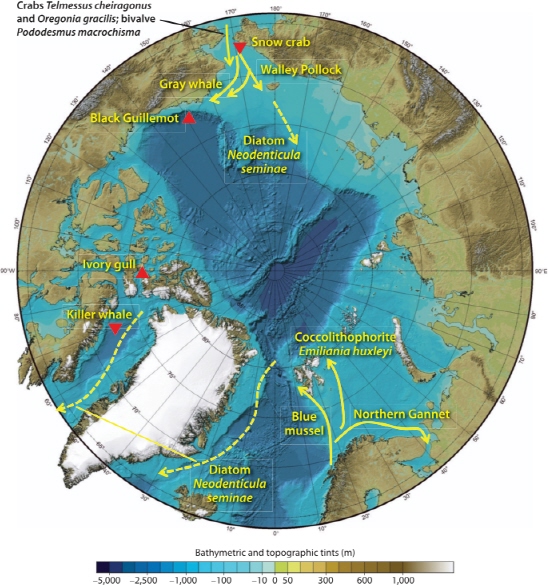
FIGURE 3.11 Map of examples of change in species distributions or population size or sightings that have been attributed to global climate change. Yellow arrows show the general direction of the species range change, but are not meant to suggest exact pathways. Red triangles indicate increases or decreases in population numbers or sightings. SOURCE: Bluhm et al., 2011.
between regions and included a significant modeling component. Circulation modeling studies of Circumpolar Deep Water intrusions onto seas west of the Antarctic Peninsula and in the Ross Sea showed differences in vertical mixing of this water mass that have implications for different basal melting rates of ice shelves and nutrient supply in the two regions (Dinniman et al., 2011). Numerical Lagrangian particle tracking studies showed the importance of the circulation in determining shelf residence times of water and biota, transport pathways, and retention regions, which have implications for connectivity and recruitment of Antarctic krill populations (Piñones et al., 2011; Wiebe et al., 2011). An important contribution from SO GLOBEC
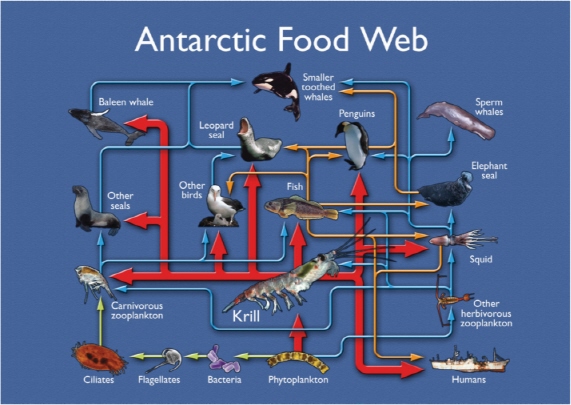
FIGURE 3.12 Antarctic food web showing krill at the center. SOURCE: British Antarctic Survey.
during IPY was demonstrating that data acquired from conductivity-temperature-depth satellite-data relay loggers deployed on crabeater (Lobodon carcinophagus) and southern elephant (Mirounga leonine) seals (Figure 3.13) could be used to study upper ocean properties such as seasonal variability in heat content (Costa et al., 2008), physical profiling and ocean state estimation (Mazloff and Wunsch, 2010), and sea ice production (Meredith et al., 2011). Tagged animals were an integral part of several SO GLOBEC studies.
The Amundsen Sea Embayment Project (ASEP6) has continued since the IPY period as a multidisciplinary effort designed to study the upwelling of relatively warm Circumpolar Deep Water onto the Amundsen Sea continental shelf, how this relates to atmospheric forcing and bottom bathymetry, and how the warm waters interact with both glacial and sea ice. This region of the West Antarctic ice sheet is losing ice faster, perhaps by orders of magnitude, than other Antarctic ice sheet regions, excluding those on the Antarctic peninsula (Pritchard et al., 2009). Thus, continued monitoring of the West Antarctic ice sheet is of crucial importance. As in other parts of the Antarctic, submarine depressions that cross the continental shelf provide conduits for the across-shelf transport of Circumpolar Deep Water to the cavity under the floating extension of the ice shelf (Jacobs et al., 2011). The hydrographic measurements made as part of ASEP during IPY are now being used to provide quantitative estimates of the rate of glacial ice melt by the Circumpolar Deep Water that intrudes across the Amundsen Sea continental shelf. These rates are critical to providing estimates of the potential for sea level rise caused by melting of the West Antarctic ice sheet (Rignot et al., 2011).
______________________
6 http://www.antarctica.ac.uk/staff-profiles/webspace/dutrieux/search/ASEdatabase/.
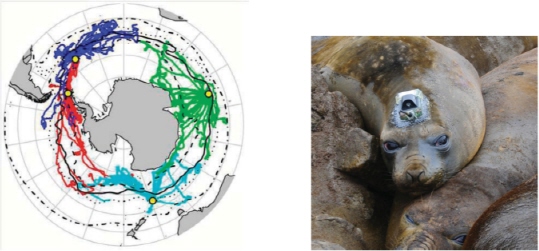
FIGURE 3.13 Southern elephant seal tracks from animal-mounted CTD-SRDL sensors (left) and an elephant seal with a transmitter to collect data on conductivity, temperature, and depth, covering a large geographic area (including areas that would be otherwise difficult to reach) (right). SOURCES: (left) Biuw et al., 2007; (right) D. Costa.
MARINE CARBON CYCLING AND OCEAN ACIDIFICATION
The Arctic marine carbon cycle and exchange of carbon dioxide (CO2) between the ocean and atmosphere appear particularly sensitive to environmental changes, including sea ice loss, warming, changes in seasonal marine phytoplankton primary production, changes in ocean circulation, and freshwater inputs (Bates et al., 2011). Carbon cycling is especially vigorous in the spring when northward retreat of the ice edge results in high productivity within the freshly exposed surface waters (Gradinger, 2009; Lee et al., 2011).
Several IPY studies have shown that the Arctic Ocean is currently a significant sink for atmospheric CO2 (Bates and Mathis, 2009; Bates et al., 2011). In the western Arctic Ocean, high rates of primary production in the Chukchi Sea (Figure 3.14) make the region a strong seasonal ocean sink for CO2 that is partially compensated by outgassing of CO2 from the East Siberian Sea shelf region, where large fluxes of easily altered, terrigenous organic carbon is remineralized in the coastal zone (Mathis et al., 2009). In the near term, further sea ice loss and increases in phytoplankton growth rates are expected to cause a limited net increase in the uptake of CO2 by Arctic surface waters.
Recent studies suggest that this enhanced uptake will be short-lived with surface waters rapidly warming and equilibrating with the atmosphere. Furthermore, release of large stores of carbon from the surrounding Arctic landmasses through rivers into the Arctic Ocean and further warming over the next century may alter the Arctic from a CO2 sink to source over the next century (Holmes et al., 2011). This ambiguity in even the sign of the Arctic’s future role in the carbon cycle underscores the value of IPY research in documenting the present state and providing data to help unravel both the magnitude and the sensitivity of components of the carbon cycle to environmental changes.
Fossil fuel combustion and industrial processes release over 6 billion metric tons of carbon into the atmosphere each year, and CO2 concentrations in the atmosphere are projected to continue to rise (IPCC, 2007a). The consequences of these greenhouse gas emissions are often discussed in terms of rising global temperatures, but global air temperature rise is not the only threat from increased atmospheric concentrations of CO2. The decrease in seawater pH due to the uptake of anthropogenic CO2 has been termed ocean acidification. Ocean acidification, which occurs when CO2 in the atmosphere reacts with water to create carbonic acid, has increased ocean acidity by 30 percent
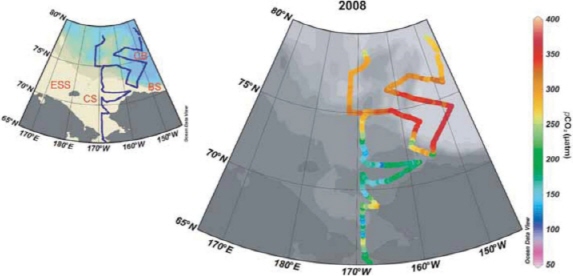
FIGURE 3.14 Surface distributions of seawater partial pressure of CO2 (pCO2 in ìatm) during the summer 2008 China National Arctic Research Expedition (CHINARE). Data were collected using a National Oceanic and Atmospheric Administration Atlantic Oceanographic and Meteorological Laboratory (AOML) underway CO2 system deployed on the icebreaker Xuelong. SOURCE: Bates et al., 2011.
(Doney, 2006). Compared to the mean annual global ocean CO2 uptake of approximately 1400 Tg C per year (Takahashi et al., 2009), the Arctic Ocean CO2 sink potentially contributes 5-14 percent to the global balance of CO2 sinks and sources (Bates and Mathis, 2009); the Southern Ocean uptake of anthropogenic CO2 is large, but storage there is relatively small (Caldeira and Duffy, 2000). Although the chemistry of this effect is well understood and not much debated, the full consequences of ocean acidification for marine ecosystems and human well-being are only beginning to be revealed (NRC, 2010b).
IPY-related research on ocean acidification has brought to light the possibility that polar waters are likely to experience the effects of ocean acidification before most other regions of the world. The uptake of anthropogenic CO2 has already decreased surface water pH by 0.1 units and under current scenarios of possible future human emissions (IPCC, 2007a) a further decrease in seawater pH by 0.3 to 0.5 units over the next century is possible, with the Arctic Ocean likely experiencing these changes on shorter time scales. Various studies have shown that the Southern Ocean may become acidic enough to begin to experience aragonite undersaturation, which would weaken the ability of calcifying organisms to form calcium carbonate shells, within this century (Cao and Caldeira, 2008; McNeil and Matear, 2008).
POLAR ATMOSPHERIC OBSERVATIONS AND LOWER LATITUDE IMPACTS
The intimate connection of the polar regions with the rest of the globe is most evident in the atmosphere, where air from lower latitudes can be transported to the poles in a matter of days. Numerous projects in IPY explored these connections in a variety of ways—in the lower and upper atmosphere; in chemistry, physics, and dynamics; and in the Arctic and the Antarctic regions. IPY research on the atmosphere highlighted how the poles are vulnerable to what happens at low latitudes. For example, agricultural activities and forest fires in Asia and North America largely drive the annual formation of Arctic haze. In addition, pollution transported to the Arctic, such as persistent organic pollutants (POPs), will be deposited there. Similarly, IPY research also highlighted how the rest of the globe is affected by what happens at the poles: for example, as noted above, Arctic circulations can influence weather patterns across the Northern Hemisphere, and the
competing effects of climate change and ozone depletion in the Antarctic stratosphere have altered precipitation and temperature patterns in the Southern Hemisphere. Our understanding of these connections improved during IPY, but there is more to learn, and continued monitoring is necessary to understand how these connections will evolve as climate changes.
Two major objectives of IPY were the establishment of observing networks and increased sharing of data among a number of countries. Projects focused on observations of the polar atmosphere, such as IASOA (International Arctic Systems for Observing the Atmosphere), SPARC-IPY (Stratospheric Processes And their Role in Climate7), SCSCS (Spitsbergen Climate System Current Status), and COMPASS (Comprehensive Meteorological data set of active IPY Antarctic measurement phase for Scientific and applied Studies8) showed that observing common parameters in multiple locations allows for better understanding of processes that affect entire polar region, whether in the Arctic, the Antarctic, or both.
Arctic Highlights
Black carbon has a complex role in the atmosphere. As an air pollutant it has clear negative impacts on human health, but as a climate forcing agent, it has competing effects directly through absorption of radiation, indirectly through cloud formation, and through changes to the albedo of snow and ice when deposited on the surface. The IPY provided an opportunity to characterize sources, sinks, and transport pathways in the Arctic for black carbon and other short-lived species in a way that has never before been achieved. The coordinated international efforts under POLARCAT9created the ability to take a “snapshot” of synoptic measurements in both spring and summer in a truly pan-Arctic capacity. From these observations, scientists were able to (a) identify key source regions for Arctic black carbon; (b) assess the potential for high-latitude ozone chemistry to influence the troposphere at lower latitudes; (c) gain a better understanding of the dynamics of sea ice and the influence on tropospheric concentrations of bromine, ozone, and mercury; and (d) establish the highest possible quality measurements from which to benchmark model simulations, satellite retrievals, and future Arctic characterizations. None of this would have been feasible without the internationally coordinated research investment that IPY provided.
Arctic haze has been known to have much of its origins from Northern Hemisphere anthropogenic pollution, biomass burning, and dust. IPY research has more clearly shown the influence of Northern Hemisphere pollution transport (particularly northeastern Europe and Siberia) on the seasonal background, as well as the episodic transport of specific pollution layers, from a wide variety of Northern Hemisphere locations including events associated with agricultural and forest fires (Brock et al., 2011; Figure 3.15). Thus, the Arctic haze has both chronic and episodic characteristics. This Arctic aerosol loading plays a direct role
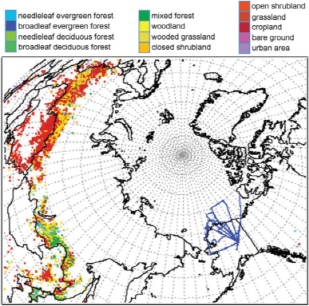
FIGURE 3.15 Arctic haze has been known to have much of its origins from Northern Hemisphere anthropogenic pollution, biomass burning, and dust. During IPY, fires were shown to contribute to Arctic haze more significantly than previously estimated. This map shows fire locations for April 2008 determined from MODIS (NASA/University of Maryland, 2002), color-coded by the underlying vegetation type (Hansen et al., 2000). SOURCE: Brock et al., 2011.
______________________
7http://www.atmosp.physics.utoronto.ca/SPARC-IPY/.
8http://classic.ipy.org/development/eoi/proposal-details.php?id=267.
9http://www.polarcat.no/; the United States played a significant role in this through the ARCTAS (http://www.espo.nasa.gov/arctas/), ISDAC (http://acrf-campaign.arm.gov/isdac/), ARCPAC (http://www.esrl.noaa.gov/csd/arcpac/), and ICEALOT (http://saga. pmel.noaa.gov/Field/icealot/) field projects.
in the Arctic climate system by producing heating aloft in the atmosphere and cooling at the surface.
A significant concern with this increase is that the increased loading of light-absorbing aerosol (black carbon and dust) to the surface could lead to increased melting of snow and ice, exacerbating the effects of warming. However, IPY research shows that the black carbon content of snow in the Arctic has not been increasing in recent decades and therefore cannot be a major contributor to the recent Arctic sea ice loss (Doherty et al., 2010).
New insights were also gained into the behavior of ozone in the Arctic. Ozone depletion events (ODEs) have been observed in the past, where elevated bromine levels in the Arctic boundary layer can drive these ODEs. Elevated bromine monoxide (BrO) “hotspots” were observed by two satellites (OMI and GOME-2) during IPY. Previously it had been thought that the source of this bromine was from the surface, but during IPY these elevated bromine levels were found to be correlated with tropopause depressions, indicating that the source of bromine is from the stratosphere (Jacob et al., 2010; Salawitch et al., 2011). This is a new understanding of ozone loss in the Arctic and generally on the behavior of the Arctic atmosphere.
POLARCAT research at Summit, Greenland, confirmed that active bromine chemistry is occurring in and just above the snowpack despite the great vertical and horizontal separation from strong sources of bromide. Activation of the trace amounts of bromide in the snow on top of the Greenland ice sheet is able to support vigorous bromine chemistry that was shown to perturb the cycling of hydroxyl, nitrogen oxides, and mercury. This research also included development of the first one-dimensional coupled air/snow chemistry model able to simulate observed variations of BrO and NO above the snow based on production and release within the surface layers of the snowpack (see Brooks et al., 2011; Dibb et al., 2010; Liao et al., 2011; Stutz et al., 2011; Thomas et al., 2011).
The Northern Hemisphere winters of IPY corresponded to years where there were major disturbances of the Arctic polar vortex (mentioned above). In both winters, large planetary waves broke in the stratosphere and disrupted the circulation. These waves caused major displacement of the vortex in 2007-2008 and caused a splitting of the vortex in 2008-2009. These disruptions are of interest for two distinct reasons: (1) the disruption of the vortex mixes cold vortex air with warmer air from lower latitudes, which impedes polar stratospheric cloud formation and thus causes less ozone depletion; and (2) the larger disruption of the circulation acts as a natural laboratory for understanding how large-scale and small-scale waves impact the general circulation. IPY research involving networks of lidar observations characterized these behaviors across the Arctic (Farahani et al., 2009; Thurairajah et al., 2010), where small-scale waves were more severely impacted during the winters with the larger disturbance (2008-2009). The observations provide a benchmark for model studies of how wave-driven variability impacts the general circulation.
Antarctic Highlights
The Antarctic ozone hole and global air temperature rise both affect Southern Hemisphere circulation. Climate model integrations of the 20th century including ozone-only forcing show diminished sea ice and a warming of the Southern Ocean surface air temperatures (Sigmond et al., 2011). It also appears clear from these modeling studies as well as the work of Arblaster et al. (2011) that the important issue here is the dynamic response to the ozone-induced cooling and the associated surface climate response to the circulation change. Current studies do not provide a ready explanation for the observed expansion of sea ice extent in the eastern portions of the Southern Ocean (Thompson et al., 2011). Over the past several decades, the ozone hole has shifted the extratropical westerly jet poleward, which has resulted in increased precipitation in the Southern Hemisphere subtropics (Kang et al., 2011; Figure 3.16). The relative contribution of ozone depletion and greenhouse gas warming will change as the ozone hole recovers and climate change intensifies, so continual monitoring will be needed to understand how these separate influences evolve and their net effect on Southern Hemisphere circulation in the coming years.
Closer to the surface, as mentioned above, warming has been observed over the Antarctic Peninsula, but observations of temperature are still relatively sparse over much of the Antarctic continent. Recent analyses during the IPY time frame suggest that this warming
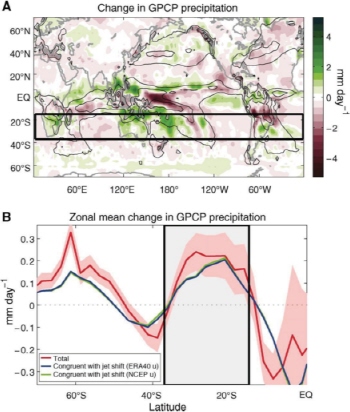
FIGURE 3.16 The polar regions have an important role to play in the subtropical hydrological cycle. A poleward shift in the extratropical westerly jet caused by the Antarctic ozone hole has led to precipitation changes in the Southern Hemisphere subtropics. (A) Precipitation change based on GPCP data, calculated from the linear trend multiplied by 22 years. Black contours show the mean precipitation for 1979-1983, with contour interval of 3 mm day-1. The area within the black box exhibits a moistening trend during the period of ozone depletion between 1979 and 2000 in austral summer (December to February mean). (B) This result can also be seen in the zonal-mean. The precipitation change is indicated by the red line with 95 percent confidence interval (red shading), and the change congruent with a change in the latitude of the westerly jet obtained from ERA40 (blue line) and NCEP/NCAR (green line) reanalysis data. SOURCE: Kang et al., 2011.
may be more widespread than just the peninsula (Steig et al., 2009).
GEOSPACE AND SPACE WEATHER HIGHLIGHTS
The decades since the advent of spaceflight have witnessed the increasing importance and relevance of the Earth’s space environment—geospace (or near-Earth space including the upper regions of the atmosphere, magnetosphere, and ionosphere). This region plays host to the myriad processes that are largely driven by solar forcing and that involve complex interactions with the Earth’s magnetic field, which are collectively referred to as space weather. For example, in the polar regions the solar wind energy is transferred into disturbances in the Earth’s magnetosphere and ionosphere that can affect and even disrupt technologies in space and on the surface, affecting communications for polar-route aircraft and exposing passengers and crew to high levels of particulate radiation at airline altitudes.
The science of space plasma physics has matured to the level of being able to both describe and predict many of the interactions in geospace. An overarching goal of IPY was to fold current understanding into a more comprehensive computational framework that could be used to analyze and predict the properties of this system. To realize such a goal, coordinated groundand space-based measurements were necessary both to resolve outstanding problems and to provide key data assimilation parameters. During the IPY time frame, many countries, including the United States, invested in autonomous observatory ground-based infrastructure that substantially increased the number of geospace observations in Antarctica (Mende et al., 2009; Musko et al., 2009; Figure 3.17). IPY thus allowed more comprehensive synoptic measurements of the geospace environment. The modulation of the magnetosphere’s open-closed boundary (OCB) during periods of high-speed solar streams was inferred from fluxgate magnetometer instrumentation covering a wide range of high-latitude geomagnetic latitudes and longitudes across Antarctica (Urban et al., 2011). Researchers also demonstrated how the OCB can be deduced in real time from synoptic data sets, predicting
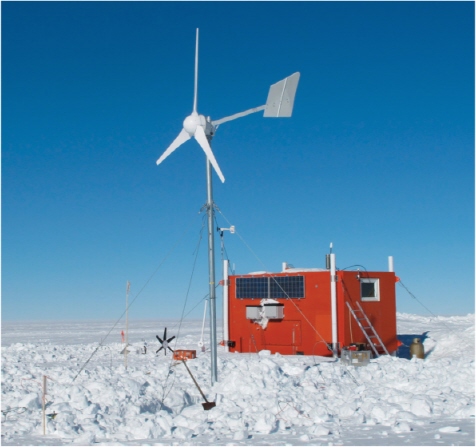
FIGURE 3.17 During IPY, geospace observation stations, like the one pictured here in Antarctica, substantially increased the amount of data collected. SOURCE: A. Stillinger.
intense radiation patches and high-frequency radio communications disruptions.
During IPY, scientists also conducted studies revealing new information about the linkage between solar activity and temperatures in polar regions. The study by Seppälä et al. (2009) revealed that surface temperatures in certain high-latitude regions varied by ~4-5 degrees during enhanced geomagnetic activity as compared to temperatures measured during quiet geomagnetic conditions. Although the authors could not conclusively show that the polar surface air temperature patterns are physically linked by geomagnetic activity, they did demonstrate that geomagnetic activity likely plays a role in modulating wintertime surface air temperatures.
Images of the aurora taken simultaneously in the Northern and the Southern Hemispheres during IPY revealed indisputable evidence that the auroras in the two hemispheres can be totally asymmetric (Laundal and Østgaard, 2009; Figure 3.18). Before this study was published, it was commonly assumed that the aurora borealis (Northern Hemisphere) and aurora australis (Southern Hemisphere) were approximately mirror images of each other because the charged particles producing the aurora follow magnetic field lines connecting the two hemispheres, and the particles were believed to be evenly distributed between the two hemispheres, from the major source region in the equatorial plane of the magnetosphere. The asymmetry is interpreted in terms of interhemispheric electrical currents related to differing seasons, which had been predicted but hitherto had not been seen.
TERRESTRIAL EARTH SYSTEMS AND PERMAFROST
Current warming of the planet is contributing to changes in terrestrial environments that have large impacts on society. Vivid images leading into the IPY years depicted villages in Alaska falling into the sea due to coastal erosion, broken pipelines, and crumbling runways resulting from the thaw of permafrost (ACIA, 2005). These images at the time conveyed that climate change may be only impacting Arctic infrastructure and Arctic people. Yet during the IPY years the world came
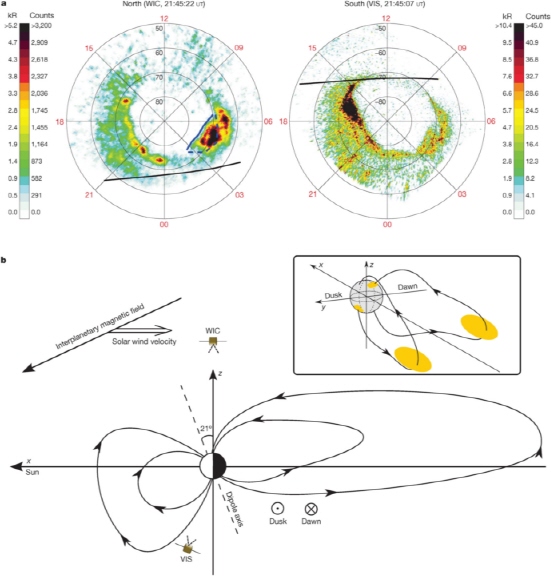
FIGURE 3.18 Simultaneous ultraviolet auroras were observed in both hemispheres during IPY. The images from the Northern and Southern hemispheres reveal that the auroras in these two areas can be totally asymmetric. In fact, Laundal and Østgaard (2009) show that simultaneous images of the aurora on May 12, 2001, have completely different intensity distributions (a). The color bars show intensity in both counts and kilo-Rayleigh (kR). A conceptual presentation shows the seasonal conditions and geometry of the magnetosphere, and the orientation of the interplanetary magnetic field, measured by ACE (b). The interplanetary magnetic field moves with the solar wind velocity. The asymmetry is interpreted in terms of interhemispheric electrical currents related to differing seasons, a result that had only been predicted (not observed) prior to this study. The inset illustrates that the spots at northern dawn and southern dusk originate from completely different regions in the magnetosphere. SOURCE: Laundal and Østgaard, 2009.
to understand that warming impacts on permafrost also contribute to climate change globally, through feedbacks that affect the complex linkages and feedbacks between atmospheric, oceanic, and terrestrial systems.
Permafrost is soil and other subsurface materials that remain frozen year after year. It is widespread in the high-latitude regions (Figure 3.19). During IPY, nearly 350 new borehole observatories were drilled and instrumented in permafrost globally. This expanded the global network of permafrost observatories coordinated through the International Permafrost Association (Brown and Romanovsky, 2008) for continued observation and monitoring that will yield ongoing evidence for terrestrial-atmospheric climate feedbacks. These coordinated measurements demonstrate that permafrost is warming or thawing nearly everywhere throughout the circumpolar north (Figure 3.20).
Warming near-surface permafrost temperatures were observed in IPY, including observations reported for Svalbard (Isaksen et al., 2007) in the Atlantic sector of the Arctic Ocean north of Europe. The mean warming of 1-2°C over the last six to eight decades has been accelerating since 1999 at the rate of 0.6-0.7°C/decade. Air temperatures running 4-9°C above the 1961-1990 average were observed during the winter of 2005-2006 prior to IPY.
During IPY, the Carbon Pools in Permafrost Regions initiative gave rise to increased research on and increased public awareness of carbon reservoirs that have remained locked in permafrost during repeated cycles of glacial and interglacial change over the past few million years. It is now realized that the total below ground carbon pool in permafrost regions (~1,672 Pg C) is more than double the atmospheric carbon pool (~750
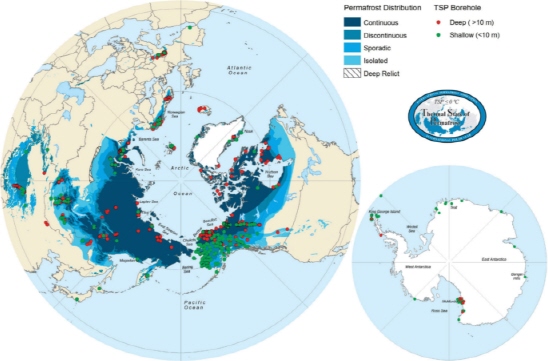
FIGURE 3.19 A large portion of the Arctic is underlain by permafrost (soil and other subsurface materials that remain frozen year after year). During IPY, nearly 350 new borehole observatories were drilled and instrumented in permafrost globally. On this map, the red and green symbols indicate borehole locations, darker shades indicate larger percentages of permanently frozen ground, and lighter shades (as well as the terms isolated and sporadic) refer to lower percentages of frozen ground. SOURCE: International Permafrost Association Standing Committee on Data Information and Communication, 2010.
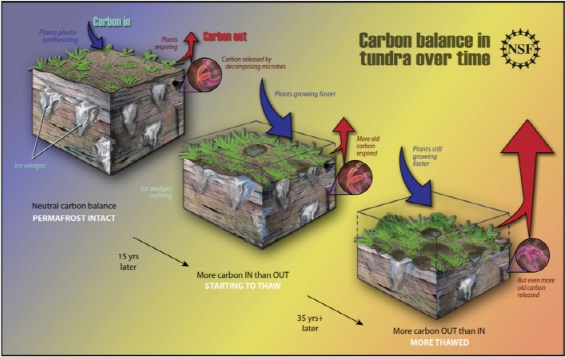
FIGURE 3.20 Scientists have demonstrated that, as permafrost begins to thaw, the amount of carbon removed from the atmosphere increases due to plant growth. As the permafrost continues to melt over time, however, the amount of carbon that is released increases and eventually overtakes the amount of carbon that plants remove. This process can contribute significant amounts of carbon to the atmosphere. SOURCE: Zina Deretsky, National Science Foundation.
Pg C), and three times larger than the total global forest biomass (~450 Pg C) (Tarnocai et al., 2009). Evidence is now emerging that deep-soil organic matter otherwise locked in permafrost in Alaska and northern Sweden is starting to be released (Dorrepaal et al., 2009; Schuur et al., 2009). Recent decades of greenhouse gas warming are causing the release of terrestrial-based carbon from permafrost areas at a rate that is abrupt compared to the glacial time scales involved in the creation of these terrestrial carbon reservoirs. Throughout human history, the land has been a weak source of carbon to the atmosphere while the ocean has been a sink accounting for 5-15 percent of the global carbon dioxide (CO2) uptake from the atmosphere. Now, the potentially large positive climate feedback of additional carbon release to the atmosphere from thawing permafrost will change this longstanding balance and may overwhelm the ability of the ocean and other biomes to draw down atmospheric carbon, thereby contributing to even greater warming.
The Thermal State of Permafrost program yielded results that exemplify large differences in the existence and state of permafrost between sites that vary from continental to marine and from sea level to mountains (Christiansen et al., 2010; Romanovsky et al., 2010; Smith et al., 2010). The spatial variability and complexity of processes in permafrost point to the need for sustained observations and monitoring (Grosse et al., 2011; Jorgenson et al., 2010). Changes in permafrost have resulted in changes in hydrology, including expansion of some lakes (Parsekian et al., 2011) and shrinking of others (Roach et al., 2011). Lakes on the Seward Peninsula, Alaska, appear to be expanding as permafrost near boundaries degrades and subsides. Some lakes in the Yukon Watershed, Alaska, are shrinking as underlying permafrost thaws, allowing perched water to infiltrate to sublake groundwater.
Permafrost thaw is starting to have dramatic impacts on polar hydrologic systems, ecosystems, and
the climate system. The Arctic terrestrial freshwater system is projected to transition from a surface waterdominated system to a groundwater-dominated system in the coming decades (Frey and McClelland, 2009). Consequent impacts from the changing hydrology and terrestrial ecosystems are changes to the aquatic ecosystem and biogeochemistry, including shifts in riverine concentrations of dissolved organic carbon (DOC), inorganic nutrients, cations, phosphate, and silicate. New satellite-based algorithms to map DOC and colored dissolved organic matter in the Kolyma River have improved understanding of the complexity of carbon delivery to the Arctic Ocean with strong mixing zones and downstream loading of carbon. These satellite observations may suggest that our current point-based estimates of carbon delivery to the Arctic Ocean may in fact be conservative (Griffin et al., 2011). This will have important effects on primary production and carbon cycling on polar shelves and oceans discussed earlier.
A synthesis of analyses on climate and hydrological processes in the Arctic reveal evidence that the Arctic hydrologic cycle is experiencing intensification (Rawlins et al., 2010). River discharge, precipitation, and evapotranspiration from both field measurements and GCM analyses exhibit positive trends, although significant positive trends above the 90 percent confidence level were not present for all data sets. Confidence in the trend of ocean flux rates is less certain because there are fewer long-term observations; however, ocean salinity and volume flux data suggest a decrease in freshwater outflow in recent decades. A decline in freshwater storage across the central Arctic Ocean and recognition that circulation through the Arctic Basin controls freshwater dynamics raises questions as to whether Arctic Ocean freshwater flows are intensifying. Although oceanic fluxes of freshwater are highly variable and consistent trends are difficult to verify, other processes in the Arctic freshwater cycle display positive trends over recent decades. These increases provide evidence that the Arctic hydrologic cycle is accelerating and inform us of the systemic links in terrestrial, marine, and atmospheric systems.
Warming of the planet creates regionally specific environmental changes. In years leading up to IPY, large changes in sea ice concentrations and thawing of permafrost in some Arctic coastal communities had been observed, but less attention had been focused on land-based ecosystems. Using data gathered by the Greening of the Arctic: Circumpolar Biomass IPY program, however, Bhatt et al. (2010) showed that land warming, sea ice decline, and greening of the Arctic are systemically linked. Summer sea ice concentrations have declined and summer land temperatures have increased in all Arctic coastal areas examined. Changes in the Maximum Normalized Difference Vegetation Index (MaxNDVI) correlate both to changes in early summer coastal sea ice concentrations and summer land temperatures (Figure 3.21). In tundra regions, the annual maximum NDVI (MaxNDVI) usually occurs in early August and is correlated with aboveground biomass, gross ecosystem production, CO2 fluxes, and numerous other biophysical properties of tundra vegetation. The data show that MaxNDVI has increased during the period of satellite observations (1982-2010) in Eurasia and North America (Dinniman et al., 2011), supporting model predictions that primary production of Arctic tundra ecosystems will respond positively to increased summer warmth (Bhatt et al., 2010; Lawrence et al., 2008).
Changes in temperature and vegetation, in turn, affect other ecosystems, including insects, birds, and animals. A 30-year observation of black guillemot bird colonies on an Arctic barrier island became witness to climate change impacts. The black guillemot, a diving seabird, has experienced major decreases in breeding success in arctic Alaska in the last decade due to the rapid and extensive retreat of summer sea ice. Formerly dependent on Arctic cod, the primary forage fish associated with arctic sea ice; guillemots now feed their nestlings lower quality and less abundant bottomdwelling prey, resulting in lower breeding success and chick growth rates. Summer ice retreat has also shifted the range of the horned puffin, a nest competitor, and the polar bear, a nestling predator, further increasing guillemot nestling mortality (Moline et al., 2008; Smith et al., 2010). Changing habitat through loss of sea ice is threatening populations of polar bears in some locations who now must live more generally onshore during the summer and as a result are beginning to mate with grizzly bears (Kelly et al., 2010). Not all impacts to the ecosystem from climate change will necessarily be negative; for example, upper trophic levels may benefit and some organisms may experience extended ranges.
In Alaska’s boreal forests, recent warming has been accompanied by reduced growth of formerly dominant
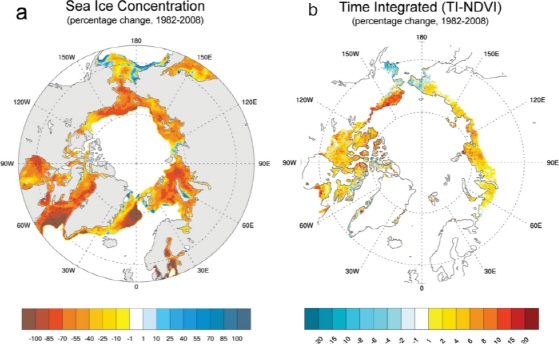
FIGURE 3.21 Percentage change in the Arctic from 1982 to 2008 (change in the 27-year trend expressed as a percent of the 1982 value) for (a) sea ice concentration at the 50 percent climatological value and (b) time-integrated Normalized Difference Vegetation Index (NDVI), showing that changes in the Arctic tundra have been correlated with increased temperatures in the Arctic Ocean. The data show that MaxNDVI has increased during the period of satellite observations (1982-2010) in Eurasia and North America (Dinniman et al., 2011), supporting model predictions that primary production of Arctic tundra ecosystems will respond positively to increased summer warmth. SOURCE: Copyright 2010 American Meteorological Society (AMS). Bhatt et al., 2010.
tree species (Calef, 2010; Juday et al., 2003), plant disease and insect outbreaks (IASC, 2011); drying of lakes (Roach et al., 2011); increased wildfire frequency, extent, and severity (Mack et al., 2011; Turetsky et al., 2010); and reduced safety of hunters traveling on river ice (Chapin and Lovecraft, 2011). In studies of the resilience of Alaska’s boreal forest, Chapin et al. (2010) found that with continued warming, Alaska’s boreal forest will undergo significant functional and structural changes within the next few decades that are unprecedented in the last 6,000 years. To look back over these time scales, one needs the perspective of paleoclimate studies.
EVIDENCE OF PAST CLIMATE CHANGE OVER GEOLOGIC TIME SCALES
Knowledge of the past provides a context for the present. The precipitous minimum in Arctic summer sea ice extent in 2007 (Stroeve et al., 2007) gave global attention to the anomalous decline in sea ice since modern observations began, but it can only be understood fully when comparisons are made with data from long-term observations, or paleoclimate data. IPY provided a platform for a large number of national and international programs to exploit the essential temporal perspective provided by studies of past climate change at both poles.
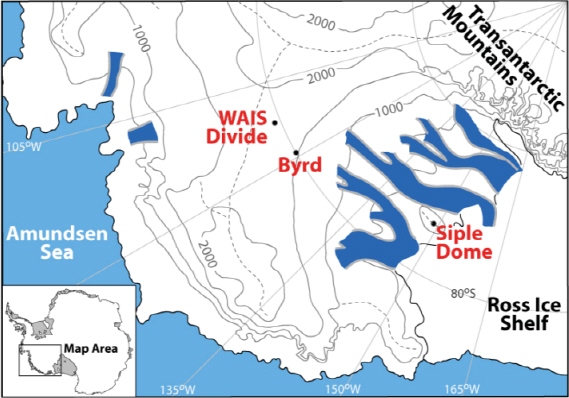
FIGURE 3.22 Location of the WAIS Divide Ice Core, which will be drilled at a cold, high-accumulation location on the West Antarctic ice sheet. The blue areas indicate fast-moving outlet glaciers and ice streams. SOURCE: Howard Conway, University of Washington.
Ice Core Research
Ice core research was already under way during IGY (Langway, 2008), and it continued in this IPY to provide some of the most robust data concerning the climate history of our planet and of the sensitivity of the polar regions to warming (Alley et al., 2010). Drilling of the WAIS Divide (Figure 3.22) deep ice core in central West Antarctica began during IPY. Among other contributions, this core is poised to improve our understanding of rapid climate change events during the past glacial cycle, including impact of greenhouse gases. The recovery of a new 100,000-year-long ice core record from one of the most vulnerable portions of the Antarctic continent is producing the first Southern Hemisphere climate and greenhouse gas record with the same time resolution and duration as the ice core records from the Greenland ice sheet.
Early findings include the demonstration of how changes in tropical weather conditions in the tropics propagate into the Antarctic, highlighting the tight but distant linkages between currently occurring changes in climate (Ding et al., 2011). Steig et al. (2009) compiled up-to-date satellite observations and in-situ weather station data and found that most of West Antarctica has been warming significantly, particularly in winter and spring, since at least the 1950s (Vaughan et al., 2003). Two other recent studies also agree that the WAIS Divide site has been warming significantly (O’Donnell et al., 2010; Schneider et al., 2011). Preliminary borehole thermometry work10 confirms this independently. Analysis of global sea surface temperature data and atmospheric reanalysis data products has shown that the
______________________
10 Anais Orsi and Jeffrey Severinghaus, Scripps Institution of Oceanography, personal communications, 2011.
warming at WAIS Divide is a response to warmer sea surface temperatures in the central tropical Pacific Ocean, primarily associated with several large El Niño events in the 1990s (Ding et al., 2011; Schneider et al., 2011). The atmospheric circulation changes associated with these events appear to have been responsible for the significant increase in the inflow of warm circumpolar deep water onto the Antarctic continental shelf, resulting in increased thinning of ice shelves in the Amundsen Sea sector (Steig et al., 2011).
The IPY NEEM (North Greenland Eemian Ice Drilling) international ice core project (Figure 3.23) on Greenland (77.45°N 51.06°W), also drilled during IPY, had the ultimate goal of recovering a continuous ice record representing the last interglacial: the late Pleistocene Eemian period from 131,000 to 114,000 years ago. The purpose of this program was to better define the extent to which the Greenland ice sheet melted during this period. Greenland temperatures are thought to have been about 3-5°C warmer than present during the Eemian due to differences in the shape of Earth’s orbit around the sun, making the Eemian time period a useful analogue for future climate warming caused by anthropogenic increases in CO2 (Alley et al., 2010; Miller et al., 2010b; Otto-Bliesner et al., 2006). Moreover, this melt history is being used to evaluate
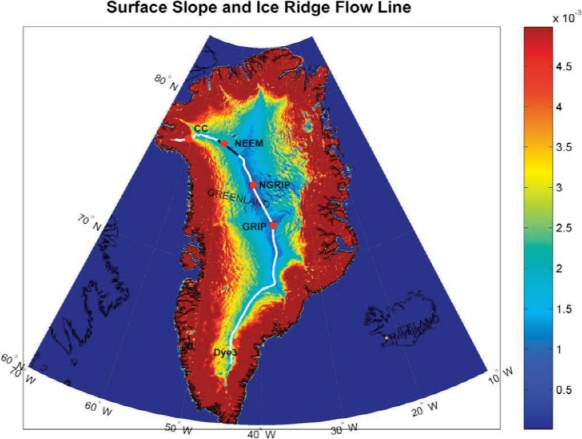
FIGURE 3.23 During IPY, the NEEM (North Greenland Eemian Ice Drilling) project had the goal of recovering a continuous ice record representing the last interglacial. Studying the amount of melt that occurred on the Greenland ice sheet during this period can help advance modeling efforts and enable scientists to understand future climate warming caused by anthropogenic increases in CO2. This map shows the NGRIP (North Greenland Ice Core Project) and NEEM field camps in Greenland. The white and blue line connecting the two sites shows the approximate route followed by both the surface traverse and airborne survey in 2007. SOURCE: NEEM.
rapid climate change events in modeling efforts to better define the extent to which future anthropogenic CO2 emissions will cause and/or accelerate loss of portions of the Greenland ice sheet (see Steffensen et al., 2008).
Sediment Core Research
The new IPY ice cores are ideal for understanding high-resolution, rapid climate variability through the last glacial-interglacial cycle and their relationships with greenhouse gases. Sediment core records from the high latitudes obtained via deep geologic drilling during IPY, including the Antarctic Drilling Program (ANDRILL) and the International Continental Drilling Program (ICDP) Lake El’gygytgyn Project (Arctic Beringia), also provide extraordinary insights into older events in the complex climate evolution of the Arctic and Antarctic regions.
During the austral spring and summer of 2006-2007, ANDRILL recovered a 1,285-m-long sedimentary and rock core record of climate and ice sheet variability spanning the last 13 million years from beneath the McMurdo Ice Shelf (see also “Paleoclimate Tools” section in Chapter 4). The data included several climate cycles during the early Pliocene; this was a time when temperatures were ~3°C warmer than today and atmospheric CO2 levels may have reached 400 ppm. The data imply a significant change in thermal regime of WAIS during the late Pliocene, coincident with global cooling in oxygen isotope records and the onset of Northern Hemisphere glaciations (Naish et al., 2009). Equally significant were innovative new approaches in numerical modeling that led to accurate simulations of marine-based ice sheet dynamics (Pollard and DeConto, 2009; Figure 3.24). These studies provided robust data/model validations for past fluctuations of the WAIS, including its total disappearance during the early Pliocene and during “super-interglacial” warmth of Marine Isotope Stage 31 (about 1.1 million years ago [Ma]; Scherer et al., 2008). Probably one of the most extraordinary outcomes of this ANDRILL research is that it demonstrated, for the first time, instability in the West Antarctic ice sheet, revealing Antarctica’s vulnerability to oceanographic warming and changes in atmospheric CO2, with dramatic consequences for future changes in global sea level. This important outcome was not revealed in earlier work (e.g., Denton et al., 1993; Marchant et al., 1993). Reconstructions of Antarctic paleogeography (Wilson and Luyendyk, 2009) have been critical for producing a better match between geologic data and modeled ice sheet response, suggesting possible locations of elevated topography for the initial buildup of ice on Antarctica as early as 34 Ma that were missing in earlier reconstructions.
FIGURE 3.24 Sediment core records from the ANDRILL Program during IPY provide valuable information on climate evolution in the polar regions. For example, ANDRILL core records recovered from beneath the McMurdo Ice Shelf revealed data on climate cycles during the Pliocene. This ANDRILL model figure demonstrates past fluctuations and shows the loss of the WAIS repeatedly in Pliocene. Data from the cores and new approaches in numerical modeling of marine-based ice sheet dynamics can help us understand future changes in global sea level. SOURCE: Pollard and DeConto, 2009.
During the austral spring of 2007-2008, ANDRILL’s 1,138-m-long sedimentary core from the southern McMurdo Sound contained a nearcontinuous coastal record of Antarctic climate and ice sheet variability, including an interval of sustained global warmth known as the Mid-Miocene Climatic Optimum. In contrast to the dramatic shifts between glacial-interglacial end member climate states evident in Pliocene-Pleistocene and Oligocene drill cores on the same coastal margin, the early Miocene paleoclimatic fluctuations were subtler under warmer, more equable
climate conditions (Harwood et al., 2009). Fossils preserved in these strata suggest marine climate conditions similar to that of southern Patagonia and southwestern New Zealand today, influenced by high sediment discharge from river runoff, and high coastal turbidity, implying surface air temperatures warm enough for significant ice surface melt and the transfer of moisture from the ocean onto the land and ice surface.
Comparable lengthy records of the Late Cenozoic history of the Arctic are poorly known. To partially fill this gap, during the boreal winter of 2008-2009, the science community successfully recovered a 3.6-millionyear-long sediment record from Lake El’gygytgyn (“Lake E”), which is a 12-km-diameter meteor crater lake located 100 km north of the Arctic Circle in northeastern Russia (see also “Paleoclimate Tools” section in Chapter 4). The record captures for the first time the rhythm of orbitally forced climate in the Arctic.
The Arctic climate was dominated by 41,000-year climate cycles up until about 1 million years before the present; since about 900,000 years ago, the Arctic has been dominated by climate cycles of 100,000 years, but with cycles of 21,000-23,000 years that persist in the precession band.
The Quaternary section of the Lake E sediment core includes a complete record of glacial-interglacial change, including warm intervals correlative with well-known marine isotopic stages. The extent to which many of these interglacials, including marine isotopic stages (MIS) 9, 11, and 31 and others, appear to have been warmer than MIS 5e (Lozhkin and Anderson, 2011), is an extraordinary surprise because it suggests repeated intervals in the past when the Greenland ice sheet may have been much smaller than today and sea ice vastly reduced (Melles et al., 2011). These new data contribute to numerical modeling
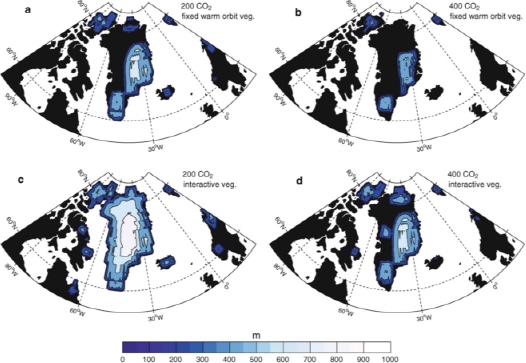
FIGURE 3.25 Simulation of inception of ice sheets on ice-free isostatically rebounded Greenland as simulated by the 3-D dynamical ice sheet model and forced by the sensitivity scenarios. Ice sheet thicknesses (m) are shown after 11,000 years for Pleistocene 200 ppmv pCO2 (left panels) and Pliocene 400 ppmv pCO2 (right panels) scenarios. (a, b) Cold orbit, fixed warm orbit vegetation; (c, d) cold orbit, interactive vegetation. SOURCE: Koenig et al., 2011.
efforts that test the vulnerability of Arctic sea ice and the Greenland ice sheet to global air temperature rise (Koenig et al., 2011; Figure 3.25). Extreme warmth at 1.1 million years ago during Marine isotope stage 31 is especially interesting because this interval coincides by half a precession cycle with the last time ANDRILL chronicles the collapse of the WAIS and the Ross Ice Shelf (Naish et al., 2009). The climate record from Lake E, especially the history of past interglacials, provides a means of testing what controls polar amplification over time using data/model comparisons.
Paleoclimate Synthesis During IPY
For its part, the U.S. Climate Change Science Program commissioned a synthesis of paleoclimate data from the Arctic as one of many scientific synthesis reports intended to inform public debates on modern climate change (Fitzpatrick et al., 2010). The original report (CCSP, 2009) highlighted the record of climate change in the Arctic over the past 3-4 million years, ![]() in the context of a global system. This synthesis acknowledged that the anomalous loss of summer sea ice in 2007 is dramatic compared to recent glacial-interglacial cycles of natural variability but not unprecedented for warmer interglacial stages in the past (Polyak et al., 2010). At the same time, changes in the size of the Greenland ice sheet over its history have been primarily controlled by temperature, with warming in the past always causing considerable ice sheet shrinkage contributing to sea level rise (Alley et al., 2010). Arctic amplification, as a process in modern records of global climate change is now known to be a persistent feature of past climates, typically falling in the range of 3-4°C over global mean temperatures (Miller et al., 2010a; Figure 3.26). Paleoclimate ice core records show that once thresholds in the system are passed, global climate change can be larger and faster than models used now for predictions of future change might predict (White et al., 2010).
in the context of a global system. This synthesis acknowledged that the anomalous loss of summer sea ice in 2007 is dramatic compared to recent glacial-interglacial cycles of natural variability but not unprecedented for warmer interglacial stages in the past (Polyak et al., 2010). At the same time, changes in the size of the Greenland ice sheet over its history have been primarily controlled by temperature, with warming in the past always causing considerable ice sheet shrinkage contributing to sea level rise (Alley et al., 2010). Arctic amplification, as a process in modern records of global climate change is now known to be a persistent feature of past climates, typically falling in the range of 3-4°C over global mean temperatures (Miller et al., 2010a; Figure 3.26). Paleoclimate ice core records show that once thresholds in the system are passed, global climate change can be larger and faster than models used now for predictions of future change might predict (White et al., 2010).
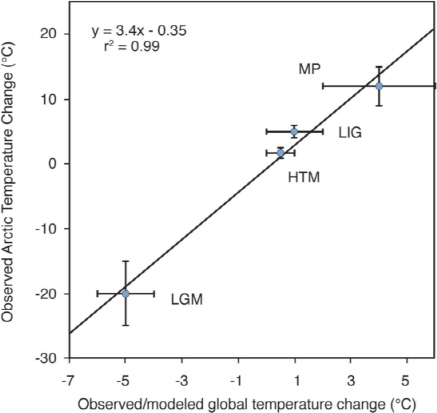
FIGURE 3.26 Paleoclimate data quantify the magnitude of Arctic amplification. Shown are paleoclimate estimates of Arctic summer temperature anomalies relative to recent, and the appropriate Northern Hemisphere or global summer temperature anomalies, together with their uncertainties, for the following: the last glacial maximum (LGM; ~20 ka), Holocene thermal maximum (HTM; ~8 ka), last interglaciation (LIG; 130 to 125 ka) and middle Pliocene (~3.5 Ma). The trend line suggests shows that summer temperature changes are amplified 3 to 4 times in the Arctic. SOURCE: Miller et al., 2010a; White et al., 2010.
During IPY, multiple paleoclimate studies were carried out, aimed at characterizing natural climate variability, especially warm climate variability, and the system processes that drive variability on annual to millennial time scales. A community compilation of lake sediment sequences, ice cores, and tree ring records from the circumarctic region (Figure 3.27) confirmed
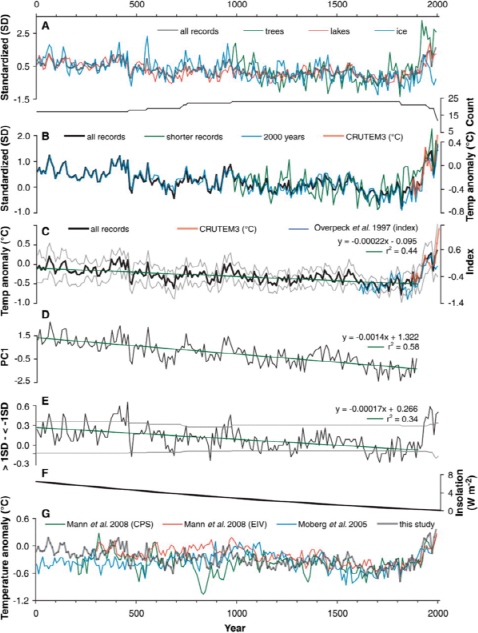
FIGURE 3.27 This community compilation of lake sediment sequences, ice cores, and tree ring records from the circumarctic region confirmed that the natural cooling trend of the last 2,000 years has been completely reversed by contemporary warming, with the last five decades being the warmest over the length of record. (A and B) Kaufman et al. (2009) show a composite of 23 high-resolution proxy climate records from the Arctic. (C) Mean of all records transformed to summer temperature anomaly relative to the 1961-1990 reference period, with first-order linear trend for all records through 1900 (green line), the 400-year-long Arctic-wide temperature index of Overpeck et al. (1997) (blue curve; 10-year means), and the 10-year-mean Arctic temperature through 2008 (red line). (D) Time series of PC1 based on the 15 records that extend from 1 C.E. to 1900 C.E., showing a strong first-order trend. (E) Difference in the fractional proportion of records that exceed ±1 SD for each 10-year interval. (F) Change in summer (JJA) insolation at 65°N latitude relative to the 20th century (Berger and Loutre, 1991). (G) Northern Hemisphere average proxy temperature anomalies (10-year means) reconstructed by Mann et al. (2008) on the basis of two approaches and by Moberg et al. (2008). The Arctic regional reconstruction is overlaid in gray. SOURCE: Kaufman et al., 2009.
that the natural cooling trend of the last 2,000 years has been completely reversed by contemporary warming, with the last five decades being the warmest over the length of record (Kaufman et al., 2009). Because the climate has shown a normal response to natural forcings over the last two millennia, the only recent forcing capable of causing this reversal is the dramatic input of anthropogenic carbon dioxide to the atmosphere. This clear attribution for anthropogenic forcing of current climate change came not only from a synthesis of the geologic and glaciological record, but also from the modeling community (Miller et al., 2010a; Serreze and Barry, 2011), as well as from the space physics community, who used satellite observations to show that energy from the sun was a minor impact in climate change (Scafetta and West, 2005).
Paleoclimate data also provide independent evidence for comparison and calibration of climate model simulations of past change. For example, the last time Arctic summer sea ice extent was vastly reduced was 6,000-8,500 years ago, when solar insolation was about 7 percent higher than today because Earth’s orbit reached perihelion in northern hemisphere summers (Funder et al., 2011). Sea ice was also vastly reduced 125,000 years ago, when solar insolation was 11 percent more than now. But in both cases, atmospheric CO2 levels were only 270-280 ppm (Miller et al., 2010a; Polyak et al., 2010). Assessments of the rate of climate change in the past show that climate responses can be rapid with diminishing sea ice first being a feedback (i.e., in this case through changes in albedo as ice transitions to open water) and eventually becoming a forcing (i.e., a primary driver of climate change) with delayed release of heat from areas ice free in summer (Serreze and Barry, 2011; White et al., 2010). Environmental change, which occurred on longer time scales in the past, is now happening faster than models predict. This is a major emerging theme of IPY 2007-2008.
Improved understanding of teleconnections between the Arctic and Antarctic and mid- to lowerlatitude climate regimes are emerging from IPY paleoclimate studies. As is observed today, when CO2 increased in the past, the global system warmed up with an amplified response across the polar regions, especially the Arctic. Changes in sea ice and the extent of ice sheets create feedbacks in the climate system with implications for regional change and sea level fluctuations around the world. While long-term models tend to underestimate polar amplification, projections from these paleoclimatic analogs point to the possibility that human influence will become unprecedented in combined speed and persistence (White et al., 2010).
ARCTIC SOCIETIES AND SOCIAL PROCESSES
The IPY planners made a radical departure from the earlier IPY/IGY template by creating a special “People” field and by introducing the social sciences and humanities, as well as the studies of human health to the IPY program:
• Research Theme #6: To investigate the cultural, historical, and social processes that shape the sustainability of circumpolar human societies, and to identify their unique contributions to global cultural diversity and citizenship (Rapley and Bell, 2004).
• Observational Strategy #6: To investigate crucial facets of the human dimension of the polar regions which will lead to the creation of data sets on the changing conditions of circumpolar human societies (Rapley and Bell, 2004).
Previous IPY/IGY excluded research in the socioeconomic and humanities fields, except for the limited medical studies carried on the personnel of the polar stations. This new and more human-oriented format of IPY reflected more integrative and society-driven nature of today’s polar research. In the United States alone, NSF allocated almost $20M in support of more than 30 research, observational, and data management projects in the social sciences and the humanities, the largest-ever concerted U.S. funding for such efforts. IPY’s new focus on the social and humanities issues was also spearheaded by the preceding efforts stimulated by the Arctic Council, such as the Arctic Human Development Report (AHDR, 2004), Arctic Climate Impact Assessment (ACIA, 2005), Survey of the Living Conditions in the Arctic (SliCA; Andersen et al., 2002) and others (Downie and Fenge, 2003) that were initiated prior to, or during, the planning phase for IPY. These and other new developments resulted in the increased engagement of polar residents, particularly Arctic indigenous people, in IPY operations. Such broadening of the research base and scope led to significant science
breakthroughs in IPY and in the general conduct of modern research at the poles.
Altogether, IPY social science and humanities projects engaged more than 1,500 researchers, students, indigenous experts and monitors, and representatives of Arctic indigenous organizations in more than 30 international and numerous national research and outreach projects (Krupnik et al., 2011). They studied human societies, past and present, and sought better understanding of forces that govern social interactions during IPY; they developed new approaches, interpretive models, and groundbreaking research paradigms.
There have been many pioneer advances in the polar social sciences during the IPY era. Although most of the IPY social science and humanities efforts were locally focused, several international projects included new coordinated research and data collection in four or more Arctic nations. They produced the first-ever broad circumpolar overviews of local community adaptation and vulnerability (Hovelsrud and Smit, 2010), status of indigenous reindeer herders’ and caribou hunters’ knowledge (Oskal et al., 2009), indigenous use of the sea ice habitats (Huntington et al., 2010), role of governmental policies in community resettlement and relocations (Schweitzer et al., in press), and other research fields.
New “baseline” data sets were generated on community development, industrial exploitation of polar resources, status of indigenous languages and knowledge systems, cultural heritage, community well-being (Larsen et al., 2010), and the community use of local resources. IPY researchers have connected these data to the earlier datasets, including those built by previous statistical surveys (SliCA—Andersen et al., 2002), thus expanding the scope of IPY records by several decades (Hamilton, 2009; Heleniak, 2008, 2009; Kruse, 2010; Winther, 2010). Still, the geographic coverage of IPY activities in the social sciences and the humanities was quite uneven, with the bulk of research conducted in the Eastern Canadian Arctic (Nunavut, Nunavik), Alaska, Norway, and Greenland, and fewer efforts in the Russian Arctic, northern Finland, and Iceland. Even within better covered regions some communities received more attention, like Barrow, Gambell, Shismaref, Toksook Bay, and others in Alaska, while many more were hardly touched by IPY.
IPY-generated research introduced a new vantage point in assessing environmental change at the poles, namely, the stock of knowledge by local residents and, especially, polar indigenous people. It includes records of generation-based observations and extensive local terminologies of sea ice and snow patterns and phenomena, often of many dozen terms (Krupnik et al., 2010a,b; Oskal et al., 2009). Many scientists and indigenous experts now believe that the vantage points offered by “two ways of knowing” (Barber and Barber, 2007), academic research and local/indigenous knowledge, are needed for a comprehensive understanding of the polar regions and processes. The changes in polar sea ice, for example, are observed and assessed differently and at various scales by ice scientists, climate modelers, oceanographers, local subsistence users, and social scientists (Eicken, 2010; Eicken et al., 2009).
Even though the ultimate goals of scientists (understanding and modeling of climate change) and polar residents (sustainable adaptation) may be different, each group can learn from the vision of the others, and the common resulting knowledge is more than the sum of its individual parts. By adding a sociocultural perspective and indigenous knowledge (Box 3.2), scientists broadened the IPY agenda in sea ice research beyond its common focus on ice dynamics and coupled ocean-atmosphere-ice modeling. One of the key IPY legacies is the legitimization of these multiple “ways of knowing” (Huntington et al., 2007; Kofinas et al., 2010); it marked a revolutionary paradigm shift accomplished during the IPY era.
Additionally, prior to IPY the prevailing pattern of modeling complex linkages and impacts of climate change was to place “humans” at the bottom of the chain-like charts illustrating interconnections within the ecosystem. The underlying assumption was to explore how “humans” (i.e., people or communities) respond to the impacts projected by computer-generated scenarios, such as warming climate, shorter ice season, or thawing permafrost. The new approach explored during IPY, called community-based vulnerability assessment, has moved communities to the center of the study of climate change (Hovelsrud and Smit, 2010). It starts with the observations of change reported within local communities and by their members and it proceeds bottom-up to identify potential new conditions,
BOX 3.2
Multiple Ways of Understanding Sea Ice
Ice scientists, climate modelers, oceanographers, local subsistence users, anthropologists, mariners, and science historians have remarkably different visions of polar sea ice. To various groups of scientists, sea ice is a multifaceted physical and natural entity—an ocean-atmosphere heat flux regulator, a climate trigger and indicator, a habitat (platform) for ice-associated species, and/or an ecosystem built around periodically frozen saltwater. To polar explorers and historians, sea ice was first and foremost a formidable obstacle to humanity’s advance to the Poles (Bravo, 2010). Polar indigenous people view sea ice primarily as a cultural landscape, an interactive social environment that is created and re-created every year by the power of their cultural knowledge. It incorporates local ice terminologies and classifications, ice-built trails and routes with associated place names, stories, teachings, safety rules, historic narratives, as well as core empirical and spiritual connections that polar people maintain with the natural world (Krupnik et al., 2010a).
Cultural landscapes created around polar sea ice (icescapes) are remarkably long-term phenomena, often of several hundred years (Aporta, 2009). By adding a sociocultural perspective and indigenous knowledge, ice scientists broadened the IPY agenda in sea ice research beyond its habitual focus on ice dynamics and coupled ocean-atmosphere-ice modeling (Druckenmiller et al., 2010; Eicken, 2010).
opportunities, or risks that communities are facing or may face in the future. This approach includes many more parameters of change, both physical and sociocultural, such as local demographic and economic factors, migration patterns, support networks, educational level, and others (Hamilton et al., 2010; Huntington et al., 2007). It puts critical emphasis on the assessment of community responses to future risks, sensitivities and adaptive strategies, and it requires extensive data collection at the community level, as the current adaptation mechanisms are researched and understood.
Often more immediate challenges stem from the many social agents, such as local system of governance, economic development, breakup in community support networks, availability of health care, and culture shifts. In certain areas in the Arctic, the purported “threat” of climate change masks the impact of more immediate factors, such as the alienation of property rights, appropriation of land, disempowerment of indigenous communities, and more restricted resource management regimes (Forbes et al., 2009; Konstantinov, 2010). Not all impacts from climate change will necessarily be negative, and climate and broader environmental change and its many impacts should be thus viewed as an added stressor to the already challenging local conditions on the ground.
Two international IPY projects—Community Adaptation and Vulnerability in the Arctic Region (CAVIAR) and Arctic Social Indicators (ASI)—were particularly instrumental to this transformation. The CAVIAR project tested new research and modeling approaches to assess the vulnerability and adaptability of 26 local communities in Canada, the United States (Alaska), Greenland, Iceland, Norway, Sweden, Finland, and Russia (Hovelsrud and Smit, 2010). The main outcome was a new vision of the Arctic peoples’ resilience to environmental stress as a “two-way” process that depends as much (or more) on the strength of the community internal networks (social, cultural, institutional, economic, etc.) as on the intensity of the environmental signals. The ASI project initiated by the Arctic Council developed a set of thoroughly calibrated indicators to evaluate the status of sociocultural wellbeing of Arctic population at the community, local, and regional levels (Crate et al., 2010). The previously used general national indexes used by UNESCO and other major international agencies, such as per capita gross domestic product or the overall level of literacy,11 have been successfully superceded by more locally nuanced tools to assess community well-being as a result of IPY research.
Another critical frontier theme explored in IPY was the relationship between indigenous perspectives developed via generations of shared knowledge and the data and interpretations generated through scholarly research. The field that compares such perspective did not even exist prior to the late 1990s. Several IPY projects contributed to our increased understanding of how indigenous knowledge could be matched with instrumental data in monitoring the changes in Arctic ice (see Box 3.2; Figure 3.28), snow and vegetation condition,12 marine mammal and caribou/reindeer migrations, and behavioral patterns of polar animals and fishes (Hovelsrud et al., 2011; Kofinas et al., 2010;
______________________
11http://unstats.un.org/unsd/demographic/products/socind/default.htm.
12http://icr.arcticportal.org/index.php?option=com_hwdvideoshare&task=viewvideo&Itemid=127&video_id=11&lang=en.
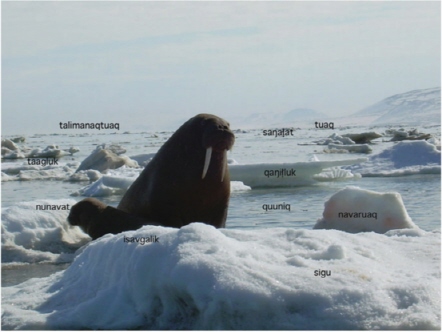
FIGURE 3.28 The “high resolution” of indigenous terms for sea ice often allows distinction among numerous types of ice and related phenomena within a small area. On this photograph, a female walrus and a calf (isavgalik) are resting on the ice (nunavat) in the midst of scattered pack ice (tamalaaniqtuaq) interspersed with patches of calm flat water (quuniq). The mass of floating ice (sigu) consists of various ice formations such as puktaat (large floes), puikaanit (vertical blocks of ice), kangiqluit (floes with overhanging shelves) taaglut (pieces of darker or dirt ice), and sangalait (small floating pieces of ice) SOURCE: Winton Weyapuk Jr., May 21, 2007; Krupnik and Weyapuk, 2010.
Krupnik and Hovelsrud, 2011; Oskal et al., 2009). Yet another “frontier” area advanced during IPY explores how to make polar research culturally and socially relevant to local residents. It argues for collaboration with the new groups of stakeholders on research planning in their home areas to assess local concerns and for the new research agenda to be set through dialogue with communities rather than via top-down planning by funding agencies or at university campuses.
Major outcomes from IPY social science and humanities research included the multilevel and adaptive nature of governance of the “international spaces,” such as Antarctica, the Central Arctic Basin, High Seas and Outer Space (Berkman et al., 2011; Shadian and Tennberg, 2009). This outcome originated in large part from the extensive historical studies of IGY 1957-1958 and previous IPYs (Barr and Luedecke, 2010; Elzinga, 2009; Launius et al., 2010), of the implementation of the Antarctic Treaty of 1959 and the new role of the United Nations Convention on the Law of the Sea (UNCLOS) in the Arctic policy debate. Another frontier area pioneered in IPY was the comparative study of Northern-Southern Hemisphere processes under the concept of “fringe environments” (Hacquebord and Avango, 2009). In the social sciences and humanities fields, it focused on the history of polar explorations, commercial use of local resources, polar governance, tourism, and heritage preservation (Avango et al., 2011; Barr and Chaplin, 2008; Broadbent, 2009; Hacquebord and Avango, 2009); it illustrated remarkable parallels in human advances into both northern and southern polar regions.
In the years prior to IPY, the dichotomy between the northern and southern regions went far beyond the basic biological and physical differences exemplified by the northern polar bear and the southern penguin, or ocean ringed by continents in the north and continent surrounded by ocean in the south. Antarctic social research was almost nonexistent, as there were “no people” in Antarctica. As a result of IPY, a new network of the “Antarctic social sciences” emerged, first, in the form of SCAR Action Group (AG) on the History of Institutionalization of Antarctic Research (established in 2004 and focused primarily on the history of human explorations in Antarctica),13 followed by another and much broader SCAR Social Science AG, “Values in Antarctica. Human Connections to the Continent,” that includes specialists in political sciences, cultural and human geography, law, economics, tourism, literature, psychology, and media studies.14 These developments were triggered by an explosion of interest in social issues that are common to both polar regions and
______________________
gaining speed in the post-IPY era (Liggett and Steel, 2011), including the Montreal “Knowledge to Action” Conference (April 2012).15
Overall, new research in the social science and humanities fields helped advance a broad variety of themes: the well-being of polar communities; use of natural resources and economic development, particularly the impact of oil and gas industry in the polar regions; local ecological knowledge; preservation of natural, historical, and cultural heritage and the status of indigenous languages; and history of exploration, peopling, and the exploitation of polar regions. IPY participants from local communities and polar indigenous organizations were particularly active in studies investigating adaptations to rapid environmental and socioeconomic changes. They joined forces with the IPY monitoring efforts to collect, exchange, and document data on sea ice, biota, and climate, use of local resources, and impacts of industrial exploitation of the polar regions (Hovelsrud and Smit, 2010). These and other contributions of polar residents to the IPY program make one of its most lasting achievements.
Besides innovative projects in social sciences, IPY also featured numerous activities in the humanities, both international and on the national and regional scales. Altogether, more than 20 international projects in the humanities were endorsed for the IPY program, including several museum exhibits (“Thin Ice,” “Inuit Voices,” “Antarctic Touring Exhibit,” and others), numerous arts and media shows, books, and films (see examples in Kaiser Zicus and Chapter 5). Notable U.S. events include the FREEZE16 activities in Anchorage in January 2009 celebrating Alaska and life in the North, where artists, architects, and designers from Alaska and around the world came together to create large-scale outdoor installations in downtown Anchorage using snow, ice, and light—distinctly northern elements. Further descriptions of activities that helped bring the IPY message to thousands of people worldwide are included in Chapter 5 (“Knowledge to Action”).
HUMAN HEALTH
IPY 2007-2008 was the first IPY to include human health dimensions as a recognized thematic area of study. IPY activities related to human health were primarily focused on the permanent inhabitants of polar regions, with additional efforts to reach transient and nomadic communities as well. Research previous to IPY had highlighted several discrepancies in basic health metrics between indigenous and nonindigenous populations residing in these areas (Young and Bjerregaard, 2008). Mortality proxies such as life expectancy at birth and infant mortality are generally less favorable (lower life expectancy at birth and higher infant mortality) for indigenous populations throughout the circumpolar world, though distinct regional differences persist. As such, it was recognized that IPY represented a unique opportunity to further stimulate cooperation and coordination on Arctic health research and end-user access.
The Arctic Human Health Initiative (AHHI17) was created during IPY to link researchers with potential international collaborators and to serve as a focal point for human health activities (described in section on “Subsistence Communities in the Arctic” in Chapter 5). While various networks exist to coordinate circumpolar health researchers, these projects exist on a widely variable country-by-country basis. One of the goals of AHHI was to enhance these systems, add international connectivity, and provide a better access to data resources. In the United States, the University of Alaska, Anchorage has established a new graduate program aimed at circumpolar health issues. In an effort to connect polar regions, the International Union for Circumpolar Health (IUCH18) now serves as an ongoing network where the many circumpolar societies can meet and work on initiatives that support research, development, networking, and dissemination of health information, including the Congress on Circumpolar Health, held every 3 years. IPY also saw the establishment of the International Network of Circumpolar Health Research, as well as Arctic-Net, which serve to connect researchers from across the globe. To ensure that data access was made available to the many constituents of the project, a key focus of IPY was to create a legacy of data resources. Thus a human
______________________
15http://apecs-social-sciences.blogspot.com/2011/08/fwd-ipymontreal22-27-april-2012.html.
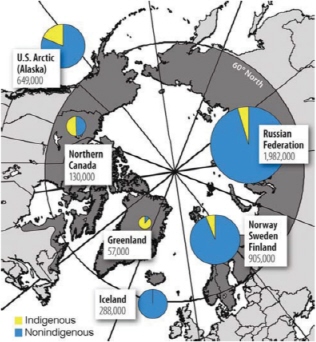
FIGURE 3.29 The ICS network of public health laboratories and institutes collects, compares, and shares data on infectious diseases. This map indicates participating countries (areas shaded dark gray), as well as the locations of clinical laboratories (small and large dots) that were used to monitor cases of invasive disease. During IPY, efforts were made to incorporate this type of data into SAON. SOURCE: Parkinson et al., 2008.
health component was incorporated into the Sustaining Arctic Observing Networks (SAON) that pools existing networks, such as the infectious-disease-oriented International Circumpolar Surveillance (ICS) system (Parkinson et al., 2008; Figure 3.29), to form a central site for human health-related concerns. These projects are deemed essential not only to the research mission of IPY, but to ensure that user needs are incorporated and prioritized on many levels.
IPY health research focused on a suite of issues of concern to Arctic residents, including health impacts of environmental contaminants, climate change, rapidly changing social and economic parameters within communities, chronic diseases, and health disparities between indigenous and nonindigenous residents.
Research on environmental contaminants was targeted at understanding how modern pollution affects indigenous life. Though socioeconomic circumstances and lifestyle contribute to health determination, studies also show that contaminant levels in some parts of the Arctic have the potential for adverse health effects.
Epidemiological studies have related immunological, cardiovascular, and reproductive effects due to contaminants present in some Arctic populations (AMAP, 2009). Another study19 is examining the risk of breast cancer in Inuit women in response to POPs, and further studies are investigating whether climate change contributes to high levels of POPs in fish and humans. Results of these studies are forthcoming and should provide insight into the relationship between native populations and their environment in a changing world.
Another major health discrepancy is the rate of infectious diseases seen among indigenous populations as compared to nonindigenous. In response to the high native rates of hepatitis B infection, for example, member nations have established the Circumpolar Viral Hepatitis Working Group and are conducting studies to determine the epidemiology.20 Already, this group has identified a new HBV subgenotype (B6), unique to some native populations (Sakamoto et al., 2007), and has investigated outbreaks within the community (Børresen et al., 2010). Sexually transmitted infections are also high within indigenous populations (Gesink-Law et al., 2008) and work identifying at risk communities has shown that social and cultural norms significantly impact this problem (Gesink-Law et al., 2010; Rink et al., 2009). Beyond these activities, studies looking at the prevalence of zoonoses and parasitic infections (Gauthier et al., 2010), Streptococcus pneumoniae (Bruce et al., 2008), and human papillomavirus,21 have addressed serious health issues in native populations and provide a research base for studies looking forward.
Because lifestyle changes have engendered an increase in obesity, diabetes, and cardiovascular disease in native populations (Galloway et al., 2010), several IPY studies were chartered to address these issues. “The Inuit Health in Transition” was a large international study focused on diet and lifestyle factors (smoking, physical activity, etc.) and is currently tracking living conditions, lifestyle risk factors, and environment with their relationship to chronic disease (Chan et al., 2009; Dewailly et al., 2009). Preliminary finds are now being distributed. Similar studies at University of Alaska, Fairbanks are building collaborative research presences
______________________
19http://classic.ipy.org/development/eoi/details.php?id=1257.
20http://classic.ipy.org/development/eoi/details.php?id=1109.
21http://classic.ipy.org/development/eoi/details.php?id=1121.
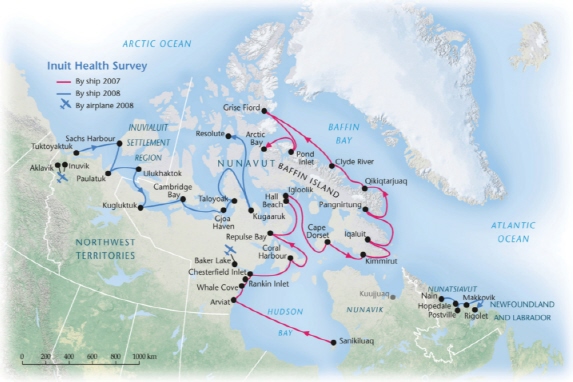
FIGURE 3.30 During IPY, there were a number of initiatives to explore behavioral and mental health issues in the northern regions. For example, the Inuit Health Survey team visited 36 communities during the summers of 2007 and 2008 to collect information on mental and community wellness. Locations of the Inuit Health Survey are shown on this map. SOURCE: Steven Fick/Canadian Geographic.
in Native communities focusing on the reduction of health disparities (Mohatt et al., 2007).
Beyond addressing physical illness, depression and suicide have been highlighted as significant issues in northern regions (Levintova et al., 2010). During IPY, there were a number of research projects that explored behavioral and mental health issues and the relationships between outcomes and environmental factors. The Inuit Health Survey22 (Figure 3.30) collected information on mental and community wellness and provided information on their prevalence and evaluated community support and other determinants of resilience (Egeland, 2009). A Nunavik cohort study focused on the exposure of environmental contaminants and lifestyle factors (smoking, drugs, alcohol) on child behavior and development (Muckle et al., 2009). Studies looking at adoption (Laubjerg and Petersson, 2010), culturally based preventive intervention (Allen et al., 2009), and rapid social transition23 also have tackled some of the problems unique to this demographic.
Circumpolar regions experience unique challenges in the delivery of health services because of the dispersed populations and geographic isolation. In response to this, the Northern Forum (NF24) was established to promote mutually beneficial collaboration in telemedicine, telehealth, mobile medicine and distance learning. This project is an important first step in both improving technologies and enhancing forums to promote partnership activities. Beyond this involvement, offerings including numerous symposia and workshops, published books and journals,
______________________
22www.inuithealthsurvey.ca/?nav=home.
23http://classic.ipy.org/development/eoi/details.php?id=1266.
television and radio presentations, and establishment of educational programs have all enhanced the access and connection to IPY activities.
In conclusion, this was the first International Polar Year to address Arctic health issues, and first results are still emerging. By establishing the infrastructure, connectivity, and dissemination products and prioritizing them around user needs, a system has been in place to provide support for this research mission and user interface for years to come. This is an important new direction in science that is a distinct and important legacy of IPY.
CONCLUSIONS
Scientific discoveries during IPY used observations from some of the most remote regions of the Earth for a new understanding that benefits all humanity. Clear attribution that current warming of the planet is due to human activity came during IPY from at least three totally different research areas, the paleoclimatology, space physics, and modeling communities. Lake sediment sequences, ice cores, and tree ring records from the circumarctic show that recent warming has reversed the cooling trend of the last 2,000 years. Warming and freshening of the Arctic Basin is increasing, having a large impact on both sea ice reduction and basin stratification. The changes are having significant impacts at all trophic levels of the marine environment—from microorganisms to top predators in both polar regions. Terrestrial research show that land warming, sea ice decline, and greening of the Arctic are linked; this observation of modern processes is supported by paleoclimate findings on terrestrial systems. A new realization emerged that the total belowground carbon pool in permafrost is more than double the atmospheric carbon pool and three times larger than the total global forest biomass; this potentially provides an additional positive feedback parameter in the global system.
Discoveries involving the mechanisms of ice sheet flow associated with internal hydrological and subglacial conditions and interaction of ice shelves with the warming ocean enabled new understanding of ice sheet stability. The West Antarctic ice sheet became unstable and collapsed repeatedly, significantly raising sea level, during the interglacials of the past 3.5M years, which were warmer than today. Paleoclimate data show repeated intervals in the past when the Greenland ice sheet may have been much smaller than today and sea ice reduced. The IPY years spawned the realization that the impacts of warming on the Greenland ice sheet and the West Antarctic ice sheet will likely raise sea level faster than current models now can predict. Remotely sensed and direct measurements of accumulation across the East Antarctic ice sheet showed that current climate models have overestimated accumulation due to snowfall. Cutting-edge radar measurements of the bottom of the East Antarctic ice sheet yield insight on ice sheet origins.
From the polar regions looking into space, IPY allowed for some of the most comprehensive synoptic measurements of the geospace environment ever taken, including new nets for observing and understanding the impacts of space weather on global communications.
Engagement with the inhabitants of the Arctic has led to new capacities for learning about the social processes and health of the people who live in the polar regions.


