
OVERVIEW OF URBAN METEOROLOGY
SUE GRIMMOND, KING’S COLLEGE LONDON
Introduction
Increasing urban populations worldwide has heightened awareness, enhanced interest and focused attention on urban meteorology. The absolute number of people living in cities, the proportion of the world’s population this represents, and the land surface cities cover all continue to increase. Concurrently, greater computer capacity has allowed for higher resolution model domains to be used routinely for Numerical Weather Prediction (NWP) which has resulted in urban areas now being a land surface category that models need to account for.
Moreover, urban areas have higher population densities than rural areas. This, combined with the living conditions of many in cities, means that urban dwellers have a greater likelihood of being at risk or vulnerable to meteorological events. Consequently it is critical that we have the ability to forecast urban weather and to provide meteorological data for end user applications that range from dispersion, to thermal comfort, to flooding, energy demand, etc.
Urban areas range from small towns to megacities. Despite their differences in size, common characteristics of urban areas are changes in land cover, morphology (form), and emissions compared to nonurban land surfaces. NWP models need to address these. This paper provides a brief overview of these features.
Urban Surface Characteristics
One of the most distinct characteristics of the urban surface is the amount of vegetated cover relative to the impervious or built cover. Typically this varies across a city, with the largest impervious fraction found in the central business district (CBD), with residential areas more vegetated (Figure A.1). The built fraction consists of paved roads, sidewalks and parking lots as well as actual buildings. The characteristics of buildings also tend to change with distance from the CBD, with the buildings typically becoming shorter. Towards the suburbs, buildings also tend to be of lower density (more widely spaced).
This change in building height (H) and the distance between them (W), impacts wind flow and radiation exchange. In addition, urban building materials have different thermal and radiative characteristics to natural materials which affect heat storage and radiative exchanges.
Taller buildings are also associated with increased anthropogenic heat flux. Additional energy is required for the buildings to operate (e.g. elevators), and the greater density of people results in increased needs for air conditioning, removal of CO2 enriched air, etc. With a focus of activities, such as in the CBD, there are more emissions from transport, which has implications for both energy and air quality.
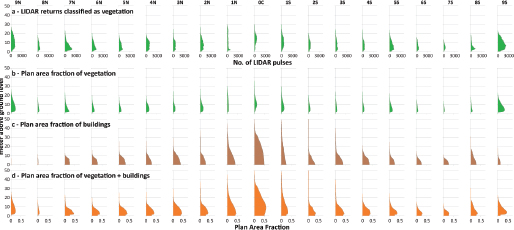
FIGURE A.1 Variation in plan area fraction by height of trees/shrubs and buildings in a North to South transect of London (OC centre of London, although not the tallest building area of London) (Lindberg and Grimmond, 2011)
Scale and Applications
Typically urban meteorological processes are considered to operate at three spatial scales; these relate to spatial units that are relevant for applications and decision making. The micro-scale, which in the vertical dimension relates to the urban canopy layer (from about the mean height of the roughness elements—buildings and trees to the ground), is what is experienced most directly by people. At this scale, there is significant spatial variability because of differences in radiation (e.g. shading/sunlit) and wind flow (blocked, channelled, open) that occur over very short distances. This spatial variability is not resolved in urban land surface parameterizations that are included in NWP. If they need to be resolved, some form of computational fluid dynamics (CFD) modelling is needed (e.g. large eddy simulation, LES).
The local or neighbourhood scale, where the vertical dimension extends from the blending height (minimum of about two times the roughness height) to a height dependent on the nature of the variability of the neighbourhood areas, is what urban land surface models parameterize in NWP models. The urban area is made of a series of such neighbourhoods which may have different characteristics related to urban form, vegetation cover etc. It is at this scale that understanding/modelling of meteorology is required for decision making related to response to flooding, assessing vulnerability to heat waves, response to hazardous dispersion, etc.
The meso- or city scale creates its own urban boundary layer, the height of which is a function of the different neighbourhoods in the city and the characteristics of the surrounding rural area. This city scale is normally an administrative unit for which decisions are made related to large scale meteorological and climatological processes; for example susceptibility to major storms or synoptic events (e.g., hurricanes, snow storms, regional heat waves) or climatological vulnerabilities (e.g., sea level rise).
Features of Urban Environment
from a Meteorological Perspective
The most well-known atmospheric feature of the urban environment is the urban heat island (UHI). The original definition of the UHI is related to the canopy layer (UCL)—the air temperature difference between an urban area and the surrounding rural area. However, when considering the UHI, a number of key issues need to be taken into account. The UHI is dynamic, and the size and location of the maximum varies with time of day and with season. This means that few people experience the maximum urban warming, rather an urban effect that is less than that. It is also important to keep
in mind that the magnitude of the difference is dependent not only on the characteristics of the urban area but also on the rural environment that is being used as a reference (Figure A.2).
Moreover, it is important to distinguish which UHI is being discussed: temperatures observed in the air, of the surface, and in the soil all are different. These all depend on the height/depth of the observation too. The temperature that people experience is more likely to be that of the UCL. Satellites do not observe this, rather features of the surface. Results need to be corrected for the emissivity of the surface materials and are dependent on the field of the view of the instrument and pixel resolution. Thus, the satellite determined temperature product is biased towards roofs and is dependent on clear conditions between the satellite and surface.
Given the large variability of temperature over small distances (e.g. Offerle et al. 2007), in any application it is critically important to understand
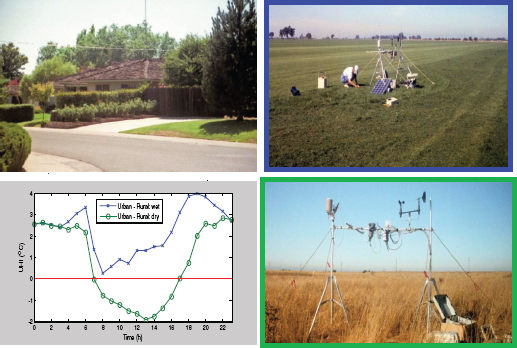
FIGURE A.2 Air temperature differences measured between a suburban site and two rural areas surrounding Sacaramento, CA: one without irrigation (dry) and one with irrigation (wet). Data from Grimmond et al. (1993).
how standard observations will differ from the actual location of interest. This remains an area where much work is needed.
A key feature of the urban environment relates to the trapping of radiation and re-radiation because of the reduced sky view factor (SVF). The standard nonurban meteorological station typically will have a much higher SVF (more open) than the urban area (Figure A.3). The radiation receipt at normal angles (early morning and evening) and enhanced radiative trapping, combined with the large urban mass (buildings and other structures) help generate a large
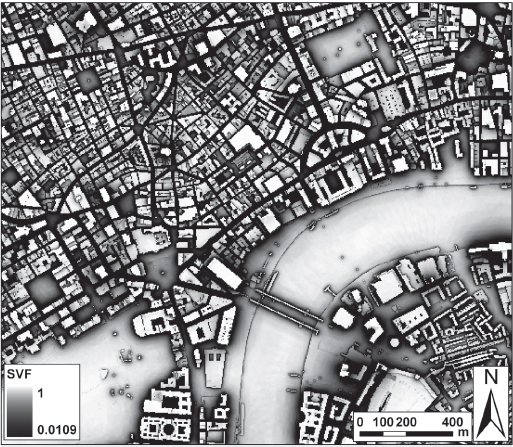
FIGURE A.3 Sky view factor (SVF) and location of a UK Met Office climate station (SJP, St James’s Park) in central London. SJP can be seen to have a much higher SVF than the surrounding urban area. Anotated figure from Lindberg and Grimmond (2010).
storage heat flux (Grimmond and Oke 1999). This flux is normally greater in the evening hours and provides a source of energy into the evening which can be important for maintaining the turbulent sensible heat flux and unstable or neutral conditions. The additional heat from the anthropogenic heat flux also contributes to this. Precipitation processes are influenced by the presence of the large roughness elements of cities, the additional heating, and the additional source of aerosols. However the impact of the urban area is complex and appears to depend on synoptic conditions (Figure A.4).
Urban Land Surface Models (ULSM)
Developers of ULSM, which form the lower boundary condition for NWP models, have taken a wide range of approaches to incorporate what they regard as the essential feature of the urban environment (Grimmond et al. 2009, 2010a). Key differences between these schemes include if vegetation is accounted for; anthropogenic heat flux is accounted for; the surface is treated as flat, an infinitely long canyon, or having intersections; multiple reflections occur; and how many (and where) resistances for heat and moisture transfer are used (Figure A.5).
The recent offline evaluation of more than 30 ULSM by Grimmond et al. (2010a, 2011) found that no single model performs best for all components
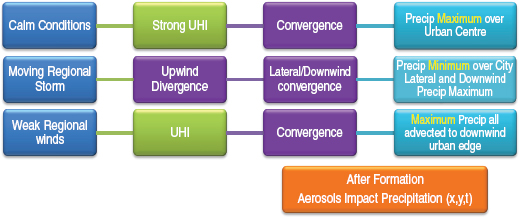
FIGURE A.4 Processes that influence precipitation resulting from summer thunderstorms. Figure created based on presentation by RD Bornstein (2011) Urban impacts on summer thunderstorms. International Workshop on Urban Weather and Climate. Beijing, July 12-15, 2011.
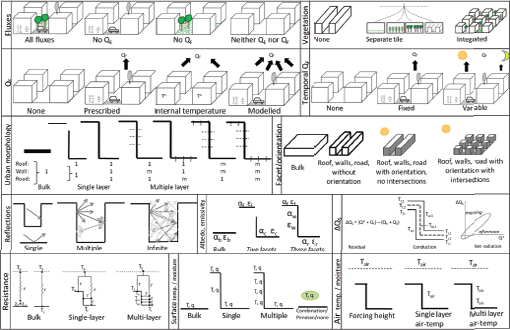
FIGURE A.5 Range of approaches taken to model urban processes in ULSM (modified from Grimmond et al. 2011).
of the urban energy balance and that accounting for evaporation is important. This study makes a number of recommendations for model development and model use (Grimmond et al. 2011).
Recommendations/Final Comments
A recent international review of urban meteorology for the World Climate Congress 3 made a series of recommendations for urban meteorology. In summary (modified from Grimmond et al. 2010b):
1. Observations: More operational urban measurement stations and networks within urban areas and upwind. The stations should conform to WMO Urban Guidelines (WMO 2006, Chapter 11). The long-term measurement stations in cities should be preserved. There is a need for vertical profiles of physical and chemical variables.
2. Data: International data archive is needed which can be used for historical and current analyses. This would aid with the translation of research findings into applications and for improving meteorological understanding. Development of guidelines for different climate zones and urban land-uses is also needed; and ensuring that there is high quality data of use to a broad range of end users. It is critical that there are good metadata (e.g., description of instruments, site, data quality assurance and control, protocol).
3. Understanding: There is a need to develop methods and frameworks to analyse atmospheric data measured above complex urban surfaces. It is necessary to develop methods to distinguish between signals attributable to urban change, regional change, and global change.
4. Modelling: There is a need for improved short-range, high-resolution numerical prediction in urban areas of weather, air quality, and chemical dispersion. Improved modelling of biogeophysical features of the urban land surface exchange of heat, moisture, momentum, and radiation with the atmospheric urban boundary layer. Improve (and/or incorporate) data assimilation of meteorological and biogeophysical data from improved observing networks.
5. Tools: Develop tools that allow models to accommodate the wide differences in data availability depending on application from research to operational situation (e.g., routine versus research intensive data), probable impacts of proposed sustainable design measures to be assessed and ranked including any unintended consequences of the proposed changes.
6. Knowledge Exchange: Ensure widespread training of the meteorological community about urban meteorology. Assist in appreciation of the role of meteorology and hydrology in urban planning and management of sustainable cities of all sizes. Communication across scientific disciplines and spatial and temporal scales must be encouraged.
REFERENCES
Grimmond, C. S. B., and T. R. Oke. 1999: Heat storage in urban areas: observations and evaluation of a simple model. Journal of Applied Meteorology 38:922-940.
Grimmond, C. S. B., T. R. Oke, and H. A. Cleugh. 1993. The role of “rural” in comparisons of observed suburban -rural flux differences. Exchange processes at the land surface for a range of space and time scales. International Association of Hydrological Sciences Publication 212:165-174.
Grimmond, C. S. B., M. Best, J. Barlow and A. J. Arnfield J.-J. Baik, S. Belcher, M. Bruse, I. Calmet, F. Chen, P. Clark, A. Dandou, E. Erell, K. Fortuniak, R. Hamdi, M. Kanda, T. Kawai, H. Kondo, S. Krayenhoff, S. H. Lee, S.-B. Limor, A. Martilli, V. Masson, S. Miao, G. Mills, R. Moriwaki, K. Oleson, A. Porson, U. Sievers, M. Tombrou, J. Voogt, and T. Williamson. 2009. Urban surface energy balance models: model characteristics and methodology for a comparison study. Pp. 97-123 in Urbanization of Meteorological and Air Quality Models, A. Baklanov. C. S. B. Grimmond, A. Mahura, M. Athanassiadou, editors. Dordrecht: Springer-Verlag, 97-123.
Grimmond, C. S. B., M. Blackett, M. Best, J. Barlow, J. J. Baik, S. Belcher, S. I. Bohnenstengel, I. Calmet, F. Chen, A. Dandou, K. Fortuniak, M. L. Gouvea, R. Hamdi, M. Hendry, T. Kawai, Y. Kawamoto, H. Kondo, E. S. Krayenhoff, S. H. Lee, T. Loridan, A. Martilli, V. Masson, S. Miao, K. Oleson, G. Pigeon, A. Porson, Y. H. Ryu, F. Salamanca, G. J. Steeneveld, M. Tombrou, J. Voogt, D. Young, and N. Zhang. 2010a. The International Urban Energy Balance Models Comparison Project: First results from Phase 1. Journal of Applied Meteorology and Climatology 49: 1268-1292, doi: 10.1175/2010JAMC2354.1.
Grimmond, C. S. B., M. Roth, T. R. Oke, Y.C. Au, M. Best, R. Betts, G. Carmichael, H. Cleugh, W. Dabberdt, R. Emmanuel, E. Freitas, K. Fortuniak, S. Hanna, P. Klein, L. S. Kalkstein, C. H. Liu, A. Nickson, D. Pearlmutter, D. Sailor, and J. Voogt. 2010b. Climate & More Sustainable Cities: Climate Information for Improved Planning & Management of Cities (Producers/Capabilities Perspective). Procedia Environmental Science 1:247-274.
Grimmond, C. S. B., M. Blackett, M. J. Best, J.-J. Baik, S. E. Belcher, J. Beringer, S. I. Bohnenstengel, I. Calmet, F. Chen, A. Coutts, A. Dandou, K. Fortuniak, M. L. Gouvea, R. Hamdi, M. Hendry, M. Kanda, T. Kawai, Y. Kawamoto, H. Kondo, E. S. Krayenhoff, S.-H. Lee, T. Loridan, A. Martilli, V. Masson, S. Miao, K. Oleson, R. Ooka, G. Pigeon, A. Porson, Y.-H. Ryu, F. Salamanca, G.-J. Steeneveld, M. Tombrou, J. A. Voogt, D. Young, and N. Zhang. 2011. Initial Results from Phase 2 of the International Urban Energy Balance Comparison Project. International Journal of Climatology 31:244-272 DOI: 10.1002/joc.2227.
Lindberg, F., and C. S. B. Grimmond. 2010. Continuous sky view factor from high resolution urban digital elevation models, Climate Research 42:177-183 doi:10.3354/cr00882.
Lindberg, F., and C. S. B. Grimmond. 2011. Nature of vegetation and building morphology characteristics across a city: influence on shadow patterns and mean radiant temperatures in London Urban Ecosystems doi: /10.1007/s11252-011-0184-5.
Offerle, B., I. Eliasson, C. S. B. Grimmond, and B. Holmer. 2007. The influence of surface heating on air temperature, wind and turbulence in an urban street canyon. Boundary Layer Meteorology 122:273-292, doi: 10.1007/s10546-006-9099-8.
WMO (World Meteorological Organization). 2006. Guide to Meteorological Instruments and Methods of Observation, WMO No-8. Chapter 11: Urban Observations.
URBAN METEOROLOGICAL MEASUREMENTS
WALTER F. DABBERDT, VAISALA GROUP
Introduction—The Urban Challenge
Cities alter the landscape in many different and pronounced ways relative to the neighboring, natural environment. The larger and more densely populated the city, the greater is its impact on atmospheric processes (both meteorological and air quality) within and downwind of its boundaries. The manmade urban landscape alters the thermal, radiative, and aerodynamic characteristics of the land surface and subsurface (e.g., Dabberdt and Davis, 1978), thereby modifying the local atmospheric and hydrologic environment. In addition, waste heat and particulate and gaseous emissions further alter the atmospheric state and composition. As a result, the atmospheric environment differs in many ways from conditions immediately upwind with significant changes in temperature, winds, humidity, cloud cover,
precipitation, visibility, and air quality. The urban heat island is but one manifestation of these changes. Table A.1 is a subjective summary developed by Oke (1997) of the kinds and magnitudes of these changes. In the face of these effects, there is a pressing challenge to properly measure the state of the atmosphere in a way that enables both the quantification of the atmospheric state at any time and the prediction of changes in time using numerical models and other techniques (e.g., nowcasting).
This note addresses the urban measurement challenge in terms of identifying the operational needs for meteorological and air quality observations. End-user groups are identified along with their respective atmospheric information needs and data requirements (temporal and spatial resolution, and latency). These needs ultimately define the requisite atmospheric observing
TABLE A.1 Estimated Urban Meteorological Effects for a Mid-Latitude City with about 1 Million Inhabitants
| Variable | Change | Magnitude/Commentsa |
| Turbulence intensity | Greater | 10-50% |
| Wind speed | Decreased | 5-30% @ 10m in strong flow |
| Increased | In weak flows with heat island | |
| Wind direction | Altered | 1-10deg |
| UV radiation | Much less | 25-90% |
| Solar radiation | Less | 1-25% |
| Infrared input | Greater | 5-40% |
| Visibility | Reduced | Na |
| Evaporation | Less | About 50% |
| Convective heat flux | Greater | About 50% |
| Heat storage | Greater | About 200% |
| Air temperature | Warmer | 1-3C per 100yr; 1-3C annual mean; up to 12C hourly mean |
| Humidity | Drier | Summer daytime |
| More moist | Summer night; all day winter | |
| Cloud | More haze | In and downwind of city |
| More cloud | Especially in lee of city | |
| Fog | More or less | Depends on aerosol and surroundings |
| Precipitation | ||
| Snow | Less | Some turns to rain |
| Total | More? | To the lee rather than in city |
| Thunderstorms | More | |
| Tornadoes | Less | |
a Values for summer unless otherwise noted
SOURCE: Oke, 1997
systems and the design of the observing network. Lastly, a few technological challenges are introduced. Research needs for specialized measurements and instrumentation options are outside the scope of this note although virtually all operational measurements are useful for research purposes as well.
Users, Applications and Needs
There is a wide range of urban end users of atmospheric information. Some are public institutions and agencies charged with protecting life and property, while many others are private organizations and businesses that use atmospheric information to enhance their operations or mitigate damages. By sheer numbers, the largest user group is the general public whose citizens use meteorological and air quality information to make a myriad of decisions in their daily lives; these range, for example, from decisions on proper clothing for the day to selecting the timing and routing of their commutes to avoiding or minimizing the deleterious effects of elevated levels of ozone or particulate matter. As useful as meteorological or air quality information alone may be, users invariably use this information to make decisions based on information about specific impacts to them; this involves blending meteorological information with various risk factors that are a specific function of the users’ applications.
As a result, specifying the meteorological measurement needs for an urban area first requires deep understanding of the users and the derivative information required for their applications along with the necessary accuracy, precision, and temporal and spatial resolution of that information. It also requires knowledge of how numerical meteorological and air quality prediction models and data assimilation models use these measurements to make predictions of the future atmospheric state as well as to provide detailed analyses of the current atmospheric state. In this way, end users may either make use of the measured atmospheric data directly or they may rely on output data generated by numerical models (which, in turn, assimilate the observational data).
A subjective summary of the range of typical users and their characteristic data needs is presented in Table A.2. Thirteen types of urban applications are listed along with the different user groups that deal with the various applications. Their data needs are then characterized according to four sets of features. First, the table lists the type(s) of atmospheric data needed to aid in their decision-making. Second, the required spatial resolution is categorized as falling into one of three categories: fine-scale (at the block or street level), neighborhood scale, or city scale. Third, the temporal resolution is typed as
TABLE A.2 Examples of some common urban applications of atmospheric information and their respective user groups, with a subjective assessment of their data requirements.
| Application Type | End User Group | User Sector | Characteristic User Data Requirements | ||||||
| Atmospheric Data | Spatial Resolution | Temporal Resolution | Forecast Period | ||||||
| Electric power | Power producers | Private | T, L, CC | city | ≤1 | NC, Sh, Md, Ln | |||
| Grid operators | Private | I | neighborhood (equiv.) | — | — | ||||
| Local utilities | Private and Public | T, pp, V | neighborhood | ≤1 | NC, Sh, Md, Ln | ||||
| Building systems management | Building managers | Private | T, L | block | 1-3 | Sh, Md | |||
| Transportation management | Highway departments | Public | T, I, pp, V, VSBY | neighborhood | ≤1 | Sh, Md | |||
| Railroads | Private | T, I, pp, V, VSBY | city | ≤1, 1-3 | Sh, Md | ||||
| Airports | Public | T, I, pp, V, VSBY, CC | neighborhood | ≤1 | NC, Sh, Md, Ln | ||||
| Harbor and river masters | Public | T, I, pp, V, VSBY | neighborhood | ≤1, 1-3 | NC, Sh, Md | ||||
| Public health and safety | Health departments and emergency mangers | Public | T, U, pp, L, V, CC | neighborhood | ≤1 | Md | |||
| Air quality | Air quality management and public safety officials | Public | AQ, T, U | block, neighborhood | 1-3 | Md | |||
| Emergency response | Public and industrial safety officials | Public and Private | T, U, pp, V, AQ | block, neighborhood | ≤1 | NC, Sh | |||
| Flood control | Municipal officials | Public | pp, T | block, neighborhood | 1-3 | NC, Sh | |||
| Insurance | Company officials | Private | pp, T, I, L, V | block, neighborhood | ≤1 | Md, Ln | |||
| Retail sales management | Company officials | Private | pp, T | neighborhood, city | >3 | Ln | |||
| Research | Basic and applied researchers | Academic, Public, Private | VSBY CC | block, neighborhood, city | ≤1, 1-3, >3 | NC, Sh, Md, Ln | |||
| Urban planning | Municipal officials | Public | T, U, V, AQ | neighborhood | 1-3, >3 | (climate averages) | |||
| Tourism | Public visitor bureaus and private service providers | Public and Private | T, U, V, pp, L, AQ, VSBY, CC | city | 1-3 | Md | |||
| Personal decision support | General public (local) | Public | T, U, V, pp, I, L, AQ, VSBY, CC | neighborhood | 1-3 | Sh, Md, Ln | |||
KEY: Atmospheric Data: AQ=pollution concentrations; CC=cloud cover; I=icing; L=lightning; pp=precipitation; T=temperature; U=humidity; V=wind; VSBY=visibility. Forecast Period: NC(nowcast)=≤2h; Sh=2-12h; Md=12-48h; Ln=>48h.
either high resolution (≤ 1h), moderate resolution (1-3 h) or low resolution (> 3h). And lastly, the forecast lead time requirements are stratified into four categories: current state and nowcasts (≤ 2h), short-range forecasts (2-12h), mid-range forecasts (12-48h) and longer range forecasts (> 48h). It is clear from the table that the data requirements of the different user groups have many commonalities but also some significant differences. For example, public health and safety organizations charged with warning the public of the hazards of impending heat waves or cold spells have far different requirements than does the renewable energy industry looking to balance energy production with demand or the construction industry that simply needs to know if the wind speed will permit safe (and sometimes legal) operation of a building crane.
Observing System Needs and Measurement Options
Measurement needs differ significantly according to the latency requirements of the application. Applications that depend on the current state of the atmosphere largely depend directly on local observations near the ground and aloft. Very short-range forecasts (“nowcasts”)—out to 60 min or so—use increasingly sophisticated heuristic methods that extrapolate current conditions. Beyond a few hours, mesoscale numerical prediction models are initialized with upper-air data from ground-based and space-based profiling and volumetric sampling devices together with boundary conditions provided by smaller-scale (larger domain) models while data assimilation methods optimize the use of these data in the forecast continuum (resulting in significant improvements in NWP performance). The forecast domain between nowcasts and mesoscale forecasts is sometimes filled by blending the two although this temporal gap continues to shrink as the latency of mesoscale prediction models decreases.
The current state of atmospheric measurement networks is mixed. The need for dense networks of near-surface meteorological observations is largely being addressed (NRC, 2009) through a viral effort among state and local authorities although much remains to be accomplished to merge these into a truly nationwide network (of networks). Representative measurements within cities remain a challenge and much remains to be done. Proper siting of automated surface weather stations is inconsistent among existing stations, although Oke (2006) has produced a comprehensive set of guidelines that should assist in improving the siting and characterization of surface meteorological stations in urban areas.
In a recent report of the National Research Council (NRC, 2009), the need for new and improved measurements of various atmospheric and soil
properties was considered in great detail. Table A.3 summarizes some of the findings from that study in the left-hand column and introduces a number of measurement technology options (right-hand column) that can be used to satisfy some or all of the respective data needs. Four of the measurement needs from the NRC study were identified as “highest priority;” these included PBL height; soil moisture and temperature (to a depth of 2m); high-resolution lower-tropospheric profiles of absolute humidity; and air quality concentrations of ozone, particulate matter, carbon monoxide and sulfur dioxide above the atmospheric surface layer (roughly 10% of the PBL height). These four priority needs are included in the upper part of Table A.3. The study also identified a number of needs that are “just below the … highest priorities;” these are shown in the lower half of Table A.3 and include solar radiation, lower-tropospheric (LT) profiles of wind and temperature, surface icing, and surface-layer turbulence. Corresponding measurement technology options are briefly described below (N.B. exemplary references are included throughout although the discussion is neither an inclusive nor definitive review or assessment of the state of the art in measurement technologies).
Radar wind profilers (Carter et al., 1995, Clifford et al., 1994) transmit a short pulse of radio-frequency electromagnetic energy into the atmosphere, where a small fraction is scattered from refractive-index irregularities in the
TABLE A.3 Priority Measurement Needs (NRC, 2009) and Associated Measurement Technology Options
| Priority Measurement Needsa | Measurement Technology Options |
| Height (and structure) of the PBL | Radiosondes; backscatter lidar; radar wind profilers; sodar; commercial aircraft |
| Soil moisture and soil temperature profiles (to 2m depth) | Neutron sensor -cosmic ray absorption |
| High-resolution LT vertical profiles of atmospheric humidity | DIAL and Raman lidar; radiosondes; microwave radiometric profilers; commercial aircraft |
| Air quality concentrations (above the atmospheric surface layer) | DIAL and Raman lidar; tall towers with in situ monitors |
| Solar radiation (direct and diffuse) | Radiometers |
| Vertical LT profiles of wind | Radiosondes; radar wind profilers, Doppler lidar; sodar; commercial aircraft |
| Icing at the ground surface | Lidar (spectral) |
| Vertical LT profiles of temperature | Radiosondes; commercial aircraft |
| Surface turbulence parameters | Sonic anemometry |
NOTE: LT = lower tropospheric; PBL = planetary boundary layer
aFirst-priority needs are above the double line
atmosphere back to the profiler’s antenna. The irregularities are transported with the wind and so act as tracers of air movement. As a result, the frequency of the returned signal undergoes a Doppler shift in proportion to the speed of the wind along the pointing (radial) direction of the transmitted electromagnetic pulse. By alternately pointing the transmitted beam in various directions, the three-dimensional wind vector can be resolved over successive height intervals (ranges). The higher-frequency UHF (~1 GHz) wind profilers can resolve the wind within height intervals ≥ 60 m up to heights of several kilometers. Lower-frequency devices have greater ranges but coarser range resolution. Radar wind profilers operate in all weather conditions. They are also able to estimate the height of the mixing layer and the planetary boundary layer (Cohn and Angevine, 2000) from changes with height in the vertical profiles of the refractive index structure function, the spectral width of the received signals, and the vertical component of velocity.
Sodar (sonic or sound detection and ranging; see Coulter and Kallistratova, 2004) is a radar-like device that emits pulses of acoustic energy, which is scattered back from the atmosphere to a receiver on the ground by means of thermal irregularities in the air. As these thermal irregularities are transported by the wind, sodar can measure the vertical profile of the wind from the Doppler shift of the received acoustic energy. Sodar systems can also estimate the height of the mixing layer from changes with height in the temperature structure function and the vertical component of velocity. So-called mini-sodars have ranges up to a few hundred meters with range-resolution of a few tens of meters while higher-powered systems may profile up to a few kilometers with coarser range resolution.
Atmospheric lidar (light detection and ranging; see Killinger and Menyuk, 1987) refers to a family of profiling devices that emit short pulses of visible, ultraviolet or infrared beams of electromagnetic energy to obtain height-resolved profiles of winds, gaseous molecules or fine particles, depending on the design of the system.
Aerosol (or elastic backscatter) lidars are the simplest type of atmospheric lidar and are typically used to detect cloud properties as well as aerosols in the clear air and in plumes from certain pollution sources. Lidar detects constituents that are equal to and greater than the laser wavelength. In these systems, the backscattered wavelength is the same as the transmitted wavelength. The magnitude of the received signal depends on the backscatter coefficient of the scatterers at a given range and the extinction caused by the scatterers along the path to that range, where the latter is typically the quantity of interest. So-called micropulse lidars (Spinhirne, 1993) utilize narrow-band solid-state lasers in the visible spectrum with very high pulse
repetition rates (several thousand per second) at micro Joule-level pulse energies. They have excellent range resolution (≥5 m) and long range (up to 25km). Another type of backscatter lidar is the ceilometer (Münkel et al., 2006), which was originally developed to measure meteorological ceiling (cloud base height). These systems use low-power wide-band diode lasers that operate at near-infrared wavelengths (~900nm) and high pulse repetition rates (~6.5kHz). Ceilometers can measure cloud base heights up to about 13km and aerosol profiles in urban areas to several kilometers with range resolution ≥ 10m and measurement cycles ≥ 6s.
Profiles of water vapor and trace gases (e.g. ozone, sulfur dioxide, water vapor) can be measured with either of two classes of advanced lidars: differential absorption lidars (DIAL) and Raman scattering lidars. The DIAL technique generally uses two laser wavelengths—typically in the near-infrared spectrum—to determine the range-resolved profile of atmospheric trace molecular species. One wavelength is tuned to an absorption line of the molecular species of interest while the other is tuned to a nearby (“off-line”) wavelength that is weakly (or not) absorbed by the species of interest. The lidar return from the off-line wavelength provides a reference signal for the atmospheric scattering from molecules and aerosols and for any slowly varying ambient absorption that may be common to both wavelengths. Molecular absorption along the “on-line” path attenuates the lidar signal to yield the range-resolved profile of the species. Aerosol profiles are also obtained at the same time from both lidar wavelengths. Raman lidar (Grant, 1991; Whiteman et al., 1992) is also used for measuring the range-resolved concentration of atmospheric gases, and can profile aerosols as well. Raman lidar uses inelastic scattering to single out the gas of interest from other atmospheric constituents. A small portion of the energy of the transmitted ultraviolet light is retained by the gas during the scattering process, which then shifts the scattered light to a longer wavelength according to the gaseous molecule of interest. The magnitude of the backscattered signal is proportional to the concentration of the gas. As with DIAL systems, the Raman technique uses the difference between the transmitted wavelength and the much weaker Raman scattered wavelength to obtain the concentration profile.
The ground-based microwave radiometric profiler (MWRP) is a passive, multi-channel, all-weather instrument (Westwater et al., 2005) that can provide profiles of atmospheric temperature, water vapor (relative humidity), and cloud liquid water; some MWRPs are also flown on satellites and research aircraft. The MWRP observes radiation intensity (brightness temperature) at various microwave frequencies, along with zenith infrared and surface meteorological measurements. State-of-the-art MWRPs have up
to 14 V-band (51 to 59 GHz) microwave channels to retrieve temperature profiles and up to 21 K-band (22 to 30 GHz) microwave channels to measure water vapor. Historical radiosonde and neural network or regression methods are then used to retrieve near-continuous meteorological profiles to heights ≤ 10km (range resolution decreases as range increases).
Radiosondes are balloon-borne devices used operationally to provide twice-daily profiles (soundings) of winds, temperature, humidity, and pressure from the ground surface to pressure altitudes up to 10hPa at nearly 100 sites in the U.S. The radiosonde (Dabberdt et al., 2002; Durre et al., 2006) consists of an expendable unit containing sensors, electronics, and a radio transmitter to telemeter the measurements back to a receiver at the launch station. Data are transmitted at 1Hz (equivalent to 5-8m height differential at launch). Winds are determined from the movement of the radiosonde suspended beneath the balloon using one of several methods: optical tracking, radio tracking, radar tracking, and GPS locating. Pressure, temperature and relative humidity are measured with in situ sensors on the radiosonde.
Commercial aircraft provide tropospheric soundings (Benjamin et al., 2008; Moninger et al., 2010) of winds, pressure, temperature and humidity, as well as aircraft aeronautical data. Two systems—MDCRS and TAMDAR—are in use in the U.S. MDCRS (meteorological data collection and reporting system) was first developed for the Federal Aviation Administration (FAA) and the National Weather Service (NWS) in 1991. MDCRS collects and organizes up to 100,000 real-time, automated position and weather reports (en route, departure and approach) per day from 1500 participating aircraft (typically B757 aircraft). On takeoff, MDCRS data are obtained every 6s for the first 90s, which equates to several hundred meters in the lower troposphere. Unfortunately, MDCRS data in the PBL are often missing. TAMDAR (tropospheric airborne meteorological data reporting) is a commercial system inaugurated in 2004 that uses several hundred regional aircraft (e.g. Saab 340, ERJ, CRJ). During ascent and descent, observations are made at 10 hPa (~100m) pressure intervals up to 200 hPa (1800m). Observations above 200 hPa are made at 25 hPa intervals.
Soil moisture is a key variable in understanding and predicting atmospheric processes, yet representative measurements are difficult to obtain and not widely available. A new measurement method (Zreda et al., 2008) offers much promise; it is based on a technique that uses a Helium-3 neutron detector to measure the absorption of fast neutrons generated in the ground by bombardment from ambient cosmic rays. The amount of absorption is proportional to the moisture in the environment and allows for the measurement of water content in soil and the water equivalent depth of snow.
The method is passive and can yield soil moisture measurements on a scale about 300m radius and 0.5m depth.
Some Additional Considerations
In addition to the users’ information needs and the need for additional and improved surface-based measurements described above, there are at least four other requirements needing attention in the urban zone. These include improved radar and lightning observations, appropriate metadata for all observing systems, effective network-design tools, and urban-regional prototype networks to evaluate and refine observing network designs and predictive models.
The national WSR-88D (or, NEXRAD) S-band Doppler weather radar network (Crum and Alberty, 1993) is a very effective system for storm-scale monitoring for many applications. But it also has limitations (NRC, 2002): it is unable to view precipitation within about three-fourths of the PBL and its scan rate is too slow and its range resolution too coarse for many applications. The multi-university Collaborative Adaptive Sensing of the Atmosphere (CASA) project has been evaluating the effectiveness of small x-band (3cm) radars in a four-node testbed in west-central Oklahoma (McLaughlin et al., 2009). CASA has developed adaptive scanning technologies that are designed to intelligently seek meteorological targets of interest and to optimize their sampling close to the surface. CASA has also demonstrated the value of assimilating these radar observations in NWP models (Xue et al., 2006). Eventually, perhaps thousands of such radars could be placed on buildings and communications towers throughout the nation. At the present time, CASA is planning to expand and move (2012) its Oklahoma testbed to the greater Dallas-Ft. Worth metropolitan area in order to address urban-specific needs and applications (see Appendix B).
In the same way that the existing radar network is not optimal for fine-scale urban needs, neither is the U.S. National Lightning Detection Network (Orville, 2008). The NLDN measures cloud-to-ground (CG) lightning with excellent temporal and spatial resolution but it does not effectively detect in-cloud (IC) lightning, which is typically a very useful antecedent of subsequent hazardous CG strokes and precipitation. Commercial off-the-shelf total (CG + IC) lightning detection systems (Hembury and Holle, 2011) are now available and operating in some locations.
At the present time, there are no full-scale three-dimensional operational or research meteorological measurement networks in existence, although plans are beginning to emerge to establish one or two in the U.S. and China.
These early adaptors (prototypes) will be important for several reasons. They will be great resources for developing the tools to properly and effectively design future measurement networks, including decisions on the optimal mix of observing systems and their geographical distribution. They will also enable rigorous testing of urban-scale predictive models (NWP and nowcasting models alike) and facilitate their improvement. And, perhaps most importantly, they will demonstrate their societal and economic value in terms of better understanding users’ needs for atmospheric information and how best to address them.
References
Benjamin, S. B. D. Jamison, W. R. Moninger, B. Schwartz, and T.W. Schlatter. 2008. Relative forecast impact from aircraft, profiler, rawinsonde, VAD, GPS-PW, METAR and mesonet observations for hourly assimilation in the RUC. 12th Conference on IOAS-AOLS, New Orleans, LA. American Meteorological Society. (January).
Carter, D. A., K. S. Gage, W. L. Ecklund, W. M. Angevine, P. E. Johnston, A. C. Riddle, J. Wilson and C. R. Williams. 1995. Developments in UHF lower tropospheric wind profiling at NOAA’s Aeronomy Laboratory. Radio Science 30(4):977-1001.
Clifford, S. F, C. Kaimal, R. J. Lataitas and R. G. Strauch. 1994. Ground-Based Remote Profiling in Atmospheric Studies: An Overview. Proceedings of the IEEE 82(3).
Cohn, S. A. and W. M. Angevine. 2000. Boundary layer height and entrainment zone thickness measured by lidars and wind-profiling radars. Journal of Applied Meteorology 39(8):1233-1247.
Coulter, R. L., and M. A. Kallistratova. 2004. Two decades of progress in sodar techniques: a review of 11 ISARS proceedings. Meteorology and Atmospheric Physics 85(1-3):3-19.
Crum, T. D., and R. L. Alberty. 1993. The WSR-88D and the WSR-88D operational support facility. Bulletin of the American Meteorological Society 74(9): 1669-1687.
Dabberdt, W. F., and P. A. Davis. 1978. Determination of energetic characteristics of urban-rural surfaces in the greater St. Louis area. Boundary-Layer Meteorology 14:105-121.
Dabberdt, W. F., H. Cole, A. Paukkunen, J. Horhammer, V. Antikainen and R. Shellhorn. 2002. Radiosondes. Pp. 1900-1913 in Encyclopedia of Atmospheric Sciences, Vol. 6, J. R. Holton, J. Pyle, and J. A. Curry, editors. New York: Elsevier Science/Academic Press.
Durre, I., R. S. Vose, and D. B. Wuertz. 2006. Overview of the Integrated Global Radiosonde Archive. Journal of Climate 19(1):53-68.
Grant, W. B. 1991. Differential absorption and Raman lidar for water vapor profile measurements: a review. Optical Engineering 30(1):40-48.
Hembury, N. and R. Holle. 2011. Vaisala LS200: Technological Advancements for VHF total lightning mapping. Southern Thunder Conference, National Weather Center, Norman, OK, July 11-14, 2011. http://www.goes-r.gov/downloads/southern-thunder/2011/session_2/hembury.pdf.
Killinger, D. K., and N. Menyuk. 1987. Laser Remote Sensing of the Atmosphere. Science 235:37-45.
McLaughlin, D., D. Pepyne, B. Philips, J. Kurose, M. Zink, D. Westbrook, E. Lyons, E. Knapp, A. Hopf, A. Defonzo, R. Contreras, T. Djaferis, E. Insanic, S. Frasier, V. Chandrasekar, F. Junyent, N. Bharadwaj, Y. Wang, Y. Liu, B. Dolan, K. Droegemeier, J. Brotzge, M. Xue, K. Kloesel, K. Brewster, F. Carr, S. Cruz-Pol, K. Hondl, and P. Kollias. 2009. Short-Wavelength Technology and the Potential For Distributed Networks of Small Radar Systems. Bulletin of the American Meteorological Society 90 (12):1797-1817.
Moninger, W. M., S. Benjamin, B. Jamison, T. L. Smith, and T. Schlatter. 2010. TAMDAR and MDCRS Impact on RUC forecasts. http://amdar.noaa.gov/docs/TAMDAR_MDCRS_GSD_4Mar10.pdf.
Münkel, C., N. Eresmaa, J. Räsänen and A. Karppinen. 2006. Retrieval of mixing height and dust concentration with lidar ceilometers. Boundary-Layer Meteorology 124:117-128.
NRC (National Research Council). 2002. Weather Radar Technology Beyond NEXRAD. Washington, DC: National Academies Press.
NRC. 2009. Observing Weather and Climate from the Ground Up: A Nationwide Network of Networks. Washington, DC: National Academies Press.
Oke, T. R. 1997. Urban climates and environmental global change. Pp. 273-287 in Applied Climatology: Principles and Practice, R. D. Thompson and A. H. Perry, editors. London: Routledge.
Oke, T. R. 2006. Initial Guidance to Obtain Representative Meteorological Observations at Urban Sites. Report No. 81, WMO/TD-No. 1250. Geneva, Switzerland: World Meteorological Organization.
Orville, R. E. 2008. Development of the National Lightning Detection Network. Bulletin of the American Meteorological Society 89(2):180-190.
Spinhirne, J. D. 1993. Micro pulse lidar. IEEE Transactions on Geoscience and Remote Sensing 31(1).
Westwater, E., S. Crewell and C. Mätzler. 2005. Surface-based microwave and millimeter wave radiometric remote sensing of the troposphere: A tutorial. IEEE Geoscience and Remote Sensing Society Newsletter. March:16-33.
Whiteman, D. N., S. H. Melfi, and R. A. Ferrare. 1992. Raman lidar system for the measurement of water vapor and aerosols in the Earth’s atmosphere. Applied Optics 31:3068-3082.
Xue, M., M. Tong and K. K. Droegemeier. 2006. An OSSE framework based on the ensemble square root kalman filter for evaluating the impact of data from radar networks on thunderstorm analysis and forecasting. Journal of Atmospheric and Oceanic Technology 23(1):46-66.
Zreda, M., D. Desilets, T. P. A. Ferré and R. Scott. 2008. Measuring soil moisture content non-invasively at intermediate spatial scale using cosmic-ray neutrons. Geophysical Research Letters 35(21):0012-0016.
CLIMATE CHANGE AND CITIES OF THE FUTURE
BRIAN STONE, GEORGIA INSTITUTE OF TECHNOLOGY
This presentation covers four principal topics related to climate change and the future of cities. These topics include the characterization of urban heat island (UHI) formation as regional climate change, the significance of land use change to urban climate, the significance of metropolitan spatial structure to the incidence of extreme heat events, and physical design strategies that can be employed to enhance the climate resilience of cities. What follows in this abstract is an overview of each of these four topics.
Heat island Formation as Climate Change
The adoption of alternative definitions of the climate change problem by the international climate science and policy communities has created an
important discontinuity between climate change management at the global and regional levels. Unrecognized by the U.N. Framework Convention on Climate Change definition of human-driven climate change, land surface drivers of regional-scale climate change, such as the urban heat island effect, are not characterized as potential mechanisms for climate change mitigation. The implications of this definitional issue for cities are multifold. Chief among these is a tendency to focus more aggressively on emissions-related mitigation in cities rather than on land-surface drivers of climate change (e.g., reduced albedo and energy balance shifts), which are shown through this presentation to be the dominant driver of warming trends in large U.S. cities over the past half century.
Land Use Change in Cities as a Driver
of Regional-Scale Climate Change
To assess the extent to which regional drivers of climate change, such as UHI, are contributing to warming trends in cities, this presentation reports findings from a study on urban and rural temperatures trends in proximity to 50 of the most populous U.S. cities. Employing data from urban and rural meteorological stations meeting a set of selection criteria, this study derives decadal UHI change trends over the period of 1961 to 2010. The results of this analysis support three conclusions: (1). Land use change is a more owerful driver of observed warming trends than are rising concentrations of greenhouse gases over the last five decades; (2) Urban temperatures are not only higher than proximate rural areas, on average, they are increasing over time at a higher rate; and (3) The extent to which urban areas are amplifying background, global warming trends has accelerated over the last decade. In most large cities of the U.S. urban temperatures are rising at twice the rate of global temperatures, with heat island-related drivers playing the dominant role at this scale.
Land Use Change and the Frequency of Extreme Heat Events
Urbanization is not only driving the extent to which cities are warming in excess of their rural surroundings, it is contributing to a rapid rise in the number of extreme heat events (EHEs) over time. Defined as any day in which the minimum or maximum temperature exceeds the 85th percentile of a long-term average (1961-1990), extreme heat events provide a basis to assess the potential health effects of rising temperatures that accounts for regional population acclimatization to different seasonal temperature ranges.
Previous work has found the 85th percentile of the long-term temperature distribution to be associated with an increase in heat-related health effects.
An assessment of minimum temperature EHEs across 50 large U.S. cities between 1956 and 2005 shows the frequency of extreme heat to be increasing rapidly. During this period, the average number of extreme heat events per year more than doubled, rising from an average of 9 per year to 19 per city. Importantly, the rate of increase in EHEs was found to vary significantly with metropolitan spatial structure. Employing a standard sprawl index, metropolitan regions included in the study were ranked by population density, street connectivity, regional centeredness of land development, and land use mix. Based on these rankings, the frequency of EHEs in the most sprawling cities was found to be increasing at a rate almost three times greater than the most compact cities. Significant correlations between regional rates of deforestation, sprawl rankings, and EHE frequency are suggestive of a linkage between metropolitan land use change and the rising frequency of extreme heat.
Enhancing Urban Climate Resilience
Trends in heat island growth and the frequency of extreme heat in the largest U.S. cities clearly demonstrate the rising threat of climate change to urban populations. Three classes of strategies to manage rising levels of ambient heat in cities are supported by this work and the literature on urban climate change. The first of these entails “sunscreening” strategies, which are intended to abate the radiant and sensible heat load on cities through an increase in vegetative cover, enhancing the latent heat flux, or an increase in the reflectivity of urban surfaces (albedo enhancement). The incorporation of such sunscreening approaches into municipal land development codes is needed to account for climate change management at each stage in the development process. “Green area ratios,” requiring all development and redevelopment projects to meet minimum standards of vegetative cover and/ or albedo, provide a promising planning tool for urban heat management. A second set of strategies focuses on the implications of regional land cover for the pace of warming trends throughout a metropolitan region. Characterized as “greenbelting,” such strategies focus on protecting and regenerating natural land covers in proximity to urban centers to address the influence of regional deforestation on heat island formation. Urban growth boundaries and “redfield to greenfield” initiatives—programs focused on the acquisition and conversion of defunct development projects to greenspace—provide viable policy approaches to increasing greenspace in proximity to urban
centers. A final component of urban climate resilience entails the energy conservation and efficiency strategies effective in reducing waste heat emissions from fuel combustion and building climate control. Characterized as “carbon cooling” due to the potential for energy reduction programs to address both the local and global drivers of climate change, such strategies are the most common approach to climate management at the urban scale today. Carbon cooling strategies prioritize emission control techniques that carry the associated benefits of climate change adaptation in cities. Such “adaptive mitigation” projects represent a critical linkage between climate management policy at the regional and global levels.
In response to the organizing theme of the meeting, a number of meteorological data needs are suggested by the presentation. The first and most pressing of these is the need for a more dense array of first-order meteorological stations in and in proximity to urban areas. Data on heat island trends is unavailable for many large metropolitan regions due to the absence of a continuous and reliable temperature record at a minimum number of rural sites in proximity to urban centers.
A second data need and one related to the first are improved methods for assessing the extent to which rural meteorological stations are subject to the impacts of local land use change. Nonstandard siting of instrumentation and significant changes to rural land cover, such as resulting from nearby deforestation or agricultural activities, have been found to be a significant influence on rural temperature trends used for baseline development in heat island research. Enhanced evaluation and enforcement of siting requirements across all meteorological stations is needed to improve the reliability of urban and rural climate trends that are increasingly significant to public health.
Finally, higher resolution modeling tools are needed to assess the combined impacts of global and micro-scale climate drivers on extreme heat in cities. At present, downscaling methods employed with global circulation models support a maximum resolution that is often too coarse for integration with meso and microscale climate models that are most responsive to urban land use conditions.


