
Various reports have discussed the critical role of urban meteorological observations and forecasting for various aspects of society, such as public health, public safety and security, transportation, water resource management, storm water runoff, and economic development. Although some progress is evident since these reports, cities still pose a number of difficult challenges for both the scientific and end user stakeholder communities that are not adequately addressed by current meteorological observation, forecasting, and information dissemination technologies. This chapter assesses current capacity, emerging technologies, and future needs related to observing, modeling, and forecasting in the urban environment. A brief review of current urban meteorological knowledge is appropriate to provide context for the issues at hand.
As with broader weather systems (i.e., floods, thunderstorms, blizzards, and hurricanes), urban meteorological processes are directly relevant to societal activities and can significantly affect economic, hazard management, and public-health decision-making. For example, in 2010 and again in 2011, the capital of the United States, Washington, D.C., was crippled by record-breaking snowstorms. Scores of federal workers and even the President experienced transportation and work delays as a result.
During the summer of 2010, the country experienced record-breaking urban flooding in places like Atlanta, Georgia, Nashville, Tennessee, and Oklahoma City (Shepherd et al., 2011). In 2011, the south central U.S. experienced extended periods of very extreme heat (>100 degrees Fahrenheit) for days on end. During this regional-scale heat wave event, urban heat islands in cities like Dallas and Oklahoma City likely caused prolonged heat exposure at night (Figure 3.1). Lessons from the 2003 European Heat Wave and the 1995 Chicago Heat wave (Changnon et al., 1996; Menne, 2003; Beniston, 2004) have indicated that heat mortality is exacerbated by excess heat stored in urban landscapes—the well-known Urban Heat Island (UHI) effect.
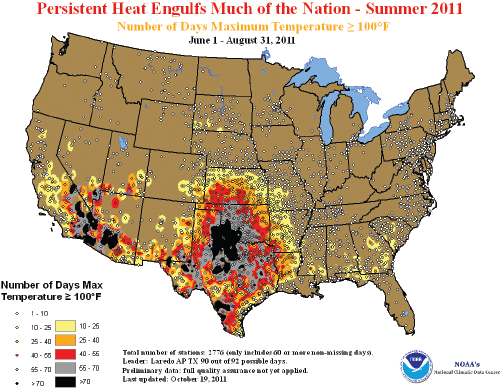
FIGURE 3.1 Number of days that maximum temperature exceeded 100 degrees (F) from June 1 to August 31, 2011. Urban heat islands in cities like Dallas and Oklahoma City likely caused prolonged heat exposure at night. SOURCE: NOAA.
There have been many reports that highlight the effects of anthropogenic greenhouse gases on future weather and climate and a very clear sign of human alteration to atmospheric processes is evident (NRC, 2010b; NRC, 2011b; IPCC, 2007; USGCRP, 2009). There is also emerging interest in understanding the role of urbanization on the climate system, which includes weather (IPCC, 2007).
Cities change properties of the land surface and subsurface, and are also known to influence atmospheric circulation patterns at various spatial scales (Hidalgo et al., 2008; Grimmond et al., 2010b). The high building densities and sparseness of vegetation in cities makes urban surfaces
typically much rougher and drier than rural surfaces. In addition, the three-dimensional nature of urban environments affects a number of parameters such as evaporation rates, absorption and reflection of solar radiation, and storage of heat, as well as wind and turbulence fields (Figure 3.2). Gaseous and particulate matter emissions (Figure 3.3) also may contribute to land-atmosphere interactions. Classifications for urban land cover zones have been developed (Stewart and Oke, 2009 a, b) that are useful for documenting metadata of urban monitoring sites and for characterizing surface features in urban modeling tools.
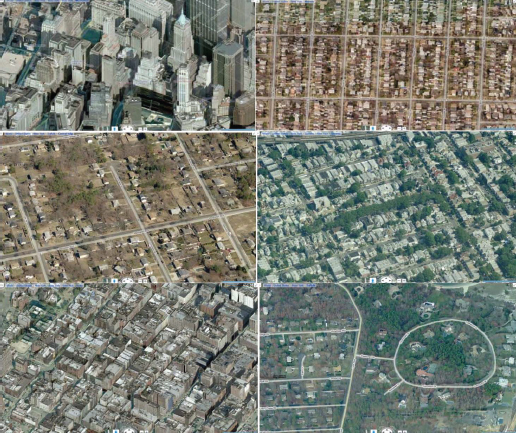
FIGURE 3.2 Variability of land cover zones in New York City characterized by: differences in surface morphology, percentage of surface cover, and sources of heat, water, other gases, and particulates. SOURCE: Sue Grimmond and Bing Maps.
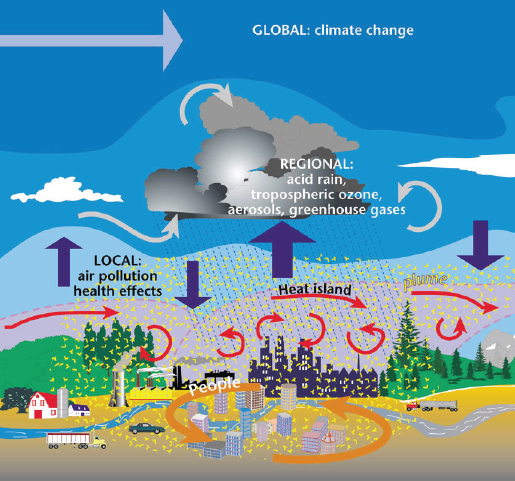
FIGURE 3.3 Urban-atmosphere interactions. SOURCE: adapted from Hidalgo et al., 2008. ©John Wiley & Sons Ltd. Reprinted with permission.
Overall, urbanization results in a suite of complex land surface atmosphere interactions that modify thermodynamic, radiative, dynamic, and hydrometeorological processes within the urban area and its surrounding regional footprint, particularly downwind of the city. Extreme weather and climate events in cities typically occur during unfavorable regional-scale conditions exacerbated by global warming trends and local, urban effects (Hunt et al., 2007). As an example, regional-scale heat waves, which are
expected to become more frequent because of climate change, in combination with urban heat island development, exacerbate heat stress for urban populations (Zhou and Shepherd, 2009; Stone et al., 2010). Seto and Shepherd (2009) noted that “the built environment characterized by urbanization is a significant forcing function on the weather climate system because it is a heat source, a poor storage system for water, an impediment to atmospheric motion, and a source of aerosols (e.g., pollutants).” Table 3.1 illustrates several pathways by which urban processes can influence meteorology or climate.
URBAN METEOROLOGY: A SYNOPSIS OF THE SCIENCE
The urban heat island’s role on regional and global climate has been the subject of much research (Oke, 1982; Arnfield, 2003; Roth, 2007; Yow, 2007; Hidalgo et al., 2008; Grimmond et al., 2010b) and is one of the most well-studied and familiar manifestations of urban weather modification (Figure 3.4). Research shows that it is spatially correlated with regional land-use and land-use change. During the early phases of urban development, multiple land covers—bare land, vegetated areas, agricultural plots, and built-up areas—emerge in close proximity with each other.
As urbanization increases, resulting in reduced vegetated surfaces, the spatial pattern of the urban heat island becomes less scattered and more intense (Imhoff et al., 2010). Stone et al. (2010) recently argued that temperature increases in sprawling urban environments were as likely (or more likely) to be attributed to urban landscape changes as greenhouse gas warming (see Stone abstract in Appendix A). It should, however, be noted that the types of data used to define UHI characteristics play an important role, and the discussion of UHI often lacks important information about data sources and site characteristics (Stewart, 2011). In situ observations of air temperatures from measurement sites within the urban canopy layer provide information about the urban-canopy-UHI. Remotely sensed observations provide information about boundary-layer heat islands (above the urban canopy layer in the atmosphere) and surface heat islands.
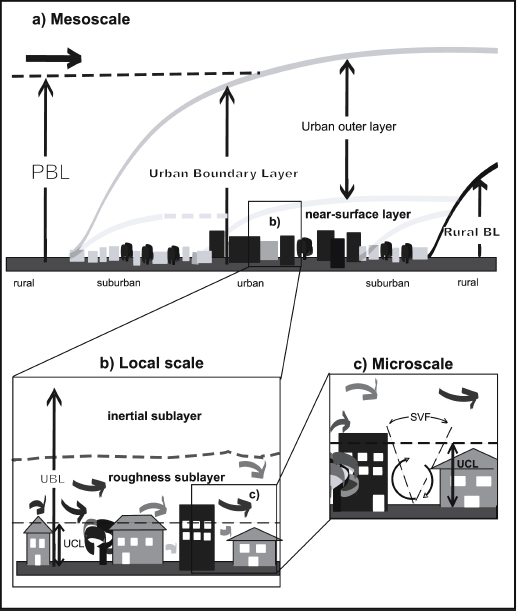
In general, weather patterns in and near cities depend both on the degree of urbanization—characterized by the above mentioned changes in land surface characteristics, subsurface properties, and chemical composition of the atmosphere—and on larger scale meteorological conditions (Mestayer and Anquetin, 1995). For situations with moderate-to-high wind speeds, an urban plume with warmer, polluted air is advected downwind of the city (Figure 3.3). Under such conditions, the lowest portion of the urban boundary layer (UBL), the surface layer, can be divided into two main
TABLE 3.1 Various Pathways for Urbanization to Affect the Weather Climate System
The column headings represent three ways that urban environments can affect weather and climate. The row headings represent different weather processes affected by each of the three. For example, urban land cover affects/causes an urban heat island because urban land cover modifies the surface energy budget gradients—develops and dominates the RSL wind and turbulence patterns. This shear layer also controls the turbulent exchange and ventilation between the UCL and the flow above average roof level, which is typically highly instantaneous and controlled by coherent structures (Christen et al., 2007). Overall, the RSL plays a critical role, and its properties need to be properly resolved in numerical models for accurate urban weather and air-quality forecasts.
| Urban Land Cover | Urban Aerosols | Anthropogenic Greenhouse Gas (GHG) Emissions | |
| Urban Heat Island and Mean Surface Temperature Record | Surface Energy Budget | Insolation, Direct Aerosol Effect | Radiative Warming and Feedbacks |
| Wind Flow, Dispersion, Transport, and Turbulence | Surface Energy Budget, Urban Morphological Parameters, Mechanical Turbulence, Bifurcated Flow | Direct and Indirect Aerosol Effects and related dynamic/thermodynamic response, Dispersion and Transport | Radiative Warming and Feedbacks |
| Clouds and Precipitation | Surface Energy Budget, UHI Destabilization, UHI Meso-circulations, UHI-induced convergence zones | Aerosol indirect effects on cloud-precipitation microphysics, insolation effects | Radiative Warming and Feedbacks |
| Land Surface Hydrology | Surface runoff, reduced infiltration, less evapotranspiration | Aerosol indirect effects on cloud microphysical and precipitation processes | Radiative warming and feedbacks |
| Carbon Cycle | Replacement of high net primary productivity (NPP) land with impervious Surface | Black carbon aerosols | Radiative warming and feedbacks, fluxes of carbon dioxide |
| Nitrogen Cycle | Combustion, fertilization, sewage release, and runoff | Acid rain, nitrates | Radiative warming and feedback, NOx emissions |
a SOURCE: Adapted from Seto and Shepherd, 2009.
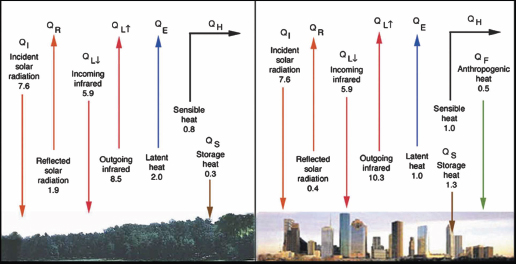
FIGURE 3.4 A qualitative description of typical rural and urban surface energy balance processes. The values are in units of kW h m2 day-1. Figure courtesy of R. Sass, Rice University. SOURCE: Shepherd, 2005. © Earth Interactions. Reprinted with permission.
sublayers (Figure 3.5): the roughness sublayer (RSL) and the inertial sublayer (ISL). The RSL typically extends from the surface to a height equivalent to 2-5 times the average building height (Raupach et al., 1991; Rotach, 1999; Kastner-Klein and Rotach, 2004). The layer below average roof level, the lowest portion of the RSL, is often referred to as urban canopy layer (UCL). Within the UCL, atmospheric patterns are spatially inhomogeneous, strongly influenced by local effects, and very hard to predict (Klein et al., 2007; Vardoulakis et al., 2003). At the same time, the UCL is the region where most of the urban anthropogenic emissions of atmospheric pollutants occur and where people spend most of their time, and is thus of great relevance. In the upper part of the RSL, above average roof level, a strong shear layer—a layer with high wind velocity gradients—develops and dominates the RSL wind and turbulence patterns. This shear layer also controls the turbulent exchange and ventilation between the UCL and the flow above average roof level, which is typically highly instantaneous and controlled by coherent structures (Christen et al., 2007). Overall, the RSL plays a critical role, and its properties need to be properly resolved in numerical models for accurate urban weather and air-quality forecasts.
For large-scale weather patterns with weak dynamic forcings (i.e., weak winds), urban flow patterns are primarily thermally driven, and a dome-like circulation pattern develops in cities that are located in flat terrain and away from large water bodies. Canopy-layer UHI signatures are typically strongest under such conditions, with the highest values recorded at night. Historical and current literature has also persistently shown that UHI destabilization, urban surface roughness, and pollution can independently or synergistically initiate, modify, or enhance precipitation cloud systems. The so-called “urban rainfall effect” is clearly established in the literature; the majority of studies note an enhancement of rainfall in warm season convection (Changnon et al., 1981; Bornstein and Lin, 2000; Shepherd et al., 2010). However, there is discourse about the sign of precipitation change (i.e., the increase or decrease of precipitation) associated with urbanization and what physical mechanisms are of primary significance (Ashley et al., 2011; Shepherd et al., 2010). Studies continue to verify that urbanization may also modify lightning (Rose et al., 2008), freezing rain (Changnon, 2004), and snowfall climatologies (Shepherd et al., 2010) as well. Further, urban land use accelerates hydrologic response through surface runoff variability and stresses on conveyance systems (Shepherd et al., 2011; Villarini et al., 2010a; Reynolds et al., 2008) and thus amplifies urban flooding risks.
Human activities in urban areas (e.g., transportation, energy, and industrial processes) result in the production of “urban” aerosols or pollution which is associated with increased greenhouse gas emissions. Although urban areas have significantly higher carbon dioxide concentrations than in rural areas, greenhouse gas emissions per capita may be lower for urban dwellers than those for rural dwellers (Dodman, 2009). Jacobsen (2010) has recently discussed the implications of urban carbon domes on public health and the climate system. Urban modification of winds, temperature, and turbulence (including mixing height) affect the concentration, dispersion, and transport of atmospheric pollutants which, in addition to higher emission rates, contributes to poor air quality in cities (Grimmond et al., 2010b). Numerous studies have focused on predicting and reducing urban air pollution, yet deficiencies in both observational and modeling capacity are still evident (NRC, 2004). Ozone and particulate matter (up to 2.5 and 10 micrometers; PM2.5 and PM10) concentrations still exceed the National Ambient Air Quality Standards (NAAQS) in many metropolitan areas, and millions of people in the U.S. live in so-called non-attainment areas (EPA, 2012). Beyond conventional air quality concerns, accidental and intentional releases of chemical, biological, or radiological pollutants in cities remain as potential threats and pose particular challenges. Emergency-response
forecasting necessitates models that capture essential features of urban flow and dispersion processes and provide fast exposure predictions. The NRC (2003b) concluded that no model system exists that fulfills all critical requirements for emergency response.
Aerosols affect climate, directly and indirectly, through radiative forcing (Kaufman et al., 2005). The “direct” radiative effect of aerosols is to scatter, reflect, or absorb solar radiation. Most aerosols, including sulfates found in urban environments, promote a cooling effect in the radiative budget; however, carbon-based aerosols absorb solar radiation and may warm the atmosphere and surface. Such warming can affect the atmospheric stability profile and thereby alter cloud and precipitation development. Climate-aerosol interactions are quite complex and beyond the scope of this discussion, but it is clear from emerging literature that the negative and positive effects associated with the urban production of aerosols must be placed in the context of scale: local (or urban), regional, and global. For example, aerosols augment UHI-effects (mainly in the surface or boundary layer) on temperature through direct interactions with solar radiation (Jin et al., 2011). Anthropogenic aerosols also act as condensation nuclei or “seeds” for cloud microphysical processes (Rosenfeld et al., 2008). This so-called “indirect effect” of aerosols further perturbs the radiation budget, cloud distribution, and precipitation variability.
Souch and Grimmond (2006) and Grimmond et al. (2010b) provide very comprehensive assessments of current knowledge, gaps, and needs within the urban weather climate community. Expanding on these assessments, the current state of urban observational and modeling techniques in research and operations, emerging technologies, and remaining needs and challenges for urban meteorology were discussed at the workshop. The following section summarizes these discussions and relevant literature.
ADVANCES IN URBAN FORECASTING
AND MONITORING TECHNIQUES
Meteorological observations and modeling are tightly coupled and require continual emergence of new understanding, measurements, and technology (Dabberdt abstract in Appendix A). The measurements needed for particular meteorological processes are typically a function of the spatiotemporal scale of the process, the latency requirements of the application, and technological capacity. Shorter-range forecasts (< 60 minutes) may rely on heuristic methods involving extrapolation, but beyond this time period
(and even inclusive of it), numerical weather prediction is the primary mechanism for forecasting. These models require detailed four-dimensional representation of the atmosphere provided by surface in situ measurements, surface-based remote sensing systems, upper air soundings, and satellite data (often through data assimilation techniques).
In cities, meteorological observations and forecasting become even more complex because of the high spatial variability, unique physical characteristics of the urban canopy and its impacts on various processes, and challenges with model initialization. Although such challenges exist, over time there have been several key advances in urban forecasting and monitoring. Some of the key advances that have emerged in the past 10-20 years in the observational and modeling communities are highlighted here.
Monitoring and Observations
Urban Campaigns
The need for urban data sets has been recognized by the scientific community. A number of major field campaigns have been successfully completed in the United States (e.g., Salt Lake City, Allwine et al., 2002; and Oklahoma City, Allwine et al., 2004) and Europe (e.g., London, UK, Arnold, et al., 2004; Basel, Switzerland, Rotach, 2005; and Marseille, France, Mestayer et al., 2005). Grimmond (2006) provides an overview of progress in urban observations which includes references to additional studies. Most of the urban observation studies were short-term measurement campaigns that provided data sets for a limited range of environmental conditions. Improving models to predict dispersion of hazardous material within the urban atmosphere was the major objective for many of these studies (Hanna et al., 2007; Hanna and Baja, 2009), but the data sets have also served for evaluation studies (Liu et al., 2006; Lemonsu et al., 2009) of urban surface-energy balance parameterizations and urbanized mesoscale models. In addition, these studies have provided new insights about the structure of the UBL, the impact of atmospheric stability on mean and turbulent processes within the UBL, and fundamental properties of turbulence within the RSL (Christen et al., 2007; Klein and Clark, 2007; Nelson et al., 2007b, 2011). These efforts further document the significance of urban observations in the urban surface layer and the whole boundary layer for advancing research and operations in urban meteorology. It is critical that efforts be undertaken to sustain and ease access to these datasets and to promote initiatives for future urban studies.
Urban Observation Networks
Two National Research Council (NRC) reports (2008, 2010a) emphasize the need for better observations of boundary-layer profiles and for urban testbeds that integrate in situ and remote sensing observations with modeling efforts and promote opportunities for various stakeholders to provide input and to participate. The committee endorses the recommendation that “urban testbeds are needed in cities with widely different annual climates” (NRC, 2010a) and agrees that testbeds provide an opportunity for interdisciplinary cooperation, learning how to interact and identifying appropriate communication practices between end user and forecasting/monitoring communities. For a detailed discussion of urban testbeds, see Chapter 4 and Appendix B. A need for appropriately-sited urban monitoring stations and methodologies for the design of three-dimensional urban networks was also recognized. The World Meteorological Organization (WMO) guidelines for urban surface monitoring sites (WMO, 2008) are a first, important step towards urban network design, and widespread implementation of these guidelines could lead to more appropriately-sited urban monitoring stations.
Since many of the remote sensing instruments that are needed to obtain profiles of atmospheric variables over the whole depth of the UBL have emerged or significantly advanced during the last decade, more detailed information about these types of sensors are provided below.
Ground-Based Remote Sensing
Several ground based remote sensing capabilities have emerged. Many of these systems have advanced our knowledge in urban meteorology and revealed potential opportunities and pathways forward. Dabberdt (Appendix A) highlights many of these systems, and a recent book by Emeis (2011) provides technical details about surface-based remote sensing instruments for profiling of the atmospheric-boundary layer as well as examples of successful operation of these instruments. The reader is referred to these resources for detailed descriptions of the instruments briefly described in the following.
Scanning Radars The emergence of the national Weather Surveillance Radar 88 Doppler (WSR-88D or, Next-Generation Radar, NEXRAD) weather radar network has significantly improved capacity for monitoring and quantifying precipitation and storm-scale monitoring in the urban environment. The WSR-88D system is limited for urban meteorological use due to gaps in boundary layer coverage, scan rate, coarse range resolution, and
precipitation type determination (NRC, 2002). The National Weather Service (NWS) is currently rolling out its dual-polarization Doppler radar systems. Full deployment began in September 2011.1 Dual-polarization systems will provide improved precipitation estimation and discrimination of precipitation type. Additionally, testbeds involving the multi-university Collaborative Adaptive Sensing of the Atmosphere (CASA) project are showing promise (Appendix B).
Radar Profilers and Sodar Radar wind profilers are systems that transmit pulses of electromagnetic energy into the atmosphere vertically. They are capable of measuring mixing layer height, the planetary boundary layer and the vertical component of velocity. These attributes are ideal for urban meteorological monitoring. Sodars are similar to radar wind profilers but emit sound or pulses of acoustic energy. They can provide measurements of the vertical profile of the wind, mixing layer height, and vertical velocity. They provide very useful measurements of the lower boundary layer, but applications in urban areas are limited due to the noise emitted by the sodar, as well as low signal-to-noise ratios caused by urban background noise from vehicular traffic and other sources.
Lidar Atmospheric lidar (light detection and ranging), as noted by Dabberdt (Appendix A), “refers to a family of profiling devices that emit short pulses of visible, ultraviolet or infrared beams of electromagnetic energy to obtain height-resolved profiles of winds, gaseous molecules, or fine particles, depending on the design of the system.” Aerosol (or elastic backscatter) lidars detect cloud and aerosol properties. Ceilometers measure cloud base heights and urban aerosol profiles. Profiles of water vapor and certain trace gases (e.g., sulfur dioxide, ozone) are measured by two classes of advanced lidar systems: Raman scattering and differential absorption (DIAL). Airborne lidars are also widely used nowadays to scan the earth’s surface, and data from such scans provide important information about urban surface characteristics for urban weather and air quality models (Ching et al. 2009a,b).
Radiometric Profilers Ground-based microwave radiometric profilers are passive, multi-channel, all-weather systems that can measure profiles of atmospheric water vapor, temperature, and cloud liquid waters. Similar systems may also be flown on aircraft or satellite systems.
____________
Lightning detection Emerging knowledge about the role of urban environments and lightning drives the need for lightning detection capability. The National Lightning Detection Network (Orville, 2008) measures cloud-to-ground (CG) lightning but does not detect intra-cloud (IC) lightning, which is often a useful predictor of subsequent CG strokes and heavy precipitation. Some commercial total (CG+IC) lightning detection systems (Hembury and Holle, 2011) have emerged and are operational (Dabberdt abstract in Appendix A).
Airborne/Spaceborne Remote Sensing
Airborne and spaceborne data have proven to be very advantageous in many aspects of the urban meteorological observations and prediction. These systems have been useful in assessing the extent and magnitude of the urban heat island, identifying urban rain- and snowfall anomalies, and diagnosing air quality (Seto and Shepherd, 2009). Additionally, airborne and spaceborne data help properly characterize urban land cover and morphology which is important for coupled meteorological systems.
Urban Land Cover Several remote sensing methodologies have emerged to delineate urban land cover. Satellite imagery comes from an array of platforms and instruments over the past 40 years. The earliest generation of satellites (1963 to 1972), such as Corona, Argon, and Lanyard, were limited in resolution and capability, but after 1972 several improvements led to an explosion of resources: Landsat (Derived from Land Satellite), SPOT (Satellite Pour l’Observation de la Terre), and IRS (Indian Remote Sensing Satellite). More recently, a third generation of satellites with very high geometric resolution (IKONOS-2, Quickbird-2, etc.) (Maktav et al., 2005; Mitra et al., 2011) has emerged. Imhoff et al. (1997), Sutton (2003), and Sutton et al. (2006, 2010) applied nighttime satellite imagery, typically from the DMSP OLS (Defense Meteorological Satellite Program Operational Linescan System) image to map urban areas and sprawl. Nighttime imagery can be beneficial over daytime imagery because it measures emitted rather than reflected radiation, avoiding classification problems in separating developed vs. nondeveloped land cover (Sutton, 2003). There are also several hybrid techniques involving many of the aforementioned data sources as well as population or economic data.
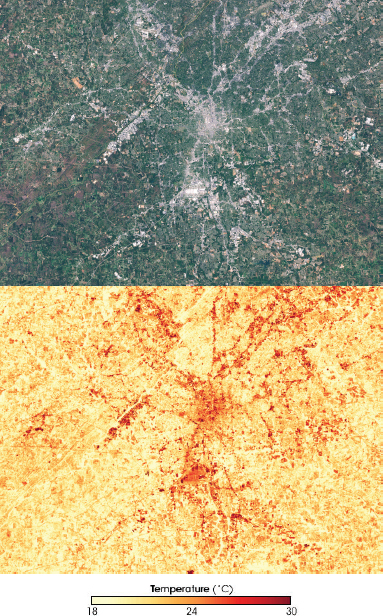
Thermal imaging and UHIs Voogt and Oke (2003) provide an overview of how thermal remote sensing has been used to study urban climate, with a particular focus on UHI. Such techniques, both airborne and spaceborne,
have been useful in characterizing the magnitude and extent of the UHI, land cover, and input for modeling systems connecting the atmosphere and land surface. Voogt and Oke (2003) argued that thermal techniques are needed to advance beyond descriptive studies of patterns and correlations. They also predicted that improvements in spatial and spectral resolution in contemporary and future satellite/airborne-based sensors would provide important breakthroughs. Figure 3.6 is a high-resolution visible and thermal characterization of the urban land cover and heat island signature of Atlanta, Georgia. Imhoff et al. (2010) recently demonstrated the value of impervious surface area from the Landsat TM and land surface temperature (LST) from Moderate Resolution Imaging Spectroradiometer (MODIS) in determining the UHI skin temperature and its relationship to both urban development and ecology. Such information is invaluable for observational analysis, model initialization, and decision making. Other advanced thermal sensors like Advanced Spaceborne Thermal Emission and Reflection Radiometer (ASTER) are also valuable for urban climate applications.
Aerosols Kaufman et al. (2005) discuss how satellite-based datasets have evolved to observe aerosols, air quality, and atmospheric pollution. They provide a historical context, noting earlier methods, and describe the TOMS (Total Ozone Mapping Spectrometer) instruments, which use two channels sensitive to ultraviolet light and have been in operation since 1979. POLDER (Polarization and Directionality of the Earth’s Reflectances, Sano et al., 2009) was specifically designed for aerosol measurements and uses several spectral channels (0.44-0.86 m). It can also detect light polarization associated with land-based fine aerosols. Since 2000 MODIS and MISR (Multi-angle Imaging Spectroradiometer) have also provided global aerosol data to the scientific community (see Jin and Shepherd, 2008; Yu et al., 2006). MODIS leverages multi-spectral information, while MISR utilizes reflected light from multiple viewing angles to disentangle aerosol signals from surface reflectance. The ASTER instrument is another spaceborne instrument that also provided aerosol information (Wen et al., 2007).
The NASA-“A-Train” is a notable example of satellite remote sensing capacity for urban meteorological studies (Anderson et al., 2005; Yu et al., 2006). This system carries a full complement of satellite instrumentation for measuring aerosols, clouds, greenhouse gases, and other atmospheric variables. NASA and other agencies have recently explored the ability to quantify particulate matter (e.g. PM2.5) from space (NASA/EPA/NOAA, 2011). Similar spaceborne capabilities are emerging from NASA counterparts in other countries as well.
Hydrometeorological Parameters Shepherd et al. (2002) and Hand and Shepherd (2009) pioneered the use of space-borne precipitation measurements from the Tropical Rainfall Measurement Mission (TRMM) and associated merged products (i.e. blending TRMM data with other passive microwave and geosynchronous infrared datasets). These studies have revealed that space-based precipitation measurements can provide a credible methodology for simultaneously investigating potential urban rainfall effects for multiple cities. The Global Precipitation Measurement (GPM) mission (circa 2014 launch) will further extend such measurements. The NASA Land Information System (LIS) is a satellite-based modeling and land data assimilation system that resolves key elements of the land-atmosphere interface (Kumar et al., 2006).
While Landsat and MODIS are somewhat common to urban researchers and stakeholders, other systems (e.g., TRMM, GPM) and their potential capabilities remain relatively obscure beyond their discipline-specific communities. Additionally, there are still deficiencies in resolution, data latency, and data interoperability that limit utility beyond research communities.
Modeling Systems
The urbanization of four types of models discussed here has improved the forecasting of weather and climate (e.g., temperature, wind speed, rainfall, and cloud cover), atmospheric dispersion and air quality (e.g., concentration of gaseous pollutants and particulate matter), hydrological events (e.g., urban flooding), and coastal storm surge inundation in urban areas. Additionally, emerging modeling technologies that focus on coupling of models from global down to the microscale, or target specific end user applications such as exposure assessments and urban planning tools, are discussed later in this chapter.
Urbanization of Numerical Weather Prediction Models
One of the most important advances in urban meteorological forecasting in the last decade has been the development of urban surface energy balance and urban canopy models for Numerical Weather Prediction (NWP) models. Given the significant increases in computing resources over the last decades, NWP models can now be run at horizontal resolutions down to a few kilometers; that is, cities can cover a significant number of grid cells in the modeling domain. The better resolution of cities in NWP models also requires modifications to the model physics to account
for the urban effects on evaporation rates, absorption and reflection of solar radiation, and storage of heat, as well as wind and turbulence fields. Masson (2006) and Martilli (2007) provide overviews of various approaches to “urbanize” NWP models. One of the simplest urbanization techniques is to use empirical models, such as the local-scale urban meteorological parameterization scheme (LUMPS; Grimmond and Oke, 2002; Loridan et al., 2011). Such schemes are computationally efficient, but a large amount of observational data (from multiple cities) may be necessary to develop robust empirical relationships.
Another common approach in operational urbanized models is to use urban canopy models (UCM) embedded within the NWP model. These schemes either model the urban canopy effects of streets and buildings using a slab (or single layer) or multiple layers. Recent model evaluation and intercomparison studies demonstrated that the implementation of multiple-layer schemes does not necessarily increase the predictive skill of surface energy balance parameters (such as sensible and latent heat fluxes) over simpler slab schemes (Grimmond et al., 2011). One hypothesis for a lack of increase in skill is due to the myriad of parameters necessary to characterize the building, road, and wall effects. Recent work by Salamanca et al. (2011) illustrated that urban parameterizations within NWP models are sensitive to the urban canopy parameters that define the urban morphology.
While most of the urbanization efforts have focused on mesoscale models, a parameterization for urban surfaces has recently been implemented into the Community Land Model as part of the Community Climate System Model (Oleson et al., 2010b). This allows global simulations of future climate with more realistic predictions of urban heat islands and temperatures in cities.
Weather services worldwide (UK MetOffice, Best et al., 2006; Meteo-France, Masson, 2000, 2006; and Environment Canada; Mailhot et al., 2006) have successfully implemented or are currently testing versions of urban surface parameterizations of varying complexity with their operational models. Chen et al. (2011) document the efforts for developing an integrated urban modeling system for the Weather Research and Forecasting (WRF) Model.
As a result of these efforts, three different urban canopy parameterizations (a bulk approach, a single-layer canopy model, and a multi-layer canopy model) were integrated into WRF and evaluated against various urban data sets. While this modeling system provides a great tool for various applications, its transition into operations needs to be further explored. Further model improvements are needed, as well as a concept of operations for the deployment and utilization of an operational version. Evaluations and
transition into operations of the urbanized WRF would need to be actively pursued to close the current gap between models used in operations by the U.S. weather service and weather services in Europe and Canada. Within several agencies in the U.S. (e.g. Department of Homeland Security, DHS) building-resolving modeling suites have been developed and evaluated against data sets from urban field campaigns. These models have the potential to provide high-resolution data sets, but little is known about these models, and they are not easily accessible to various end user communities. There should be a “call for sharing” and coordination as it cannot be afforded that these resources remain underutilized.
Atmospheric Dispersion and Urban Air Quality Models
Two areas in which model development has been specifically targeted for improving the decision-making capabilities of end users are urban air quality (AQ) and urban transport and dispersion (T&D). Baklanov et al. (2009) give an overview of recent progress of meteorological and air quality models for cities. Such models play a key role in protecting people, the natural environment, and urban infrastructures from negative impacts of elevated air pollution levels in cities. Urban air quality and dispersion of atmospheric pollutants are strongly influenced by wind, temperature, and turbulence patterns in cities, and depending on the type of problem, spatial scales can vary from street, neighborhood, city, and regional scales (Britter and Hanna, 2003; Figure 3.7). Recent studies have also focused on the interactions of urban pollution and transport of air pollutants on continental and global scales (Holloway et al., 2003; Fenger, 2009).
In the United States, a recent collaborative effort between the National Oceanic and Atmospheric Administration (NOAA) and Environmental Protection Agency (EPA) focused on coupling of NWP models with chemical transport models such as Community Multiscale Air Quality (CMAQ; Byun and Schere, 2006) to develop the real-time National Air Quality Forecast Capability (NAQFC) (Otte et al., 2005; Eder et al., 2009). The system was first operational in 2004 for the northeast part of the country and initially provided next-day forecasts of surface-level ozone (O3) concentrations (both 1-h and 8-h averages) at a 12-km resolution. Since then, several upgrades have been made to the NAQFC, and the spatial domain was extended to the contiguous U.S. and bordering areas (Eder et al., 2006, 2009; Figure 3.8).
Within the NAQFC system, the chemical transport model (CMAQ) uses output from the meteorological models in an “offline” approach. In other words, transport and dispersion of pollutants are driven by the
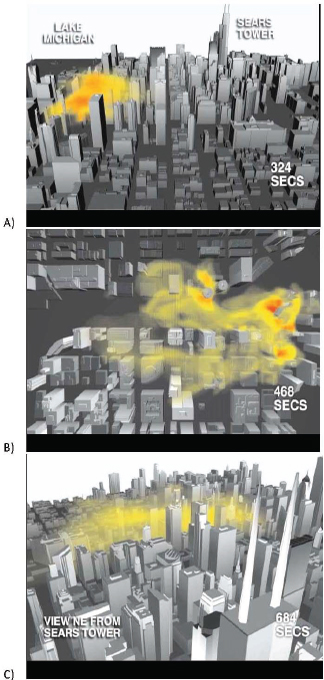
FIGURE 3.7 Different views of a contaminant cloud from a FAST3DCT simulation of downtown Chicago. (A) view of contaminant release looking east toward downtown Chicago and the Sears tower. (B) overhead view of contaminant concentrations over Chicago River. (C) view of contaminant from the Sears tower. These panels show that the contaminant is lofted quickly above the tops of the majority of the buildings. This vertical dispersion of the contaminant results from the geometry of the buildings producing vertical lee-side vortices that draw pollutants from street level to above the tops of the structures. SOURCE: Patnaik et al., 2005.
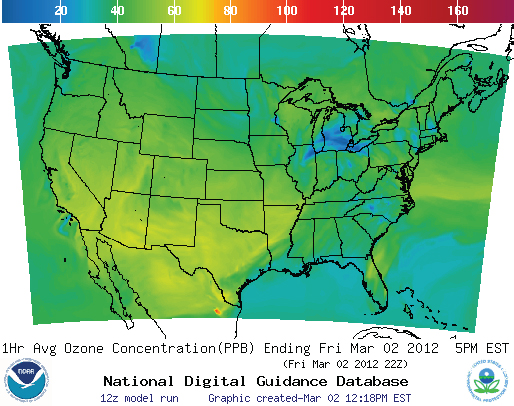
FIGURE 3.8 An example of NOAA’s Air Quality Forecast National Digital Guidance Database for the maximum 1-h O3 concentrations, depicting the WRF-CMAQ modeling domain, available at www.weather.gov/aq/. SOURCE: NOAA.
meteorological model output (typically updated every 30 to 60 min), but there is no feedback from the chemical transport model to the meteorological model. This one-way coupling between chemistry and meteorology ignores important feedback processes (e.g. aerosol feedbacks from CMAQ to the radiation budget, cloud microphysics, and precipitation in the meteorological model) and also has limitations because changes in the meteorological output variables happen over time scales of less than one hour.
Such limitations are critical when simulating air quality in urban areas where grid resolutions of less than 1-km are desirable. To address these limitations, Grell et al. (2005) developed a fully coupled air quality model,
the Weather Research and Forecasting/Chemistry (WRF/Chem) model. In this model, chemistry and meteorology components are fully consistent. A two-way coupling of CMAQ and WRF is also under development (Mathur et al., 2010). Herwehe et al. (2011) presented a comparison of ozone observations with predictions with the one-way coupled CMAQ-WRF and the two-way coupled WRF/Chem models. They concluded that small changes in the model configurations can have significant impacts on air quality predictions. Differences in the land-surface models, planetary boundary layer schemes, dry deposition, and convective cloud schemes all impacted the ozone predications (Herwehe, 2011). However, the greatest impacts were associated with differences in the photolysis schemes.
Although these model developments and related evaluation efforts mark a clear progress in producing operational air quality forecasts, their accuracy for producing reliable urban air quality predictions is still unclear. The current horizontal resolutions are too coarse to resolve cities, and urban canopy parameterization schemes are not yet implemented in the operational models. Ching et al. (2009b) used an urbanized version of MM5 community model and the CMAQ model to investigate the influence of urban canopy parameterizations on air quality predictions for Houston. They observed significant differences in the urban ground-level ozone distributions for the non-urban versus urban simulations. Martilli et al. (2003) came to similar conclusions when simulating air quality for Athens, Greece. They observed differences in the ozone concentrations of up to 30ppb between simulations with and without urban canopy parameterizations. The strong sensitivity of the ozone distributions to urban canopy parameterizations would be a motivation to further develop truly urbanized air quality forecast systems. The incorporation of urban canopy parameterizations into WRF (Chen et al., 2011) and the efforts to develop two-way coupling between WRF and chemistry models (Grell et al., 2005; Mathur et al., 2010) provide the necessary basis for further advancements. However, access to datasets that provide detailed information about three-dimensional weather and chemistry in urban areas are key for promoting further model evaluation studies and model improvements.
For neighborhood to street-scale dispersion modeling, there are a number of different approaches available, ranging from semiempirical Gaussian-type models that account for the urban canopy, through various parameterizations and diagnostic wind field models coupled with Lagrangian particle models, to computational fluid dynamics (CFD) models that either use a Reynolds-averaged or Large-Eddy simulation (LES) approach. Grimmond et al. (2010b) includes an extensive overview of these various approaches and
related model development and evaluation studies. The models differ not only in terms of model physics but also in terms of simulation times, computational resources needed, and the number of input parameters needed. Models that explicitly resolve buildings (diagnostic wind and CFD models) require horizontal grid resolutions of 1-5 m, and the spatial domain simulated is thus typically limited to a few hundred meters in each direction. In some studies, CFD models have thus been coupled with NWP models that provide the boundary conditions for the CFD runs (Tewari et al., 2010).
Meeting the needs of emergency managers in urban environments (i.e., police, fire, and hazardous materials first responders), who require fast and reliable information on the transport and dispersion of toxic airborne contaminants in the event of an accidental or terrorist incident, remains challenging. The simulation times of CFD models typically limit their use as fast response models, but progress has been made. Hanna et al. (2007) compare measurements from Manhattan, NY to model output with various urban CFD codes. The diagnostic wind field approach reduces run times from several hours down to minutes, but at the cost of simplified model physics (Hanna et al., 2011). New research advances have also addressed early timeliness issues by using precomputed three-dimensional urban aerodynamics computations, based on high-resolution LES, which include solar heating, buoyancy, complete building geometry specification, trees, and impressed wind fluctuations (Boris et al., 2011; Patnaik et al., 2005). Typically, urban aerodynamics simulations would be preprocessed for each urban region for a complete set of wind directions and atmospheric stabilities, then extended to all wind directions, speeds, and probable sources and source locations through an advanced look-up table technology. Real-time weather information would then be used via linkage to an NWP model to provide updates to the look-up tables. The utilization of these accurate tools, precomputed for cities well in advance, would allow first responders and emergency crisis managers to act immediately without having to wait for supporting analyses or more simplistic models. The successful transition of such models into operations at major cities still needs to be seen.
Hydrological Models
Transformation of natural landscapes to urban impervious surfaces modifies surface runoff, evapotranspiration, infiltration, and groundwater recharge. Reynolds et al. (2008) found that impervious surfaces in Houston helped to distribute storm water to conveyance systems over shorter periods
of time and with greater volume, which can overwhelm capacity and lead to local flooding. Shepherd et al. (2011) suggested a similar response with historic flooding in Atlanta in 2009.
Urban flooding exposes critical flaws in urban emergency response, urban drainage, and water management systems (Reynolds et al., 2008) and also raises questions about the complex interactions between the coupled human and natural systems. Current assessments of urban flood potential are often based on outdated assumptions and statistical “curve number hydrology”2 on rainfall intensity and frequency. Flood-frequency estimates are required for effective management and planning to save lives, protect property, and set flood-insurance rates. Such estimates can also be useful for providing guidance in locations where data is limited. While modeling advances are the focus of this discussion, many workshop participants noted that modernization of flood frequency and intensity methods continue to evolve, particularly in light of climate change extreme event associations.
Hydrological modeling systems have evolved significantly in recent decades and provide a methodology for assessing surface water hydrology and water balance changes for an array of surfaces. Essentially, two classes of hydrological models have emerged: conceptual models and physically-based models (Poelmans et al., 2010). Conceptual models characterize the catchment or sub-catchment as a discrete unit and model the rainfall to runoff conversion by simple parameterizations (Moore, 2007). Physically-based models explicitly represent the land and hydroclimate attributes within a catchment but require precise input data and computing capacity (Bhaduri et al., 2001). Hybrid category (physico-conceptual distributed) models are based on actual physical processes but simplify aspects of them at the catchment scale (Poelmans et al., 2010).
Urban landscape may be represented in hydrological models in numerous ways. Impervious surface and urban morphological parameters can be characterized using remote sensing methodologies including a vegetation-impervious surface-soil (V-I-S) model, vegetation changes, high resolution optical imagery, aerial photography, night lights, synthetic aperture radar, and lidar (Jacobson, 2011). Future urban land cover and hydrological response can even be determined by coupling urban growth models (Poelmans et al., 2010).
Coon and Reddy (2008) noted that several sources of uncertainty are prevalent in hydrological models. These may include (1) errors in input precipitation data, (2) model assumptions and parameterization, (3) errors in
____________
2 Refers to an empirical method for predicting runoff or infiltration from precipitation.
calibration data, (4) land cover classification error or changes in land cover, and (5) catchment scale and transfer errors. Such errors contribute to further errors in the output or stakeholder product.
Coastal Storm Surge Inundation Models
Along with urban growth, there has been an increase in coastal population density. Coastal counties contain nearly 53% of the population of the United States, even though they comprise only 17% of its land area (excluding Alaska) (Crossett et al, 2004). Coastal urban areas are vulnerable to inundation associated with storm-induced surges and sea level rise. A generation of models has emerged that use population, land cover, elevation, climatological, and oceanographic datasets to model and animate sea level rise and surges associated with storms (Usery et al. 2010).
Many of these models leverage advances in geographic information systems (GIS) and hydraulic modeling. For example, some approaches constrain predictions of a typical coastal flood inundation model using observations and historical reconstructions (Smith et al., 2012). These authors have also noted that two-dimensional hydraulic models with simple physics can effectively simulate coastal flood events if high-accuracy, high-resolution terrain data such as lidar are available. This suggests that hydrodynamic characteristics of fluvial and coastal flooding may be similar. This review captures a small segment of this modeling field but acknowledges the importance of this aspect of the urban meteorological problem.
EMERGING TECHNOLOGIES IN METEOROLOGICAL
FORECASTING AND MONITORING
Coupling Modeling Systems
Use of High-Resolution Building Data Sets in Urban
Weather and Climate Models
As discussed earlier in this chapter, significant advances have been made to better represent cities in numerical weather prediction and air quality models. There are now several operational and research models that include urban canopy models. To run these models effectively, they require detailed information about urban morphology and form. Over the past decade, techniques have been developed that use 3-D building databases, airborne lidar, digital elevation models (DEMs), synthetic aperture radar (SAR),
and satellite data (Carter et al., 2011; Jeyachandran et al., 2010). Martilli (2009) discusses the derivation of input parameters for urban canopy models from such data sets. The National Urban Database and Access Portal Tool (NUDAPT; Ching et al., 2009a, b), developed by the Environmental Protection Agency, is an important effort to provide building datasets, including computed input parameters for the urban canopy models (such as roughness length, building area fraction, and mean building height for each grid cell), for major U.S. cities. Such a database is an important resource for the urban modeling community. It is also important that efforts be undertaken to secure access and future development of NUDAPT.
Coupling of Atmospheric Models from Global Down to Urban Scales
Grimmond et al. (2010a) noted that most operational and climate models still fail to resolve urban areas and their associated atmospheric impacts. Jin and Shepherd (2005), Jin et al. (2007), and Oleson et al. (2008a, b) have argued that emerging climate modeling systems must adequately represent urban processes. McCarthy et al. (2010) discussed results from global climate simulations after an urban land surface scheme (Best et al., 2006) was implemented within the Hadley Centre Global Climate Model (HadAM3, Pope et al., 2000). The notion of “convergence” is a critical issue. Global climate model (GCM) spatial resolution is rapidly improving (that is, grid cells are becoming smaller) with increasing computational capacity, while urban footprints are enlarging. This leads to a convergence effect whereby urban-related interactions will become increasingly relevant for proper characterization of atmospheric circulations, fluxes, and weather and climate prediction. Lamptey (2010) established that current and future climate modeling at regional scales will have to properly resolve urban contributions and modifications to the surface energy equation.
“Urbanization” of GCMs and regional climate models will involve parameterization of urban processes in the land surface components of most modeling systems. The models are most effective when they are simple enough to ensure structural compatibility and computational efficiency (Oleson et al., 2008a), yet complex enough to capture key urban-atmosphere interactions. Current urbanized GCMs resolve the spatial attributes of the urban landscape as well as the three-dimensional morphology (“urban canyon structure”). This construct captures many of the radiative, dynamical, and flux processes adequately. Jin and Shepherd (2005) offered a discussion of how emerging satellite data may provide critical information on urban surfaces (e.g. emissivity, temperature, albedo, vegetation fraction) for GCMs.
Oleson et al. (2008b) found that of the atmospheric and surface conditions they considered in their study, heat storage and sensible heat flux were most sensitive to uncertainties in the input parameters. They recommend that “attention be paid not only to characterizing accurately the structure of the urban area (e.g., height-to-width ratio) but also to ensuring that the input data reflect the thermal admittance properties of each of the city surfaces.”
Advanced Exposure Assessments
Ambient concentrations from centrally located monitoring stations have been widely used as exposure surrogates (Sarnat et al., 2001; Burke et al., 2001; Ozkaynak et al., 2008). However, errors may occur depending on the study design and scale at which individual exposure to air pollutants from central pollution monitors are analyzed (Gamble and Lewis, 1996; Zeger et al., 2000; Brauer et al., 2008; Sarnat et al., 2006). The characterization of exposures in an epidemiology study may be improved by the use of high-resolution air pollution models as the basic input for human exposure models, along with integration of human factor data (Burke et al., 2001; Ott et al., 1988, Zartarian et al., 2000). There has been a large number of studies that have characterized empirically intra-urban spatial gradients in urban air pollution using saturation sampling and descriptive statistical models (e.g., Henderson, et al., 2007). These approaches have been necessitated by emissions and meteorology data that are not well resolved spatially and by the limitations of deterministic models.
In their review of models used to determine air pollution exposures, Jerrett et al. (2005) concluded that integrated dispersion and meteorological models are becoming more widely used to assess health effects related to air pollution. However, because classical Gaussian dispersion models, which often predict imprecise urban concentration patterns, are enshrined in government regulations and policies, they are most widely used for such dispersion-model-based exposure assessments. Jerret et al. describe “unrealistic assumptions about pollutant transport” as a major limitation for health studies based on such models.
Although coupled mesoscale meteorological and chemical transport models such as the CMAQ (Byun and Schere, 2006) deliver more reliable concentration predictions for a wide variety of different species of gaseous and aerosol pollutants, the intra-urban variability of concentrations is often not well represented with such models, as the typical spatial resolution in the smallest grid is 1-4 kilometers. Isakov and Ozkaynak (2008) proposed a hybrid approach in which local impacts of mobile and stationary sources
are modeled with the Atmospheric Dispersion Modeling System (AERMOD) (Cimorelli at al., 2005), while the regional transport and background concentrations are simulated with CMAQ.
Application of Weather and Climate Models for Urban Planning
At scales ranging from global to local, models are providing guidance on mitigation and adaptation decisions. Recent studies (Oleson et al., 2010a; Akbari et al., 2009) have presented compelling evidence that increasing the albedo of cities on a global scale can not only reduce summertime temperatures but also offset carbon emissions through reduced power demand. To take advantage of this effect, some cities are deploying large scale greening plans (e.g., MillionTreesNYC; see Chapter 2).
Models are needed to help quantify the expected benefits and identify unintended impacts of these programs. For example, by how much will planting trees and/or creating urban green spaces reduce urban temperatures (Lynn et al., 2009; Zhou and Shepherd, 2009; Solecki et al., 2005)? Better vegetation models are thus required in the current urban canopy models—a need that is not only of relevance for urban planning studies but also for improving urban canopy parameterizations and weather predictions in general. Recent efforts to couple building energy models with urban canopy parameterizations implemented within NWP models (Salamanca et al., 2010, Salamanca and Martilli, 2010) provide better tools to study feedbacks between building energy use and urban climate, as well as to test the impacts of various urban growth scenarios on future urban climate. However, these models require further validations, and the output was shown to be quite sensitive to the details in information about urban structures and morphology (Salamanca et al., 2011).
Coupling of dynamic urban meteorological models with socioeconomic models is important for long-term planning and prevention in areas of high vulnerability. Risk assessment ultimately needs this type of coupling and will allow taking a more proactive approach. The urban modeling community has not inspired confidence among end user groups concerned with sustainability of cities in the ability to accurately model the complex effects impacting quality of life issues in the urban environment—the more complex models considering street, road, and building impacts have not consistently been able to improve on simple model forecasts.
Data Assimilation and Probabilistic Forecasting Techniques
In general, data assimilation and probabilistic forecasting techniques represent clear advancements over the last decade, but their application for urban areas is still largely unknown. These techniques have been used primarily for research applications rather than for end users. This is partly because of the need for greater computing power, but also because end users are not typically educated on how to properly interpret model-generated probabilistic information, and modelers struggle with how best to communicate it.
Data Assimilation
Liu et al. (2006) evaluated a multi-scale, rapid-cycling, real-time, four-dimensional data-assimilation and forecasting system to assimilate high density data collected during the Joint Urban 2003 field project in downtown Oklahoma City. Using a mesoscale modeling framework, they found improved characterization of the boundary layer, atmospheric dynamics, and thermal structure, which led to reduced biases in forecasting wind speeds and a more realistic boundary layer structure. Baklanov et al. (2009) have noted the need for improved assimilation of surface characteristics into urban scale NWP and air quality models. Even though some high-resolution satellite or airborne datasets are available for urban landscapes, a new generation of algorithms for assimilation of surface temperature, albedo, snow, and other key urban variables will be required.
A generation of two-and three-dimensional land information systems (LIS) have emerged that can be used to assimilate urban surface features into appropriate coupled modeling systems. Kumar et al. (2006) have described a land surface modeling framework that “integrates various community land surface models, ground measurements, satellite-based observations, high performance computing, and data management tools.” They also use a sequential data assimilation extension of their LIS that uses many land surface models, observational sources, and assimilation techniques. LIS is one of several types of various land data assimilation systems (LDAS) that are emerging for constraining land-atmosphere simulations involving weather and climate models (Ghenta et al., 2011; Jimenez et al., 2011; Bosilovich, 2008; Rodell et al., 2004).
Chen et al. (2007) present an evaluation of the uncoupled high-resolution land data assimilation system (HRLDAS) which was developed to initialize land-state variables of the coupled WRF-land surface model (Noah) for
high-resolution applications. An offline approach was chosen because soil moisture spin up (to reach the equilibrium state) can take up to several years, which is difficult to handle within the computationally expensive WRF. For urban applications, HRLDAS is urbanized by running the coupled Noah/urban model in an offline mode, which then provides the initial soil moisture, soil temperature, snow, vegetation, and wall/road/roof temperature profiles (Chen et al., 2011). Ross et al. (2009) have developed a land information system method for assimilating heterogeneous spatial and georeferenced information into three-dimensional urban models.
Many opportunities for enhanced assimilation exist within the air quality forecasting community, such as the NAQFC (described earlier in this chapter). Pagowski et al. (2010) have recently demonstrated the role that assimilation of surface ozone and fine aerosols can have on air quality forecasts. They applied the WRF-CHEM model and Grid-point Statistical Interpolation, a three-dimensional variational (3D-Var) assimilation tool. This relatively simple approach in chemical data assimilation of ozone and fine particulate matter leads to improved skill of the chemical model forecasts. Other studies using the four-dimensional variational data-assimilation framework (4D-Var) and ensemble Kalman filter (EnKF) data-assimilation frameworks and strategies show equal promise for future air quality forecasting (Constantinescu et al., 2007a-d; Elbern and Schmidt, 1999 and 2001; Elbern et al., 1997).
Probabilistic Forecasting
Dabberdt and Miller (2000) illustrated the direction in which probabilistic simulations of air quality can aid the user community. Delle Monache et al. (2006) presented results from ensemble ozone forecasts using both meteorology and emission perturbations. Wilczak et al. (2006) conducted a similar study but used seven different models, with their own meteorology, emissions, and chemical mechanisms, to create the ensembles. While both studies concluded a gain in forecast skill through the ensemble approach, they also identified a number of issues. Delle Monache et al. (2006) concluded that complex relationships between perturbations to ozone precursors and meteorological drivers can result in systematic forecast errors.
A survey of the literature suggests that at the urban scale, many applications of probabilistic forecasting methods are primarily found within the hydrometeorological context (Villarini et al., 2010b; Schellart et al., 2009). A deterministic forecast provides the user with an “illusion of certainty” (Villarini et al., 2010b). In a recent discussion of probabilistic flood forecasts, Villarini et al. (2010b) cited an American Meteorological Society
policy statement on flooding, noting that an important research challenge was “quantifying forecast uncertainty by providing probabilistic forecast guidance” (AMS, 2000). A 2008 policy statement addressing probabilistic forecasting (AMS, 2008) noted several challenges that must be overcome before the user community can take advantage of probability forecasting, many of which are directly applicable to the urban meteorology problem.
Advanced Sensing Techniques for the
Atmospheric Boundary Layer
Although there have been important recent advances in observation techniques that have resulted in clear improvements of weather forecasts, there is an obvious need for better observations, particularly to obtain high-resolution profiles of atmospheric variables within the atmospheric/urban boundary layer. For the emergency response community, timely, high spatial and temporal information in and above the urban canopy (i.e., within minutes at sub-km horizontal resolution) of meteorological fields impacting transport and dispersion of hazardous contaminants in an urban environment (i.e., vertical shear of winds, temperature, and moisture) is essential.
There are a number of new and emerging sensing techniques, including differential absorption lidars, which provide promise for urban boundary layer/planetary boundary layer (UBL/PBL) profiling of moisture and boundary layer structure at markedly reduced cost (perhaps an order of magnitude lower than previous norms). These lidars are currently being developed at the University of Montana in collaboration with NCAR and also in the commercial sector. Micropulse lidars and ceilometer instruments provide low-cost profiling technologies for aerosol structure within the PBL and can be used to detect the mixed layer height and structure. Studies (Emeis et al., 2005) have been done to successfully demonstrate their value, but they have largely not been used for these purposes in operational settings in the U.S.
Doppler-lidar systems can provide high-resolution planetary boundary layer wind profiles. Sodars, which are quite a bit cheaper, are often of limited use for urban applications due to concerns about noise pollution caused by the instrument and also background noise contamination of the sodar signals. TAMDAR (Tropospheric Airborne Meteorological Data Reporting) and MDCARS (Meteorological Data Collection and Reporting System) aircraft-based samplings are promising ways of obtaining medium-resolution PBL observations in and around urban areas, albeit at nonuniform sampling intervals throughout the day.
Non-Traditional Sensor Networks
The unique form, population density, and attributes of urban environments make them particularly challenging from the standpoint of traditional meteorological observations. However, the same challenges associated with urban environments present opportunities as well. Nontraditional “human or social” monitors may provide critical real-time meteorological, hazard, or emergency response data through media such as Twitter, Facebook, YouTube, and text messaging alerts (RSS [Really Simple Syndication] or SMS [Short Message Service] feeds). Personal contributions to meteorological assessment and prediction are common. For example, the Weather Channel now uses an interactive twitter feed.3 BreakingNews, an MSNBC.com property, consolidates verified updates from various news sites, wire services and social networks, allowing people to easily log onto one site and see what other traditional and nontraditional news organizations are reporting.4 Many public meteorological reports consist of input from voice over phone systems, amateur radios, and controlled-access websites (Ferree et al., 2009). Ferree et al. also note the potential value of social media to NWS forecasters or emergency managers; yet they also note key challenges or gaps in effective integration into the assessment and decision making process.
Key questions that the use of nontraditional sensor networks raises include the following: (1) Are there ways to aggregate real-time information from public sources with at least some quality control? If so, then how is this information distributed in a timely manner to official sources for emergency response, the broadcast media, the general public, and back to those using these social media? (2) How is the information filtered, and by whom? (3) What are the roles of the NWS and the private sector in gathering and redistributing such information?
Mass (2011) documented the great value in geotagged information available from social media sites for nowcasting of weather and for providing warnings. Mass also noted the rapid proliferation of smartphone applications (“apps”) and potential roles that they play in urban meteorological dissemination and emergency response. He noted that several available or emerging apps leverage Global Positioning System (GPS) and cell phone tower information to determine location specific information. Next-generation apps might deliver site- or condition-specific forecasts or nowcasts.
____________
These capacities are primarily enabled by smart technologies such as GPS or mobile GIS capabilities, which are fairly ubiquitous in urban regions. Together, the combination of social media and personalized technology (via GPS receivers, smartphones, etc.) has ushered in the potential era of dynamic, ever-evolving “personal sensor webs.”
Nontraditional sources, however, are not limited to personal space. Other data sources that could be of value for urban meteorological forecasting, hazard response, or dissemination include commercial aircraft, road vehicles, traffic monitoring systems, electronic reader boards, among others.
Weather is the number one cause of nonrecurrent traffic congestion, which leads to spikes in greenhouse emissions. A relatively new U.S. Department of Transportation initiative on Connected Vehicles offers the promise to obtain atmospheric state information (e.g. temperature, pressure) from state, fleet, and possibly private citizen passenger vehicles (Mahoney et al., 2010; Drobot et al., 2010). With roughly 250 million vehicles on the nation’s roads, most of which are in urban areas, this system could be a paradigm shift in our ability to monitor the surface atmosphere.
REMAINING NEEDS AND FUTURE CHALLENGES
Despite the many emerging meteorological observation and forecasting technologies described here, several key needs, challenges, and opportunities have been identified during the course of this study:
The “Urban” Signal and Climate
There has been inadequate emphasis on providing the necessary observations and modeling activities in the urban environment that are required to meet the needs of a broad cross-section of users of urban meteorology information. In the quest to create unbiased global-scale temperature records, meteorological services around the world routinely adjust the meteorological record to exclude the urban heat signal from climatological records (Karl et al., 1988; Peterson, 2003), and monitoring stations affected by urban development are being relocated to remote rural areas. Given that the type of data required to study and serve the needs of cities is mismatched with what is currently routinely monitored, it is important that the complementary functions of global and urban climate records be recognized. It is also optimal to have quality-controlled long-term urban observations.
In addition, there should be a two-way interaction between broader greenhouse-gas based climate change and urban climate change communities.
Stone et al. (2010) have revealed that large urban regions are warming faster than smaller cities and rural regions. This raises critical questions about whether adaptation and mitigations strategies are properly scaled to address this “hyper-warming” in large cities.
Cities are also poorly characterized (if they are included at all) in GCMs, yet urban footprints and associated aerosol loads are growing as GCM grid size is decreasing. Früh et al. (2010) have recently explored mechanisms to downscale GCM data to the urban scale using a cuboid method. In their method, urban heat load and the frequency of air temperature threshold exceedances were simulated using eight microscale urban climate runs for each appropriate wind direction as well as the time series of daily meteorological parameters either from regional climate projections or observation. While experimental, this methodology rightly notes the need to “downscale” climate impacts onto the “urban climate” signal. It is also essential to address how the urban climate signal scales up to impact regional to global climate in terms of temperature, precipitation, and cloud systems.
Integration of Research Knowledge
into Operational Framework
Although the problem of converting what is learned in research into on-the-ground applications is common (i.e. the research to operations “valley of death” problem), the committee recognizes some opportunities within the urban meteorological community. For example, research has established that the shape and size of a city and the prevailing wind can affect the orientation of the UHI signal (Basara et al., 2010). With such knowledge, forecasters could provide very detailed minimum temperature forecasts, for example, around a city. Likewise, the literature has clearly established that precipitation and convective activity may be affected by urban regions. Most operational organizations are not aware of this research or may be skeptical, even though an emerging consensus is developing (Shepherd et al., 2011) on urban rainfall effects. This is complicated by uncertainty on the sign of the effect and under what conditions the effects are most evident prompting the need for further research.
Dynamics of Cities
Cities evolve constantly, and modeling and monitoring systems need to be flexible enough to adjust to these changes and input parameters need to be constantly updated. Challenges for the future will be (1) how to address
current deficiencies in model frameworks, physics, and dynamics while avoiding a plethora of poorly validated models that are not compatible or easily implemented in operational settings because of their complexity and the number and type of input parameters needed, (2) advancing air chemistry models and better coupling with weather models to improve predictions of particulates and other harmful atmospheric pollutants, and (3) implementing end-to-end physical social models with appropriate feedbacks and error characterization.


