
Examples of Tools for Costing,
Economic Modeling, and Priority Setting
A toolkit that could support countries in their decision making related to chronic diseases must address a complex set of tasks, including budgeting, planning, decision making, and priority setting, said session moderator Rachel Nugent of the University of Washington. The first session summarized in this chapter presented several models for costing and other economic analyses that might represent useful components of a toolkit, recognizing that financing is a fundamental aspect of decision making in every country. Therefore, any tool or process to support decision making for chronic disease control needs to provide information about costs to support budgeting as well as, ideally, information on cost effectiveness and potential return on investment to help convince policy makers of the benefits of allocating resources to support intervention. Even more ambitiously, Nugent added, the toolkit might also be used to address more “big picture” types of economic questions that may also play a role in priority setting—for example, the relationship between the prevalence of chronic diseases and economic development.
In addition to economic analyses, decision making is also influenced by a range of other types of information and influences. The second session summarized in this chapter explored two examples of tools to inform priority setting that incorporate data beyond costing and economic analysis. One is a model that focuses on estimates of impact based on the anticipated life-saving effects of interventions, which can be a powerful policy tool. The other is a tool that can incorporate multiple criteria that influence decision making, including empirical data (such as effectiveness and economic data) as well as information that reflects values and preferences. The aim of the
tool is to provide a way to systematically and transparently establish rankings or comparisons among different intervention options across a broad range of criteria.
The following sections summarize the content of each of the presentations in this session. Chapter 6 provides a summary of the considerations raised in this session along with the presentations and discussions throughout the workshop.
TOOLS FOR COSTING AND ECONOMIC MODELING
Developing a Country-Validated Price Tag for Chronic Disease Prevention
Knowing how much it would cost to prevent or reduce noncommunicable diseases can be important for advocacy and to promote spending from international donors, Andrew Mirelman of Johns Hopkins University commented, as well as to establish priority setting at the national and subnational levels. He noted that efforts to calculate the costs of disease burdens and preventive interventions—for HIV/AIDS, vaccines, and child survival, for example—have become valuable tools for advocacy and for priority setting.
Mirelman described an effort to develop a disease prevention price tag using a cross-validation study in which international estimates of the costs of preventing specific diseases and reducing specific risk factors are compared with country-level data on costs for specific population- and individual-based interventions. The study explored prevention costs for noncommunicable diseases in 19 resource-poor countries and was carried out primarily by a number of Centers of Excellence set up through the UnitedHealth Chronic Disease Initiative and the U.S. National Heart, Lung, and Blood Institute (NHLBI).1 The Centers of Excellence are research institutions in low- and middle-income countries that collaborate with academic institutions in high-income countries in order to address chronic diseases. (See Box 4-1 for a list of the centers and their university partners at the time of Mirelman’s data collection.) The goal of the Centers of Excellence program is to build research capacity within local institutions, and for the past year these centers have participated in developing a country validation approach to calculating the costs of prevention.
For this project, the teams used values from international databases (including the World Health Organization [WHO] Comparative Risk Assessment for Burden of Disease, WHO-CHOICE reference pricing, the Management Sciences for Health International Drug Price Indicator Guide,
____________
1 For more information see http://www.nhlbi.nih.gov/about/globalhealth/centers/ (accessed October 2011).
BOX 4-1
UnitedHealth and NHLBI Collaborating Centers of Excellencea
|
Argentina (Instituto de Effectividad Clinica y Sanitaria) Bangladesh (ICDDR,B) China (George Institute) Guatemala (The Institute of Nutrition of Central America and Panama) India (Bangalore) (Population Health Research Institute) India (New Delhi) (Public Health Foundation India) Kenya (Moi University) Peru (Universidad Peruana Cayetano Heredia) South Africa (University of Cape Town) Tunisia (University Hospital Farhat Hached) U.S.–Mexico Border (Pan American Health Organization) |
Tulane University Johns Hopkins University Duke University Johns Hopkins University McMaster University Emory University Duke University Johns Hopkins University Harvard University National Public Health Institute, Helsinki, Finland University of Texas El Paso; University of Arizona; Whittier Institute of Diabetes San Diego, CA |
____________
aThis list includes those centers that were in existence at the time of Mirelman’s data collection.
SOURCE: NHLBI (2011).
and the WHO Global InfoBase). They then validated the data at the country level using a questionnaire and interviews with technical personnel. The key variables were risk factor prevalence, intervention coverage, and unit prices for drugs and health staff salaries. The researchers used demographic projections based on United Nations (UN) data to estimate, for example, growth in the elderly populations most likely to be affected by the diseases being studied.
The approach used in this project had several important strengths, Mirelman explained. Tailoring the analysis of risk reduction approaches to the individual countries was important. The teams confirmed which medical approaches were used in each country (such as which tool was typically the first choice for targeting hypertension), the guidelines for treatment, and other information. They used an iterative approach to investigate confusing information and to fill in gaps, and they found that doing so influenced
their results. Many of the countries became interested in the benefits of the analysis, so the validation is ongoing. The researchers used multi-variate sensitivity analysis to address uncertainties in measurement and in the data, such as data concerning drug prices, epidemiological information, and compliance. They were also able to integrate their findings with other estimates of the burden of diseases and with cost-effectiveness analysis.
The approach also had a number of limitations, Mirelman said. The team needed to make assumptions that were in some cases quite optimistic. For example, the team assumed that prevalence data could be translated into ideal professional protocols—that patients would be identified and an intervention of some kind would be initiated—but “that’s supremely idealistic,” Mirelman said. Thus, the price tag essentially answers the question “If we could do everything right now, how much would it cost?” The model used in this work also required assumptions about data that were not fully available, such as the availability of medical personnel, and it could not fully account for barriers to implementation. In general, there was “never enough data at the country level,” Mirelman said. The model also did not take into account the cost offsets likely to come from the health and societal benefits of reducing disease prevalence. Furthermore, Mirelman said, the findings are a yearly estimate of the cost of prevention—not a projection into the future.
The researchers hope to build on the work that has already been done, Mirelman said, by developing more comprehensive data calculating the burden of diseases used to support cost-effectiveness analysis. The researchers hope to develop a league table to rank potential interventions based on cost effectiveness as well as decision weights for such criteria as disease severity and equity (multiple criteria decision analysis, an approach described in a subsequent presentation summarized in this chapter, is one way to develop such weights, he noted). The researchers also hope to expand the program to more countries.
The research done through these collaborations, Mirelman concluded, can provide valuable support for decision makers. As an example, he cited an analysis of future projections from data from China that showed that even though the assumption has been that population-based approaches are the most cost-effective, in that setting “you can get an equally good buy with individual-based approaches, even though they are expensive, because you are targeting high-risk individuals, so you realize very high-level effects.” Furthermore, participants noted that the value of such rigorous research goes beyond advocacy. It can reveal significant differences across countries, which could yield insights about variation in treatment guidelines, prices, and other issues.
Two Types of Economic Modeling
Tom Gaziano, of Harvard University’s Brigham and Women’s Hospital, started by explaining that his work focuses not so much on a research ideal of the best possible thing to do, but rather on “what we are able to do” with what is available. It is unlikely that there are perfect data for any country, he commented, and the countries with the greatest need have the greatest data challenges. Thus, real-world modeling requires the flexibility to adapt questions to the available data—for example, addressing a less specific aspect of cardiovascular disease.
Gaziano described a project conducted through the UnitedHealth/NHLBI Centers of Excellence2 that was designed to determine the potential cost to low- and middle-income countries of adhering to current international blood pressure guidelines, which have set a goal of bringing people with hypertension to a target blood pressure of 140 over 90 or lower. The researchers also examined the potential savings that might come from three different lifestyle changes that could lessen the need for medications: a reduction in salt intake, an increase in physical activity, and improvements in diet. The researchers hoped the results would be useful for determining policy recommendations for both individual countries and regions.
High blood pressure is a significant risk factor, Gaziano noted. It contributes to at least 50 percent of cardiovascular disease, particularly stroke and ischemic heart disease. Elevated blood pressure leads to a major financial burden from both the efforts to manage the high blood pressure and the treatment of the health problems it causes. A variety of data regarding the economic impact of treating heart attacks and stroke are available, but much less information is available concerning treatment of individual risk factors at a country level. Data on the global financial burden of hypertension are also scarce, Gaziano added, but full compliance with drug treatment is clearly expensive. Estimates of the cost of hypertension as a percentage of total health care costs range from 7 or 8 percent to 20 percent, depending on the region, with heart attacks and strokes being the largest drivers of cost (Gaziano et al., 2009).
In the study carried out through the Centers of Excellence, Gaziano said, the basic protocol was to determine the total number of people eligible for blood pressure treatment by country, assess the cost of treating this population, and determine the effect of lifestyle interventions on the distribution of elevated blood pressure. Estimating the number of people who would not need treatment if the lifestyle interventions were available would make it possible to calculate the net costs and savings associated
____________
2 For more information, see http://www.nhlbi.nih.gov/about/globalhealth/centers/ (accessed October 2011).
with each lifestyle intervention. The researchers studied the 19 countries represented by the 10 Centers of Excellence and 14 additional countries, and these 33 countries contained approximately 80 percent of the population of low- and middle-income countries worldwide.3
The researchers sought new or confirming epidemiological data on prevalence, awareness, treatment, and control of blood pressure, using the WHO database as well as individual country and regional data. Data on treatment costs came from the Centers of Excellence or, when this was not available, from WHO and other global sources. It included the costs of antihypertensive medicines if prescribed according to standard of care as well as the costs for physicians and nurses, clinic time, treatment, and laboratory work. The associated costs of a strategy to increase physical activity were based on a mass media campaign in Australia, and those of population-based strategies to reduce salt intake were based on existing published estimates (Asaria et al., 2007). The centers provided data they collected on costs for fruit and vegetables; this was supplemented by U.S. Department of Agriculture data. To estimate the anticipated reduction in mean blood pressure through treatment and the three lifestyle strategies, the team used a variety of sources, including WHO and the available published literature.
The data on estimates of prevalence, awareness, and treatment were “somewhat shocking,” Gaziano noted. Among the population covered in the study (as noted, roughly 80 percent of the population of low- and middle-income countries) it was estimated that approximately 600 million people, or about 25 to 26 percent of adults, had hypertension. Only about 40 percent of them were aware that they were hypertensive, and of that group, only 40 percent—approximately 120 million people—were being treated. Furthermore, of that small percentage, only about 20 percent had their hypertension adequately controlled.
Based on the combined results across countries, the cost to treat the people whose blood pressure is currently not being controlled and to bring them to the point specified by the international guideline would be about $43 billion, with human resources representing a significant portion of the cost. The calculated net savings from the physical activity intervention were about $1 per person. For salt reduction, the net savings were $2 per person. By contrast, the fruit and vegetable intervention would have a net cost of about $80 per person rather than a net savings, although Gaziano
____________
3 The 19 countries represented by the Centers of Excellence were Argentina, Bangladesh, Belize, Chile, China, Costa Rica, El Salvador, Guatemala, Honduras, India, Kenya, Mexico, Nicaragua, Pakistan, Panama, Peru, South Africa, Tunisia, and Uruguay. The 14 additional countries included in the study were Brazil, Czech Republic, Democratic Republic of the Congo, Egypt, Ethiopia, Indonesia, Iran, Myanmar, Nigeria, Russia, Thailand, Turkey, Ukraine, and Vietnam.
noted that the intervention could have other benefits as well, for example in reducing cancer rates.
When looking at individual countries, the costs varied significantly by country, and thus the per capita net savings that would result from the different interventions varied as well. Based on the data provided by the countries, the variability was quite high for the cost of medications, even those that are generically available, and there was a big range compared to the estimates from the Management Sciences for Health International Drug Price Indicator Guide. “This is one of the striking findings,” said Gaziano. There was also a wide range in laboratory costs, and outpatient visits ranged anywhere from $20 up to about $120. Similarly, the estimated per capita costs for the lifestyle interventions considered in the study ranged, for example, from 4 cents to 30 cents for salt reduction and from $35 to $300 per capita to increase fruit and vegetable consumption.
Indeed, one overall finding from this work was the significant variation in results from country to country. “It’s quite a broad range,” Gaziano explained, “depending on what they were already doing and the level of control they had, as well as how much they were spending on health care.”
Gaziano also described a second model which was used in a study conducted for the World Economic Forum on the global economic burden of noncommunicable diseases, with a particular focus on cardiovascular disease (Bloom, 2011). In this study the researchers began with a model of the life course of cardiovascular disease. This life course approach is important because such lifestyle factors as excessive salt intake, consumption of trans fats, and insufficient physical activity may start to have effects early in life, and these and other factors become risk factors in individuals, which in turn increase the probability of disease. Primary prevention strategies at either the population or individual level may help control these risk factors, and secondary prevention or acute medical treatment—both of which are more expensive than primary prevention—come into play if primary prevention strategies are not effective.
The researchers developed a “decisional analytic model,” Gaziano said, which involves assessing a population in terms of age and gender distribution, blood pressure status, smoking, diabetes, and cholesterol. The model identifies those with differing levels of risk for cardiovascular disease, and it indicates the proportions of each in the population, which provides the opportunity to consider different intervention options for each subpopulation.
This type of modeling can be used to predict cardiovascular disease events, Gaziano explained, and costs can then be attached to the various possible interventions. The result makes it possible to predict, given a population with a particular distribution of risk factors, the number of events likely in a particular period of time as well as the potential treatments and costs. Using this approach, the researchers estimated a global cost of about
$860 billion annually due to various aspects of cardiovascular disease, including the management of blood pressure and cholesterol levels and the treatment of ischemic heart disease, stroke, heart failure, and hypertensive heart disease. Approximately 50 percent of the cost was due to health care costs and the rest to lost productivity. The costs differ by country and region, he added, ranging from a low of $20 or $30 per capita in developing countries to a high of $400 to $650 per capita in North America, Western Europe, and developed Asian countries. In high-income countries, a considerable portion of the costs are accounted for by acute, advanced hospital care. Although $20 to $30 per capita in developing countries may seem low, it could be the entire health care budget in many low-income countries, so covering all costs of cardiovascular disease would be difficult despite the fact that the cost would be relatively low compared to high-income countries.
Gaziano added that the global cost of cardiovascular disease is likely to rise to as much as $20 trillion over the next 20 years, given the projected population growth and assuming no change in risk factor estimates. “These are probably underestimates,” he added, “because we use mostly public sector pricing.” A number of other factors could indicate that the estimate is low, he said. The analysis did not include rheumatic heart disease and other cardiovascular conditions, for example, nor did it include devices such as pacemakers and defibrillators or some other procedures that can be quite expensive. The researchers assumed a low level of hospital access in low- and middle-income countries, but that hospital access could improve, which would “vastly affect the costs over time.”
During the discussions following his presentation, Gaziano and other participants commented on how, from the perspective of a potential toolkit, these models could be applied at the country level by using country-specific estimates of the costs of interventions and by adjusting the anticipated effects of treatment and lifestyle interventions based on how they would actually be implemented in a country and the evidence for effectiveness in a similar population or context. There is also the potential to expand the models to use them to explore different scenarios in a country, such as setting different treatment targets or shifting treatment costs by changes in the system’s current guidelines or standards, such as using lower-cost personnel or changing the frequency of clinic visits for managing treatment. “When you do these models you are forced to look at all the individual components and say, hmm, why are we spending so much on this part?” Gaziano said. Thus, the models can generate data that could be used to consider options for how to make optimal use of available resources.
The World Health Organization’s Costing Methods
In the presentation following Gaziano’s, Karin Stenberg of the World Health Organization (WHO) began by agreeing that many assumptions go into any model. In many cases the data are somewhat shaky, she said, so it is important to “look at the different pieces of evidence that come together.” This means, as the previous presentations indicated, that one should both recognize the size of the problem and explore potential solutions and priorities for investment. Once priorities are established, however, it is also important to determine the costs of implementing the chosen interventions at the intended scale.
To illustrate such costing, Stenberg described a WHO study led by Dan Chisholm which examined the costs of scaling up interventions aimed at noncommunicable disease control (Chisholm and Mendis, 2011). The goal of the study was to develop a financial planning tool to aid countries in the scale-up of these health care interventions, and the cost estimates from individual countries were then combined to produce a global “price tag” that illustrated the total cost of scaling up noncommunicable disease interventions worldwide. The study included analysis of data from 42 low- and middle-income countries;4 these countries account for 90 percent of the noncommunicable disease burden in developing countries. The scope of the costing study was limited to the diseases and risk factors highlighted in WHO’s Action Plan for the Global Strategy for the Prevention and Control of Noncommunicable Diseases, specifically cardiovascular disease, diabetes, cancers, and respiratory disorders (asthma and chronic obstructive pulmonary disease) (WHO, 2008a). To determine which interventions to analyze, the researchers used previous work from WHO that had identified cost effective, feasible, low-cost interventions that were also appropriate to implement within the constraints of the local health system where they would be used (Alwan et al., 2011). They defined the “best buys,” or very-cost-effective interventions, as those that could add an additional year of healthy life for less than the country’s annual per capita income. (Table 4-1 summarizes the 14 “best buys.”) Interventions that did not meet all of these criteria but that still offered good value for the money and had other attributes that recommended their use were considered as “good buys” and were also included in the costing study.
____________
4 Included in the study were 14 low-income countries (Afghanistan, Bangladesh, Côte d’Ivoire, DPR Korea, DR Congo, Ethiopia, Ghana, Kenya, Myanmar, Nepal, Nigeria, Sudan, Uganda, Tanzania), 13 lower-middle-income countries (China, Egypt, India, Indonesia, Iraq, Morocco, Pakistan, Philippines, Sri Lanka, Ukraine, Uzbekistan, Vietnam, Yemen) and 15 upper-middle-income countries (Algeria, Argentina, Brazil, Colombia, Iran, Kazakhstan, Malaysia, Mexico, Peru, Romania, Russian Federation, South Africa, Thailand, Turkey, Venezuela).
TABLE 4-1 “Best Buy” Interventions
|
|
||
| Condition | Interventions | |
|
|
||
| Tobacco use |
Tax increases; smoke-free indoor workplaces and public spaces; health information/warnings; advertising/promotion bans |
|
|
Harmful alcohol use |
Tax increases; restrict retail access; advertising bans |
|
|
Unhealthy diet and physical inactivity |
Reduced salt intake; replacement of trans fat with polyunsaturated fat; public awareness about diet and physical activity |
|
|
Cardiovascular disease and diabetes |
Counseling and multi-drug therapy (including glycemic control for diabetes) for people with > 30 percent cardiovascular risk (including those with cardiovascular disease); treatment of heart attacks with aspirin |
|
|
Cancer |
Hepatitis B immunization to prevent liver cancer; screening and treatment of precancerous lesions to prevent cervical cancer |
|
|
|
||
SOURCES: Alwan et al. (2011), Chisholm and Mendis (2011).
The WHO costing study also took into account the readiness issues discussed earlier, by including an assessment of the current strength of the health system in a given country as part of the scaling-up process. For example, the researchers assumed that low-resource countries would need more lag time than others to put infrastructure and personnel for individual interventions into place. For population interventions, they included an assessment of current policies and how these policies are enforced. The model then included activities needed to strengthen policy, planning, and implementation. Table 4-2 shows the phases of policy development and the sorts of resources needed in each phase. The researchers developed cost estimates for each of these elements.
The costing method was straightforward, Stenberg said, and it was similar to those described in other previous presentations. The researchers calculated the relevant variables: population; prevalence (percent of population with disease or risk factor, by age and sex); current and target coverage (percent of population in need of intervention); resource use (resources needed to implement an intervention); and cost per unit of resource use. For example, in a country with a population of 1 million and a 20 percent prevalence rate for smoking, the population in need of intervention would be 200,000 individuals. An intervention that costs $1 per patient per year
TABLE 4-2 Resource Needs Matrix for NCD Policy Instruments
| Stage of Policy Development | Human Resources | Training | Meetings | Mass Media | Supplies and Equipment | Other |
|
Planning (year 1) |
Program management; administration |
Strategy/policy analysis |
Stakeholders |
Office equipment |
Baseline survey |
|
|
Development (year 2) |
Advocacy; law |
Legislation |
Intersectoral collaboration |
Awareness campaigns |
Opinion poll |
|
|
Partial implementation (years 3-5) |
Inspection |
Regulation |
Monitoring |
Counter-advertising |
Vehicles, fuel |
|
|
Full implementation (year 6 onward) |
Enforcement |
Evaluation |
Follow-up survey |
|||
NOTE: NCD = noncommunicable disease.
SOURCE: Stenberg (2011a).
would cost $200,000. If the country were to begin with a 50 percent scale-up, the cost would then be $100,000. The researchers produced estimates for each of the 42 countries, using country data as well as standard assumptions, and then totaled these numbers to come up with the global price tag of noncommunicable disease interventions.
This particular study concentrated on the worldwide totals of certain interventions; however, perhaps its most useful product when it comes to actual health care planning is the tool that was developed to analyze country-specific costs of noncommunicable disease interventions. The global estimates of the noncommunicable disease burden that the WHO study produced are useful for advocacy, to demonstrate need and garner additional resources, Stenberg noted, but the average costs are not very relevant to individual countries. Similar to the experience with the other models presented, the WHO study showed that the cost of implementation of a given intervention varies widely among countries and thus the study highlighted the need to tailor planning to individual countries rather than to make assumptions based on global estimates. During the course of the study, templates were developed that each country could use for more detailed costing by plugging in more information and changing the assumptions as needed. These templates could be a valuable asset for country-level planning, particularly because of the care the researchers took in providing ways to tailor the analysis to specific circumstances.
One of the main strengths of the model, Stenberg said, is its capacity to provide a comprehensive assessment of a broad range of both public health and primary care interventions, considering both the “best buys” and “good buys.” The researchers used the most current country policies and health care systems in their analyses, which, Stenberg noted, is an approach that could be useful in the further development of country-level tools for the planning of noncommunicable disease control. The model also uses a standard methodology that has been used in other WHO programs, which makes it very easy to compare findings across diseases and interventions.
On the other hand, Stenberg said, the results will not reflect assessment of health gains because the researchers were not able to model impact in the available time. The model also does not include changes in epidemiology over time, so it does not reflect the decrease in prevalence that could be expected once interventions are implemented or the cost savings related to such decreases. It also does not include medical personnel training costs. In addition, as was the case with the other models, the WHO work was based on sometimes idealized assumptions and used data inputs that could be better validated by the countries. Stenberg also noted that countries might wish to model other interventions that fit their needs better than those selected.
In the future, Stenberg said, it is likely that the templates will be made available to countries, and that this noncommunicable disease work will be
integrated with another project, the OneHealth model, which is a costing tool designed to assess public health needs in low- and middle-income countries.5 Developed by a UN interagency working group, this model is part of an effort to standardize approaches to costing within the network of UN agencies so that results can be compared and planning can be integrated. The OneHealth model is also intended to address the growing awareness of the importance of considering the health sector in national planning and of using national health plans as a mechanism for coordination and for ensuring that donors’ efforts are harmonized with local agendas.
Analysis has shown, Stenberg said, that a significant majority of the new resources that will be needed in low- and middle-income countries between 2009 and 2015 will be required for strengthening health systems (McCoy, 2009). However, the disease programs in many countries operate independently and develop their plans without considering the timing of other health programs, the national health plan, or the overall development plan for the country. This lack of synchronicity among various health plans in different countries can be seen clearly in the WHO planning cycle database, Stenberg said, which tracks the development of different health plans across the world.6 For example, in Afghanistan, the National Health Plan covers the years 2007-2013, the immunization plan covers 2011-2015, the TB plan covers 2009-2013, and so on.
The OneHealth model is a tool intended to support medium-term planning and promote integration. Its focus is on the public sector, but it also allows for private-sector activities to be incorporated. The intended audience is health-sector planners, disease-specific program planners, nongovernmental agencies, and donors. Six UN agencies are engaged in the development of the tool, along with experts for each key area, who provide technical assistance. Representatives from several countries have also been involved in the development process to ensure that it will be useful for individual countries.
Figure 4-1 shows the basic framework covered by OneHealth. Six health system components form the building blocks; the bars in the center represent the levels at which action can be taken. The model is modular, so it can be adapted for different purposes. An additional benefit of its flexibility is that it encourages the involvement of experts in particular areas to conduct the planning for their domains, even while the model’s structure keeps the whole system integrated.
Stenberg acknowledged that there are already many tools and models
____________
5 For more information, see http://www.who.int/pmnch/topics/economics/costing_tools/en/index4.html (accessed November 2011).
6 For more information, see http://www.internationalhealthpartnership.net/en/home (accessed November 2011).
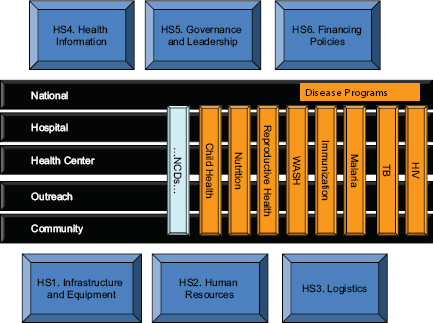
FIGURE 4-1 OneHealth framework.
NOTE: HIV = human immunodeficiency virus; NCDs = noncommunicable diseases; TB = tuberculosis; WASH = water, sanitation, and hygiene.
SOURCE: Stenberg (2011b).
available for health planning. She believes, however, that this particular one is important not only because it offers the possibility of coordination across agencies, countries, and other units, but also because it is the first to “bring together disease-specific planning with health systems in a unified way.” OneHealth allows a person “to do a situation analysis, look at the capacity of the health system, look at different strategies, do priority setting, and look at financial implications.” OneHealth also incorporates some of the UN’s epidemiology impact models, such as the Lives Saved Tool (LiST) and the AIDS Impact Model (AIM), which can be used to demonstrate achievable health gains and to predict reductions in disease prevalence resulting from specific health care models.
The software is also very user-friendly, Stenberg added. The user can adapt the model to local circumstances and chose the level of detail that is most useful for a given purpose. For example, the model might be used to answer such questions as “What set of interventions will have a desired impact in my setting? What constraints in my system need to be addressed
before I can scale up a promising intervention? How feasible would a given intervention be if I have to adapt in certain ways in order to implement it in a given setting? What funding will I need to accomplish X?” A user might want to cost and budget a plan that has been already developed, or perhaps compare alternative scenarios. “It helps to make the planning more realistic, as opposed to setting very ambitious targets that you may not be able to achieve,” Stenberg said. For example, a user with a target of scaling up an intervention to 90 percent coverage for a given disease or risk factor can click on the human resources module to determine whether the health system has a sufficient number of nurses or community health workers to deliver the intervention. If not, the user can adjust the target and explore other pathways for scaling up the intervention.
The OneHealth model faces the same data challenges that affect the other models discussed, Stenberg said. Another challenge is ensuring that each country has the capacity to take full advantage of the tool’s possibilities. Despite the challenges, Stenberg concluded, the OneHealth model provides a common platform and consistent methods for countries to use and a way to ensure that their health systems’ capacity is what drives planning and priority setting. As funding permits, the development team will continue to add new elements to the model, such as a health information systems module and models for health gains for noncommunicable diseases.
Stenberg closed with her recommendations for designing and applying a costing model as part of a toolkit:
• Be very clear about the specific policy questions to be answered, how the tools will be used and by whom.
• Focus on broad health sector planning processes and ways to integrate across programs.
• Don’t overlook the need to invest in capacity building, advocacy, communication, and training in how to use the tools.
PRIORITY SETTING TOOLS
The Lives Saved Tool for Maternal and Child Health
The purpose of the Lives Saved Tool (LiST)7 is straightforward, explained Neff Walker of Johns Hopkins University. It is intended to estimate the impact that increasing health coverage has on maternal and neonatal health, child mortality, and stillbirths. It is a computer-based tool that countries or program developers can use to estimate the relative impact of a wide range of possible interventions and levels of coverage for purposes
____________
7 For more information, see http://www.jhsph.edu/dept/ih/IIP/list/ (accessed November 2011).
of strategic planning. It is incorporated in the OneHealth model discussed above.
To use LiST, users begin by plugging in data for a particular country or region, such as neonatal and maternal mortality rates, current health coverage and interventions, and background information (e.g., vitamin A or zinc deficiencies or exposure to P. falciparum). Data on the effectiveness of many interventions, in terms of reducing either a cause or a risk factor of maternal or child death, are already programmed into the model, which currently includes more than 20 causes of death and risk factors (e.g., stunting, wasting, and intrauterine growth restriction).
The program has data for 85 low- and middle-income countries as well as for individual states in large countries. The demographic data are from the UN Population Division, the cause of death data are from WHO estimates, and the mortality rates come from the Inter-Agency Group for Mortality Estimation. The effectiveness values are from WHO’s Child Health Epidemiology Reference Group, and the data on coverage are from several sources: the Department of Homeland Security, the Multiple Indicator Cluster Survey, the Malaria Indicator Survey, the United Nations, and WHO/UNICEF estimates of vaccine coverage. The data also cover countries’ actions regarding HIV/AIDS and family planning, which influence maternal and child outcomes.
As an example of how the tool can be used, Walker said that a user focused on vaccines could assess the impact on mortality of increasing pneumococcal and rotavirus vaccination. Such vaccines would likely have little impact on maternal mortality but could have a significant impact in some countries on infant mortality. The model is structured to make it possible to compare multiple scenarios—for example, comparing the impact of 80 percent coverage of pneumococcal vaccine with 80 percent coverage with antibiotics. The model also allows users to consider the outcome if two or more interventions were scaled up at the same time and to generate a variety of counter-factual scenarios—that is, asking what would happen if an alternate course were followed. The scenarios also help users anticipate unexpected outcomes, Walker noted. For example, an effective intervention that reduces neonatal mortality might indirectly increase malaria rates because if more infants survive, more may be exposed to malaria, unless there is an increase in anti-malaria efforts as well.
The model is fairly simple, Walker said, but once all the factors are combined, the result is still rather complex. As an illustration of this complexity, Figure 4-2 depicts all of the factors that have an effect on pneumonia mortality, some of which are indirect. For example, the actions in the upper left related to hygiene reduce the incidence of diarrhea, which in turn lowers rates of stunting, which is beneficial because children whose growth is stunted have a significantly increased risk of dying of pneumonia.
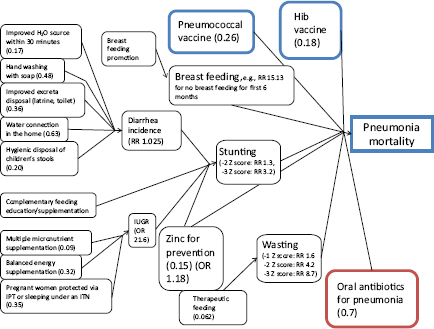
FIGURE 4-2 Factors and weights used in the LiST model that effect pneumonia mortality.
NOTE: Hib = haemophilus influenza type B; IPT = intermittent preventive treatment; ITN = insecticide-treated mosquito net; OR = odds ratio; RR = relative risk.
SOURCE: Walker (2011).
Similarly, interventions that affect intrauterine growth (lower left corner) also reduce stunting. The current model is not complete, however, and a participant pointed out a few elements that are missing from the current model, such as tobacco use, indoor air pollution, and gestational diabetes, all of which influence birth weight and infant death.
LiST has been used by many large organizations, such as WHO, UNICEF, the U.S. Agency for International Development, the Global Fund, and Save the Children, for priority setting and to support their advocacy, Walker said. More than 40 developing countries have used it to support their strategic planning, though only six or seven have used it as part of their national planning processes. LiST has also been used for the evaluation of programs, for example by the Global Fund and Roll Back Malaria.
There are several keys to success for LiST and other such models, Walker said. First, it is critical to have an ongoing system for developing and updating the assumptions that are part of the model. It is also impor-
tant that the model be easy for users to learn. It should require not more than about 2 days of training for the users to be able to easily change the default values as they modify the model for the circumstances they are assessing, and it should be available in multiple languages. LiST is strong in those areas, Walker noted—it is now available in four languages, for example—but it is also important to have some sort of organizational backing for the model to work with individual countries, and LiST is just now being adopted by UNICEF and WHO. Another important factor is to have published evidence of a model’s effectiveness, Walker said, and LiST satisfies that criterion as well.8 The most difficult key to success, Walker said, may be to ensure that the model harmonizes with other models and approaches. Because of the involvement of WHO and UNICEF, LiST has been integrated with several models with broader scopes, but there are many other disease-specific models as well, so the harmonization of LiST with other models remains a challenge. Walker’s last word of advice was that it is very important to “define your primary task and try to stick to it—don’t let mission creep take over.”
A Multi-Criteria Decision Analysis Framework
The key question in setting health system priorities, said Mireille Goetghebeur of BioMedCom and the EVIDEM collaboration, is which interventions will contribute most to an equitable, efficient, and sustainable health care system. To answer this question, she said, it is necessary to consider both what should be done and what can be done. To tackle those two questions, it is useful to have a mechanism to rank or compare a range of possible interventions across a broad range of criteria. Multi-criteria decision analysis (MCDA) provides a tool for doing precisely this by assigning weights to a range of relevant and possibly conflicting criteria. Goetghebeur described a particular Web-based framework for applying this approach to decision making and priority setting for health care developed by the EVIDEM Collaboration.9 The EVIDEM Collaboration of researchers and decision makers from a variety of countries has developed a decision-making framework that is available on the Internet and is supported by a Web registry of research on health care interventions and a discussion forum. EVIDEM is intended to develop a community of MCDA practice,
____________
8 For more information, see http://www.jhsph.edu/dept/ih/IIP/list/applications.html (accessed February 2012).
9 EVIDEM was founded by researchers at BioMedCom, a consulting firm that specializes in economic analysis and its application in the health sector, and its board of directors includes policy makers, health care professionals, patients, researchers, members of the health care industry, and other specialists. For more information, see https://www.evidem.org/ (accessed November 2011).
Goetghebeur said, in which researchers and users develop, apply, and adapt the tools in a continuous, open, and nonproprietary fashion.
EVIDEM began with a generic framework for assessing and ranking interventions, based on an adaptable set of criteria. There are two modules, the MCDA core model, which is a universal template, and the contextual tool, which allows users to adapt it to specific circumstances. The core model is based on four principles: that the criteria should be complete, should have minimum overlap among them, should be mutually independent, and should be operational (National Economic Research Associated, 2005). Those principles yielded a set of 15 universal normative criteria in the core model, based on the assumptions that the highest value or priority should be assigned to interventions that
• address severe diseases;
• address common diseases;
• address diseases with many unmet needs;
• are recommended by expert consensus;
• confer major improvements in efficacy/effectiveness over current standard care;
• confer major improvement in patients’ perceived health over current standard care;
• either confer major risk reduction or major alleviation of suffering;
• result in savings in health care intervention, medical, or non-medical expenditures; and
• are supported by sufficient data that are fully reported, valid, and relevant.
To address the question of what can be done in a given context, there is a contextual tool with six criteria to help users define objectives and priorities of the population as well as feasibility. According to this tool, the decision-making process must address the following issues:
• Scope and mission of the health care system or plan
• Priorities for populations and access
• Opportunity costs (interventions foregone) and affordability
• System capacity (e.g., infrastructure, skills) and appropriate use of intervention
• Political/historical context (e.g., cultural acceptance, precedents)
• Pressures/barriers from health care stakeholders
To use the framework, a user would first assign weights to the criteria, and then, based on these weights, score and rank the potential interventions. The contextual module can then be used to factor in the other
elements (discussed above), and a financial tool is used to consider affordability and related issues. To demonstrate the process, Goetghebeur showed the workshop audience a prototype that is available to demonstrate the process,10 and provided a link to additional prototypes that serve as examples of the application of the framework.11
One workshop participant noted that certain assumptions about shared ethical preferences seem to underlie the framework and wondered how weights are assigned to ethical or value-based criteria. The weights are defined by the users, Goetghebeur replied, and the overall weighting would reflect the preferences expressed by each of the stakeholders involved in the process (who might be asked to systematically rank possible considerations in order of priority). For each of the broad criteria, she added, there is a set of sub-criteria designed to help users tailor their responses. The tools are also evolving in response to user feedback.
Another participant noted that the framework appears to value interventions individually and wondered how the framework addresses interactions among different approaches—that is, considering whether or how the implementation of one worthwhile intervention might affect assessments of how reasonable another might be. Goetghebeur responded that the assessment of current interventions and what they are contributing is part of the framework.
There are a number of applications for the framework and for the information on the Web site, Goetghebeur said. Policy makers, physicians, patients, researchers, and developers of new health care programs and interventions all might use the framework to find information and make decisions. In New Zealand and Italy, the MCDA tool is being used to assess the reimbursement or implementation of health technology and drugs. At the level of health care professionals, the tool has been used to develop clinical practice guidelines, with the goal of making a link between the guidelines and the decision making at the regulatory and reimbursement level. The tool can also be used for identifying priority research questions and data needs. The MCDA framework can also be used to inform the development stage for new health care interventions or new health care programs. Finally, the framework can be used as a tool to communicate validated information to a range of stakeholders in a digestible format.
Goetghebeur identified some of the program’s key strengths and limitations, organized into four main areas:
____________
10 The interactive demonstration prototype is available at http://www.evidem.org/tiki/?page=DEMO-main.
11 Additional example prototypes are available at http://www.evidem.org/evidem-collaborative.php.
Utility to Policy Makers
• Adaptable to local context
• Systematizes decision-making process
• Combines quantitative and qualitative inputs
• Identifies applicable criteria and perspectives
• Based on a wide set of criteria
• Transparent
But
• Perceived as very complex
• May be difficult to integrate with existing processes
• There is a risk that MCDA may be used in a formulaic way rather than as a support to priority setting.
Methodology
• Pragmatic, user-friendly and modular
• Instructions are detailed
• Open-source—so users benefit from others’ work
But
• Criteria selection and weighting process may be challenging.
Data Requirements
• Comprehensive but modular
• Open web registry—so users benefit from others’ work
But
• The Web registry is just in a beginning phase.
• Data synthesis by criteria may be challenging.
Capacity and Training Requirements
• A testing package is available in toolkit.
• There is a growing community of developers and users.
But
• Expertise with MCDA is limited in the health care sector.
The EVIDEM framework, Goetghebeur concluded, provides a mechanism for priority setting that is transparent and consistent and that can help users identify the interventions that will contribute most to sustainable and efficient disease control and that will reflect the priorities and preferences of decision makers across a wide range of criteria.


