
Although the vast majority of earthquakes that occur in the world each year have natural causes, some of these earthquakes and a number of lesser-magnitude seismic events are related to human activities and are called induced seismic events or induced earthquakes. Induced seismic activity has been documented since at least the 1920s and has been attributed to a range of human activities, including the impoundment of large reservoirs behind dams, controlled explosions related to mining or construction, and underground nuclear tests. In addition, energy technologies that involve injection or withdrawal of fluids from the subsurface can also create induced seismic events that can be measured and felt. Historically known induced seismicity has generally been small in both magnitude and intensity of ground shaking.
Recently, several induced seismic events related to energy technology development projects in the United States have drawn heightened public attention. Although none of these events resulted in loss of life or significant structural damage, their effects were felt by local residents, some of whom also experienced minor property damage. Particularly in areas where tectonic (natural) seismic activity is uncommon and energy development is ongoing, these induced seismic events, though small in scale, can be disturbing to the public and raise concern about increased seismic activity and its potential consequences.
This report addresses induced seismicity that may be related to four energy development technologies that involve fluid injection or withdrawal: geothermal energy, conventional oil and gas development including enhanced oil recovery (EOR), shale gas recovery, and carbon capture and storage (CCS). These broad categories of energy technologies, including underground wastewater disposal, are discussed in detail as they relate to induced seismic events. The study arose through a request by Senator Bingaman of New Mexico to Department of Energy (DOE) Secretary Stephen Chu. The DOE was asked to engage the National Research Council to examine the scale, scope, and consequences of seismicity induced during the injection of fluids related to energy production; to identify gaps in knowledge and research needed to advance the understanding of induced seismicity; to identify gaps in induced seismic hazard assessment methodologies and the research needed to close those gaps; and to assess options for interim steps toward best practices with regard to energy development and induced seismicity potential. The report responds to this charge and aims to provide an understanding of the nature and scale of induced seismicity caused by or likely related to energy development and guidance as to how best to proceed with safe development of these technologies while minimizing their potential to induce earthquakes that can be felt by the public.
INDUCED SEISMICITY RELATED TO FLUID INJECTION OR WITHDRAWAL AND CAUSAL MECHANISMS
Seismic events have been measured and felt at a limited number of energy development sites in the United States. Seismic events caused by or likely related to energy development have been documented in Alabama, Arkansas, California, Colorado, Illinois, Louisiana, Mississippi, Nebraska, Nevada, New Mexico, Ohio, Oklahoma, and Texas (Figure S.1). Proving that a particular seismic event was caused by human activity is often difficult because conclusions about the causal relationship rely on local data, prior seismicity, and the preponderance of scientific studies. In this report we give examples of seismic events that
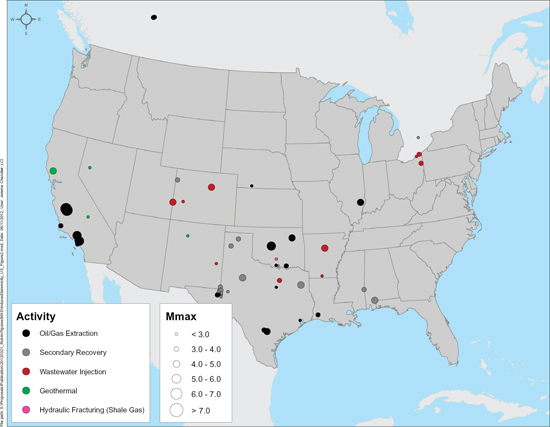
FIGURE S.1 Sites in the United States and Canada with documented reports of seismicity caused by or likely related to energy development from various energy technologies. The reporting of the occurrence of small induced seismic events is limited by the detection and location thresholds of local surface-based seismic monitoring networks.
are universally believed to have been caused by human activities, as well as seismic events for which the evidence for causality is credible but less solid.
Research conducted on some of these incidents has led to better understanding of the probable physical mechanisms of inducing seismic events and allowed for the identification of criteria that could be used to predict whether future induced seismic events might occur. The most important criteria include the amplitude and direction of the state of stress in the Earth’s crust in the vicinity of the fluid injection or withdrawal area; the presence, orientation, and physical properties of nearby faults; pore fluid pressure (pressure of fluids in the pores of the rocks at depth, hereafter simply called pore pressure); pore pressure change; the rates and volumes of fluid being injected or withdrawn; and the rock properties in the subsurface.
Seismicity induced by human activity related to energy technologies is caused by change in pore pressure and/or change in stress taking place in the presence of (1) faults with specific properties and orientations and (2) a critical state of stress in the rocks. In general, existing faults and fractures are stable (or are not sliding) under the natural horizontal and vertical stresses acting on subsurface rocks. However, the crustal stress in any given area is perpetually in a state in which any stress change, for example, through a change in subsurface pore pressure due to injecting or extracting fluid from a well, may change the stress acting on a nearby fault. This change in stress may result in slip or movement along that fault, creating a seismic event. Abrupt or nearly instantaneous slip along a fault releases energy in the form of energy waves (“seismic waves”) that travel through the Earth and can be recorded and used to infer characteristics of energy release on the fault. Magnitude “M” measures the total amount of energy released at the seismic event source, whereas “intensity” of a seismic event is a measure of the level of ground shaking at any location. Both the magnitude and the maximum intensity of a seismic event are directly related to the total area of the fault that undergoes movement: a larger area of slip along the fault results in a larger seismic event.
Although the general mechanisms that create induced seismic events are well understood, current computer modeling techniques cannot fully address the complexities of natural rock systems in large part because the models generally lack information on local crustal stress, rock properties, fault locations and properties, and the shape and size of the reservoir into which fluids are injected or withdrawn. When adequate knowledge of this information is available, the possibility exists to make accurate predictions of earthquake occurrences. Without this detailed information, hazard and risk assessments have to be based on statistical analysis of data from analogous regions. The ability to predict induced seismicity at a particular energy development site will continue to rely on both theoretical modeling and available data including field measurements, and on statistical methods.
ENERGY TECHNOLOGIES AND THEIR INDUCED SEISMICITY POTENTIAL
Geothermal energy, oil and gas production (including hydraulic fracturing for shale gas production), and CCS technologies each involve fluid injection and/or withdrawal. Therefore, each technology has the potential to induce seismic events that can be felt. Seismic events with M greater than 2.0 have the possibility of being felt, particularly if they occur at shallow depths, but smaller seismic events (M < 2.0) generally are not felt. The injection rate and pressure, fluid volumes, and injection duration vary with the technology as do the potential sizes of the seismic events and the possible risk and hazards of the induced events (Table S.1).
Geothermal Energy
The three different types of geothermal energy resources are (1) “vapor dominated,” where primarily steam is contained in the pores or fractures of hot rock; (2) “liquid dominated,” where primarily hot water is contained in the rock; and (3) “enhanced geothermal systems” (EGS), where the resource is hot, dry rock that requires engineered stimulation to allow fluid movement for commercial development. Although felt induced seismicity has been documented with all three types of geothermal resources (Table S.1), geothermal development usually attempts to keep a mass balance between fluid volumes produced and fluids replaced by injection to extend the longevity of the energy resource. This fluid balance helps to maintain fairly constant reservoir pressure—close to the initial, preproduction value—and can aid in reducing the potential for induced seismicity. Seismic monitoring at liquid-dominated geothermal fields in the western United States has demonstrated relatively few occurrences of felt induced seismicity. However, in The Geysers geothermal steam field in Northern California, the large temperature difference between the injected fluid and the geothermal reservoir results in significant cooling of the hot subsurface reservoir rocks, causing the rocks to contract, reducing confining pressures, and allowing the release of local stresses that results in a significant amount of observed induced seismicity. EGS technology is in the early stages of development; many countries, including the United States, have pilot projects to test the potential for commercial production. In each case of active EGS development, at least some, generally minor, levels of felt induced seismicity have been recorded.
Conventional and Unconventional Oil and Gas Development, Including EOR and Shale Gas
In a conventional oil or gas reservoir the hydrocarbon fluids and associated aqueous fluids in the pore spaces of the rock are usually under significant natural pressure. Fluids in
the oil or gas reservoir flow to the surface when penetrated by a well bore, generally aided by pumping. Oil or gas reservoirs often reach a point when insufficient pressure, even in the presence of pumping, exists to allow sufficient hydrocarbon recovery. Various technologies, including secondary recovery and tertiary recovery (the latter is often referred to as enhanced oil recovery [EOR], which is the term used hereafter), can be used to extract some of the remaining oil and gas. Secondary recovery and EOR technologies both involve injection of fluids into the subsurface to push more of the trapped hydrocarbons out of the pore spaces in the reservoir and to maintain reservoir pore pressure. Secondary recovery often uses water injection or “waterflooding,” and EOR technologies often inject carbon dioxide (CO2). Approximately 151,000 injection wells are currently permitted in the United States for a combination of secondary recovery, EOR, and wastewater disposal, with only very few documented incidents where the injection caused or was likely related to felt seismic events (Table S.1). Secondary recovery—through waterflooding—has been associated with very few felt induced seismic events (Table S.1). Among the tens of thousands of wells used for EOR in the United States, the committee did not find any documentation in the published literature of felt induced seismicity, nor were any instances raised by experts in the field with whom the committee communicated during the study. Oil and gas extraction (fluid withdrawal) from a reservoir may cause induced seismic events. These events are rare relative to the large number of oil and gas fields around the world and appear to be related to a decrease in pore pressure as fluid is withdrawn (Table S.1).
Similar to geothermal systems, conventional oil and gas projects are designed to maintain the pore pressure within a field at its preproduction level by maintaining a balance between fluids being removed from one part of the reservoir and fluids injected in another part of the reservoir. The proportionally very small number of induced seismic events generated by these technologies relative to the large number of wells is in part due to this effort to maintain the original pore pressure of the reservoir.
Shale formations can also contain hydrocarbons—gas and/or oil. The extremely low permeability of these rocks has trapped the hydrocarbons as they developed in the rock and largely prevented them from migrating out of the rock over geologic time. The low permeability also prevents the hydrocarbons from easily flowing into a well bore without production stimulation by the operator. These types of “unconventional” reservoirs are developed by drilling wells horizontally through the reservoir rock and using hydraulic fracturing techniques to create new fractures in the reservoir to allow the hydrocarbons to migrate up the well bore. About 35,000 hydraulically fractured shale gas wells exist in the United States (Table S.1); only one case of felt seismicity (M ~ 2.8) in the United States has been described in which hydraulic fracturing for shale gas development is suspected, but not confirmed, as the cause (Table S.1). Globally only one case of felt induced seismicity in England (M 2.3) has been confirmed to have been caused by hydraulic fracturing for shale gas development. The very low number of felt events relative to the large number of
TABLE S.1 Summary Information about Historical Felt Seismic Events Caused by or Likely Related to Energy Technology Development in the United Statesa
| Energy Technology | Number of Projects | Number of Felt Induced Events | Maximum Magnitude of Felt Events | Number of Events M ≥ 4.0b | Net Reservoir Pressure Change | Mechanism for Induced Seismicity | Location of M ≥ 2.0 Events |
| Vapor-dominated geothermal | 1 | 300-400 per year since 2005 | 4.6 | 1-3 per year | Attempt to maintain balance | Temperature change between injectate and reservoir | CA (The Geysers) |
| Liquid-dominated geothermal | 23 | 10-40 per year | 4.1c | Possibly one | Attempt to maintain balance | Pore pressure increase | CA |
| Enhanced geothermal systems | ~8 pilot projects | 2-5 per yeard | 2.6 | 0 | Attempt to maintain balance | Pore pressure increase and cooling | CA, NV |
| Secondary oil and gas recovery (waterflooding) | ~108,000 (wells) | One or more events at 18 sites across the country | 4.9 | 3 | Attempt to maintain balance | Pore pressure increase | AL, CA, CO, MS, OK, TX |
| Tertiary oil and gas recovery (EOR) | ~13,000 (wells) | None known | None known | 0 | Attempt to maintain balance | Pore pressure increase (likely mechanism) | None known |
| Hydraulic fracturing for shale gas production | 35,000 (wells) | 1 | 2.8 | 0 | Initial positive; then withdraw | Pore pressure increase | OK |
| Hydrocarbon withdrawal | ~6,000 fields | 20 sites | 6.5 | 5 | Withdrawal | Pore pressure decrease | CA, IL, NB, OK, TX |
| Wastewater disposal wells | ~30,000 | 9 | 4.8e | 7 | Addition | Pore pressure increase | AR, CO, OH |
| Carbon capture and storage, small scale | 2f | None known | None known | 0 | Addition | Pore pressure increase | IL, MS |
| Carbon capture and storage, large scale | 0 | None | None | 0 | Addition | Pore pressure increase | None yet in operation |
aNote that in several cases the causal relationship between the technology and the event was suspected but not confirmed. Determining whether a particular earthquake was caused by human activity is often very difficult. The references for the events in this table and the way in which causality may be determined are discussed in the report. Also important is the fact that the well numbers are those wells in operation today, while the numbers of seismic events that are listed refer to events that have taken place over a total period of decades.
bAlthough seismic events M > 2.0 can be felt by some people in the vicinity of the event, events M ≥ 4.0 can be felt by most people and may be accompanied by more significant ground shaking, potentially causing greater public concern.
cOne event of M 4.1 was recorded at Coso, but the committee did not obtain enough information to determine whether or not the event was induced.
dEstimate based on the fact that there have been events reported in the mid M 2 range at previously active sites and currently active sites but without a large number of total projects (sites) from which to acquire information over time.
eM 4.8 is a moment magnitude. Earlier studies reported magnitudes up to M 5.3 on an unspecified scale; those magnitudes were derived from local instruments.
fNoncommercial, pilot projects with active injection supported by the Department of Energy.
hydraulically fractured wells for shale gas is likely due to the short duration of injection of fluids and the limited fluid volumes used in a small spatial area.
Wastewater Disposal Wells Associated with Energy Extraction
In addition to fluid injection directly related to energy development, injection wells drilled to dispose of wastewater generated during oil and gas production are very common in the United States. Tens of thousands of wastewater disposal wells are currently active throughout the country. Although only a few induced seismic events have been linked to these disposal wells (Table S.1), the occurrence of these events has generated considerable public concern. Examination of these cases has suggested causal links between the injection zones and previously unrecognized faults in the subsurface.
In contrast to wells for EOR, which are sited and drilled for precise injection into well-characterized oil and gas reservoirs, injection wells used only for the purpose of wastewater disposal normally do not have a detailed geologic review performed prior to injection, and the data are often not available to make such a detailed review. Thus, the location of possible nearby faults is often not a standard part of siting and drilling these disposal wells. In addition, the presence of a fault does not necessarily imply an increased potential for induced seismicity, creating challenges for the evaluation of potential sites for disposal injection wells that will minimize the possibility for induced seismic activity.
Carbon Capture and Storage
For several years researchers have explored various methods for reducing carbon emissions to the atmosphere, such as by capturing CO2 and developing means for storing (or sequestering) it permanently underground. If technically successful and economical, CCS could become an important technology for reducing CO2 emissions to the atmosphere. The risk of induced seismicity from CCS is currently difficult to accurately assess. With only a few small-scale commercial projects overseas and several small-scale demonstration projects under way in the United States, few data are available to evaluate the induced seismicity potential of this technology (Table S.1); these projects so far have involved very small injection volumes. CCS differs from other energy technologies in that it involves continuous CO2 injection at high rates under pressure for long periods of time, and it is purposely intended for permanent storage (no fluid withdrawal). Given that the potential magnitude of an induced seismic event correlates strongly with the fault rupture area, which in turn relates to the magnitude of pore pressure change and the rock volume in which it exists, large-scale CCS may have the potential for causing significant induced seismicity. CCS projects that do not cause a significant increase in pore pressure above its original value will likely minimize the potential for inducing seismic events.
Energy Technology Summary
The balance of injection and withdrawal of fluids is critical to understanding the potential for induced seismicity with respect to energy technology development projects. The factors important for understanding the potential to generate felt seismic events are complex and interrelated and include the rate of injection or extraction, the volume and temperature of injected or extracted fluids, the pore pressure, the permeability of the relevant geologic layers, faults and fault properties, crustal stress conditions, the distance from the injection point, and the length of time over which injection and/or withdrawal takes place. However, the net fluid balance (total balance of fluid introduced and removed) appears to have the most direct consequence on changing pore pressure in the subsurface over time. Energy technology projects that are designed to maintain a balance between the amount of fluid being injected and the amount of fluid being withdrawn, such as geothermal and most oil and gas development, may produce fewer induced seismic events than technologies that do not maintain fluid balance.
Of the well-documented cases of induced seismicity related to fluid injection, many are associated with operations involving large amounts of fluid injection over significant periods of time. Most wastewater disposal wells typically involve injection at relatively low pressures into large porous aquifers that have high natural permeability and are specifically targeted to accommodate large volumes of fluid. Thus, although a few occurrences of induced seismic activity have been documented, the majority of the hazardous and nonhazardous wastewater disposal wells do not pose a hazard for induced seismicity. However, the long-term effects of any significant increases in the number of wastewater disposal wells on induced seismicity are unknown.
The largest induced seismic events reported in the technical literature are associated with projects that did not balance the large volumes of fluids injected into, or extracted from, the Earth within the reservoir. This is a statistical observation; the net volume of fluid that is injected and/or extracted may serve as a proxy for changes in subsurface stress conditions and pore pressure, injection and extraction rates, and other factors. Coupled thermomechanical and chemomechanical effects may also play a role in changing subsurface stress conditions. Projects with large net volumes of injected or extracted fluids over long periods of time such as long-term wastewater disposal wells and CCS would appear to have a higher potential for larger induced events. The magnitude and intensity of possible induced events would be dependent upon the physical conditions in the subsurface—the state of stress in the rocks, presence of existing faults, fault properties, and pore pressure. The relationship between induced seismicity and projects with large-volume, long-term injection, such as in large-scale CCS projects, is untested because no large-scale projects are yet in existence.
UNDERSTANDING AND MANAGING HAZARDS AND RISKS ASSOCIATED WITH INDUCED SEISMICITY FROM ENERGY DEVELOPMENT
The hazard of induced seismicity is the description and possible quantification of what physical effects will be generated by human activities associated with subsurface energy production or CCS. The risk of induced seismicity is the description and possible quantification of how induced seismic events might cause losses, including damage to structures, and effects on humans, including injuries and deaths. If seismic events occur in an area with no structures or humans present, there is no risk. The concept of risk can also be extended to include frequent occurrence of ground shaking that is a nuisance to humans.
Several questions can be addressed to understand and possibly quantify the hazard and risk associated with induced seismicity associated with energy technologies. Questions associated with understanding the hazard include whether an energy technology generates apparent seismic events, whether such events are of M > 2.0, whether the events generate ground shaking (shallower earthquakes have greater likelihood of causing felt ground shaking than deep earthquakes), and the effects of the shaking. Risk to structures occurs only if the shaking is minor, moderate, or larger; risk to structures does not occur if the shaking is felt by humans but is not strong enough to damage the structures.
The quantification of hazard and risk requires probability assessments, which may be either statistical (based on data) or analytical (based on scientific and engineering models). These assessments can then be used to establish “best practices” or specific protocols for energy project development. A risk analysis of an entire industry project would include the extent of the spatial distribution of the operation and the multiple structures in the area that an induced seismic event might affect. While the risk of minor, moderate, or heavy damage from induced event shaking may be small from an individual well, a large number of spatially distributed wells may lead to a higher probability of such damage; a risk analysis of an industry operation thus includes the entire spatial distribution of the operation and the structures an earthquake might affect.
Although historical data indicate that induced seismic events have not generally been very large nor have they resulted in significant structural damage, induced seismic events are of concern to affected communities. Practices that consider induced seismicity both before and during the actual operation of an energy project can be employed in the development of a “best practices” protocol specific to each energy technology. The aim of such protocols is to diminish the possibility of a felt seismic event occurring and to mitigate the effects of an event if one should occur. A “traffic light” control system within a protocol can be established to respond to an instance of induced seismicity, allowing for low levels of seismicity, but adding monitoring and mitigation requirements, including the requirement to modify or even cease operations if seismic events are of sufficient intensity to result in a
significant concern to public health and safety. The ultimate success of such a protocol is fundamentally tied to the strength of the collaborative relationships and dialogue among operators, regulators, the research community, and the public.
GOVERNMENT ROLES AND RESPONSIBILITIES
Four federal agencies—the Environmental Protection Agency (EPA), the Bureau of Land Management, the U.S. Forest Service, and the U.S. Geological Survey (USGS)—and different state agencies have regulatory oversight, research roles, and/or responsibilities related to different aspects of the underground injection activities that are associated with energy technologies. To date, these various agencies have dealt with induced seismic events with different and localized actions. These efforts to respond to potential induced seismic events have been successful but have been ad hoc in nature. Many events that scientists suspect may be induced are not labeled as such, due to lack of confirmation or evidence that those events were in fact induced by human activity. In areas of low historical seismicity, the national seismic network coverage tends to be sparser than that in more seismically active areas, making it difficult to detect small events and to identify their locations accurately.
ADDRESSING INDUCED SEISMICITY
The primary findings, gaps in knowledge or information, proposed actions, and research recommendations to address induced seismicity potential in energy technologies are presented below. Details specific to each energy technology are elaborated in Chapter 7.
Overarching Issues
FINDINGS
1. The basic mechanisms that can induce seismic events related to energy-related injection and extraction activities are not mysterious and are presently well understood.
2. Only a very small fraction of injection and extraction activities among the hundreds of thousands of energy development wells in the United States have induced seismicity at levels that are noticeable to the public.
3. Models to predict the size and location of earthquakes in response to net fluid injection or withdrawal require calibration from field data. The success of these models is compromised in large part due to the lack of basic data on the interactions among rock, faults, and fluid as a complex system; these data are difficult and expensive to obtain.
4. Increase of pore pressure above ambient value due to injection of fluids and decrease in pore pressure below ambient value due to extraction of fluids have the potential to produce seismic events. For such activities to cause these events, a certain combination of conditions has to exist simultaneously:
a. Significant change in net pore pressure in a reservoir
b. A preexisting near-critical state of stress along a fracture or fault that is determined by crustal stresses and the fracture or fault orientation
c. Fault rock properties supportive of a brittle failure
5. Independent capability exists for geomechanical modeling of pore pressure, temperature, and rock stress changes induced by injection and extraction and for modeling of earthquake sequences given knowledge of stress changes, pore pressure changes, and fault characteristics.
6. The range of scales over which significant responses arise in the Earth with respect to induced seismic events is very wide and challenges the ability of models to simulate and eventually predict observations from the field.
BOX S.1
Research Recommendations
Data Collection—Field and Laboratory
1. Collect, categorize, and evaluate data on potential induced seismic events in the field. High-quality seismic data are central to this effort. Research should identify the key types of data to be collected and the data collection protocol.
2. Conduct research to establish the means of making in situ stress measurements nondestructively.
3. Conduct additional field research on microseismsa in natural fracture systems including field-scale observations of the very small events and their native fractures.
4. Conduct focused research on the effect of temperature variations on stressed jointed rock systems. Although of immediate relevance to geothermal energy projects, the results would benefit understanding of induced seismicity in other energy technologies.
5. Conduct research that might clarify the in situ links among injection rate, pressure, and event size.
Instrumentation
1. Conduct research to address the gaps in current knowledge and availability of instrumentation: Such research would allow the geothermal industry, for example, to develop this domestic renewable source more effectively for electricity generation.
Hazard and Risk Assessment
1. Direct research to develop steps for hazard and risk assessment for single energy development projects (as described in Chapter 5, Table 5.2).
GAPS
1. The basic data on fault locations and properties, in situ stresses, fluid pressures, and rock properties are insufficient to implement existing models with accuracy on a site-specific basis.
2. Current predictive models cannot properly quantify or estimate the seismic efficiency and mode of failure; geomechanical deformation can be modeled, but a challenge exists to relate this to number and size of seismic events.
PROPOSED ACTIONS
The actions proposed to advance understanding of the types and causes of induced seismicity involve research recommendations outlined in Box S.1. These recommendations also have relevance for specific energy technologies and address gaps in present understanding of induced seismicity.
Modeling
1. Identify ways simulation models can be scaled appropriately to make the required predictions of the field observations reported.
2. Conduct focused research to advance development of linked geomechanical and earthquake simulation models that could be utilized to better understand potential induced seismicity and relate this to number and size of seismic events.
3. Use currently available and new geomechanical and earthquake simulation models to identify the most critical geological characteristics, fluid injection or withdrawal parameters, and rock and fault properties controlling induced seismicity.
4. Develop simulation capabilities that integrate existing reservoir modeling capabilities with earthquake simulation modeling for hazard and risk assessment. These models can be refined on a probabilistic basis as more data and observations are gathered and analyzed.
5. Continue to develop capabilities with coupled reservoir fluid flow and geomechanical simulation codes to understand the processes underlying the occurrence of seismicity after geothermal wells have been shut in; the results may also contribute to understanding post-shut-in seismicity in relation to other energy technologies.
aMicroseisms designate seismic events that are not generally felt by humans, and in this report are M < 2.
Energy Technologies
FINDINGS
1. Injection pressures and net fluid volumes in energy technologies, such as geothermal energy and oil and gas production, are generally controlled to avoid increasing pore pressure in the reservoir above the initial reservoir pore pressure. These technologies thus appear less problematic in terms of inducing felt seismic events than technologies that result in a significant increase or decrease in net fluid volume.
2. The induced seismic responses to injection or extraction differ in cause and magnitude among each of the three different forms of geothermal resources. Decrease of the temperature of the subsurface rocks caused by injection of cold water in a geothermal field has the potential to produce seismic events.
3. The potential for felt induced seismicity due to secondary recovery and EOR is low.
4. The process of hydraulic fracturing a well as presently implemented for shale gas recovery does not pose a high risk for inducing felt seismic events.
5. The United States currently has approximately 30,000 Class II1 wastewater disposal wells among a total of 151,000 Class II injection wells (which includes injection wells for both secondary recovery and EOR). Very few felt seismic events have been reported as either caused by or temporally associated with wastewater disposal wells; these events have produced felt earthquakes generally less than M 4.0. Reducing injection volumes, rates, and pressures has been successful in decreasing rates of seismicity associated with wastewater injection.
6. The proposed injection volumes of liquid CO2 in large-scale sequestration projects are much larger than those associated with other energy technologies. There is no experience with fluid injection at these large scales and little data on seismicity associated with CO2 pilot projects. If the reservoirs behave in a similar manner to oil and gas fields, these large net volumes may have the potential to impact the pore pressure over vast areas. Relative to other energy technologies, such large spatial areas may have potential to increase both the number and the magnitude of seismic events.
PROPOSED ACTION
Because of the lack of experience with large-scale fluid injection for CCS, continued research supported by the federal government is needed on the potential for induced seismicity in large-scale CCS projects (see Box S.1). As part of a continued research effort,
_____________________
1 Class II wells are specifically those that address injection of brines and other fluids associated with oil and gas production and hydrocarbons for storage.
collaboration between federal agencies and foreign operators of CCS sites is important to understand induced seismic events and their effects on the CCS operations.
Hazards and Risk Assessment
FINDING
Risk assessments depend on methods that implement assessments of hazards, but those methods currently do not exist. The types of information and data required to provide a robust hazard assessment would include
• net pore pressures, in situ stresses, and information on faults;
• background seismicity; and
• gross statistics of induced seismicity and fluid injection or extraction.
PROPOSED ACTIONS
1. A detailed methodology should be developed for quantitative, probabilistic hazard assessments of induced seismicity risk. The goal in developing this methodology would be to
• make assessments before operations begin in areas with a known history of felt seismicity and
• update assessments in response to observed induced seismicity.
2. Data related to fluid injection (well location coordinates, injection depths, injection volumes and pressures, time frames) should be collected by state and federal regulatory authorities in a common format and made publicly accessible (through a coordinating body such as the USGS).
3. In areas of high density of structures and population, regulatory agencies should consider requiring that data to facilitate fault identification for hazard and risk analysis be collected and analyzed before energy operations are initiated.
Best Practices
FINDING
The DOE Protocol for EGS is a reasonable model for addressing induced seismicity that can serve as a template for protocol development for other energy technologies.
GAP
No best practice protocol for addressing induced seismicity is generally in place for each energy technology. The committee suggests that best practice protocols be adapted and tailored to each technology to allow continued energy technology development.
PROPOSED ACTIONS
Protocols for best practice should be developed for each of the energy technologies (secondary recovery and EOR for conventional oil and gas production, shale gas production, CCS) by experts in each field, in coordination with permitting agencies, potentially following the model of the DOE EGS protocol. For all the technologies a “traffic light” system should be employed for future operations. The protocols should be applied to
• the permitting of operations where state agencies have identified areas of high potential for induced seismicity or
• an existing operation that is suspected to have caused an induced seismic event of significant concern to public health and safety.
Simultaneous development of public awareness programs by federal or state agencies in cooperation with industry and the research community could aid the public and local officials in understanding and addressing the risks associated with small-magnitude induced seismic events.
Government Roles and Responsibilities
FINDINGS
1. Induced seismicity may be produced by a number of different energy technologies and may involve either injection or extraction of fluid. However, responsibility for oversight of induced seismicity is dispersed among a number of federal and state agencies.
2. Responses to energy development-related seismic events have been addressed in a variety of manners involving local, state, and federal agencies, and research institutions. These agencies and research institutions may not have resources to address unexpected events, and more events could stress this ad hoc system.
3. Currently EPA has primary regulatory responsibility for fluid injection under the Safe Drinking Water Act, which does not explicitly address induced seismicity.
EPA is addressing the issue of induced seismicity through its current study in consultation with other federal and state agencies.
4. The USGS has the capability and expertise to address monitoring and research associated with induced seismic events. However, the scope of its mission within the seismic hazard assessment program is focused on large-impact, natural earthquakes. Significant new resources would be required if the USGS mission were expanded to include comprehensive monitoring and research on induced seismicity.
GAP
No mechanisms are currently in place for efficient coordination of governmental agency response to seismic events that may have been induced.
PROPOSED ACTIONS
1. Relevant agencies, including EPA, USGS, and land management agencies, and possibly DOE, and state agencies with authority and relevant expertise (e.g., oil and gas commissions, state geological surveys, state environmental agencies) should develop coordination mechanisms to address induced seismic events.
2. Appropriating authorities for agencies with potential responsibility for induced seismicity should consider resource allocations for responding to induced seismic events in the future.


