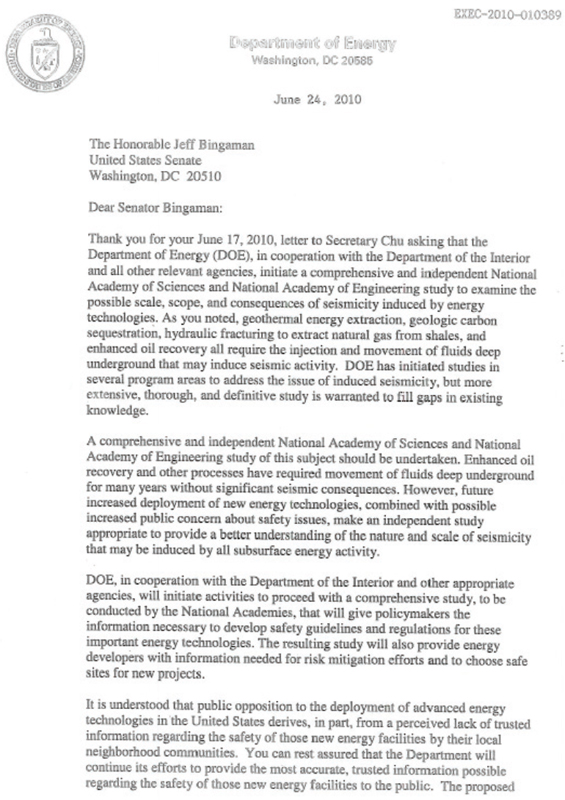
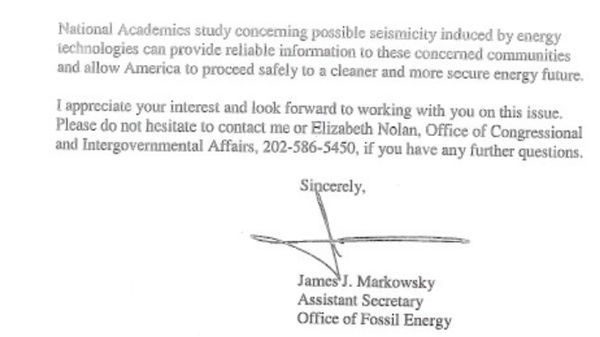
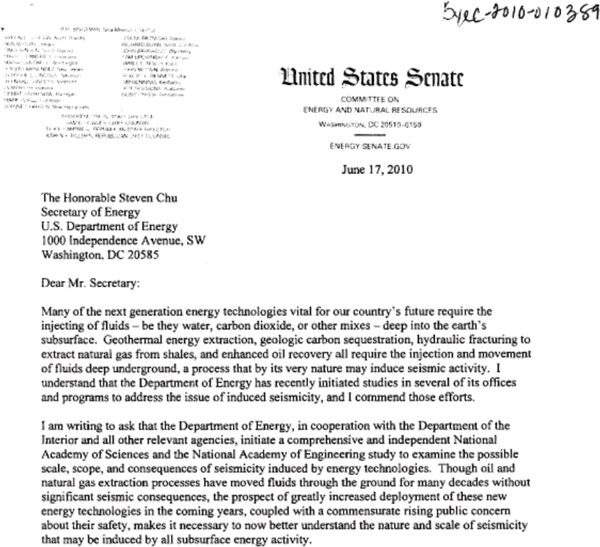
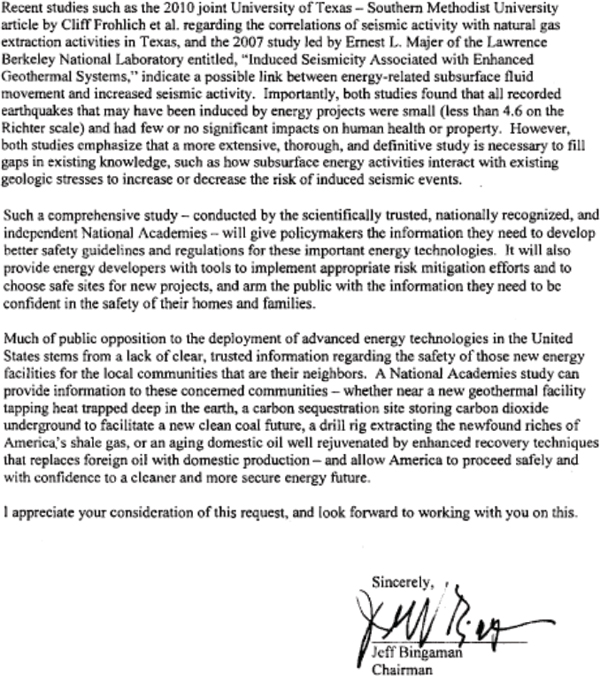
National Academy of Sciences | 150 Year Anniversary

Questions? Call 800-624-6242

| Items in cart [0]

The National Academies Press

PAPERBACK
price:$57.00
add to cart

Rights & Permissions

topleft topright

Induced Seismicity Potential in Energy Technologies (2012)
Board on Earth Sciences and Resources (BESR)

Citation Manager

. "Appendix I Hydraulic Fracture Microseismic Monitoring." Induced Seismicity Potential in Energy Technologies. Washington, DC: The National Academies Press, 2012.

Please select a format:

BibTeX EndNote RefMan


Page
209
bottomleft bottomright
Page
209
Front Matter (R1-R12)
Executive Summary (1-2)
Summary (3-16)
Chapter 1 Induced Seismicity and Energy Technologies (17-30)
Chapter 2 Types and Causes of Induced Seismicity (31-50)
Chapter 3 Energy Technologies: How They Work and Their Induced Seismicity Potential (51-104)
Chapter 4 Governmental Roles and Responsibilities Related to Underground Injection and Induced Seismicity (105-126)
Chapter 5 Paths Forward to Understanding and Managing Induced Seismicity in Energy Technology Development (127-138)
Chapter 6 Steps Toward a "Best Practices" Protocol (139-150)
Chapter 7 Addressing Induced Seismicity: Findings, Conclusions, Research, and Proposed Actions (151-162)
Appendix A Committee and Staff Biographies (163-168)
Appendix B Meeting Agendas (169-176)
Appendix C Observations of Induced Seismicity (177-186)
Appendix D Letters Between Senator Bingaman and Secretary Chu (187-190)
Appendix E Earthquake Size Estimates and Negative Earthquake Magnitudes (191-196)
Appendix F The Failure of the Baldwin Hills Reservoir Dam (197-198)
Appendix G Seismic Event Due to Fluid Injection or Withdrawal (199-204)
Appendix H Pore Pressure Induced by Fluid Injection (205-208)
Appendix I Hydraulic Fracture Microseismic Monitoring (209-212)
Appendix J Hydraulic Fracturing in Eola Field, Garvin County, Oklahoma and Potential Link to Induced Seismicity (213-216)
Appendix K Paradox Valley Unit Salt Water Injection Project (217-220)
Appendix L Estimated Injected Fluid Volumes (221-224)
Appendix M Additional Acknowledgments (225-226)

Below are the first 10 and last 10 pages of uncorrected machine-read text (when available) of this chapter, followed by the top 30 algorithmically extracted key phrases from the chapter as a whole.
Intended to provide our own search engines and external engines with highly rich, chapter-representative searchable text on the opening pages of each chapter. Because it is UNCORRECTED material, please consider the following text as a useful but insufficient proxy for the authoritative book pages.

Do not use for reproduction, copying, pasting, or reading; exclusively for search engines.

OCR for page 209
Appendix I Hydraulic Fracture Microseismic Monitoring During a hydraulic fracture operation, very small earthquakes (M -4 to 0) (microseismic events) are induced from the high pressure injection of fluids into the subsurface. These “microearthquakes” are thought to be caused from the increase in pore pressure leaking off into rock the surrounding the hydraulic fracture. The increased pore pressure causes small natural fractures in the formation to slip, causing microearthquakes. These microearthquakes are thousands of times smaller than a typical earthquake that can be felt by humans. Recording and location analysis of microseismicity requires specialized seismic sensing equipment and processing algorithms. The location and size of the microseismicity is used by oil and gas operators to help determine the geometry of hydraulic fractures in the formation. Microseismic mapping is a very useful tool in planning field wide well development programs, such as horizontal well direction and the spacing between wells, as well as aiding the design of hydraulic fracturing procedures, such as injection rate and fluid volume. Microseismic data is acquired with either an array of seismic instruments (geophones or accelerometers) in one or multiple wellbores, or with a large number (100 to more than 1000) geophones near or on the surface (Figure I.1). Specialized data processing techniques are used to precisely locate the microseismic events in time and space and to compute source parameters such as seismic moment, magnitude and moment tensors, if the data is adequate. Figure I.1 Diagram demonstrating microseismic monitoring of a hydraulic fracture. The hydraulic fracture induces microearthquakes that are recorded with seismometers in a nearby wellbore (left) or a large number of seismometers instruments placed on or near the surface (right). SOURCE: Left, courtesy MEQ Geo Inc.; right, courtesy of MicroSeismic, Inc. 209 Prepublication version – Subject to revision

OCR for page 210
210 APPENDIX I The hydraulic fractures typically propagate parallel to the maximum stress direction in the reservoir. In areas of low stress differences, the hydraulic fracture pattern can be quite complex, as there is no preferential direction for the fracture to grow, in contrast with areas of high stresses, where the hydraulic fracture grows parallel to the maximum stress direction. Figure I.2 shows two examples of microseismic mapping results following hydraulic fracturing procedures in Texas: an example from the Barnett shale gas horizontal well showing a complex fracture geometry (right), and the other from tight gas sands in a vertical well in the Cotton Valley formation, which shows a simple fracture geometry (left). (a) (b) Figure I.2 Examples of microseismic borehole monitoring results following hydraulic fracturing procedure. (a) On the left is a map (top) and cross section (bottom) view in the Barnett Shale after a multi-stage hydraulic fracture treatment in a horizontal well (red line, triangles indicate perforation in wellbore where fluid is injected); the small blue dots show the location of microseismic events mapped from two borehole observation wells shown by red squares; seismic instruments indicated by green circles. (b) On the right is a map (top) and two cross section (bottom) views of two vertical hydraulic fractured wells (white circles) drilled in the tight gas sands of the Cotton Valley Formation. The small gray dots show microseismic locations during a gel-based and water based hydraulic fracturing fluid injection. SOURCE: Left, Warpinski et al. (2005); Right, Maxwell, et al., (2010). Microseismic mapping with borehole or surface sensors can be used to distinguish between re-activated natural faulting and hydraulic fracture events, through b value analysis (see appendix d). Hydraulic fracture wells are often drilled to avoid large natural faults distinguished from 3D surface seismic images, as faults can “steal” fracturing fluid and divert fluids away from the formation targeted for hydraulic fracturing. An example of this issue was discussed by Prepublication version – Subject to revision

OCR for page 211
APPENDIX I 211 Wessels et al. (2011), where a through-going fault was reactivated during hydraulic fracturing (figure C). Figure I.3 Map view of hydraulic fracture microseismic events during a four well stimulation (dark blue lines on the map) in the Barnett Shale. Red events are interpreted to be associated with hydraulic fracturing, blue dots indicate microseismicity associate wth the reactivation of a strike slip fault. See Wessels (2011) for details. Some hydraulic fracture stages were not mapped. SOURCE: Wessels (2011). REFERENCES Maxwell, S.C., J. Rutledge, R. Jones, and M. Fehler. 2010. Petroleum reservoir characterization using downhole microseismic monitoring. Geophysics 75(5): 75A129-75A137. Warpinski, N.R., R.C. Kramm, J.R. Heinze, and C.K. Waltman, 2005. Comparison of Single- and Dual-Array Microseismic Mapping Techniques in the Barnett Shale. Society of Petroleum Engineers Annual Technical Conference and Exhibition, October 9-12, Dallas, Texas. Wessels, S.A., A. De La Pena, M. Kratz, S. Williams-Stroud, and T. Jbeili. 2011. Identifying faults and fractures in unconventional reservoirs through microseismic monitoring. First Break 29(7): 99-104. Prepublication version – Subject to revision

OCR for page 212