
Seismic Event Due to Fluid Injection or Withdrawal
To initiate a seismic event by activation of an existing fault, a critical condition involving the in situ state of stress and the pore pressure needs to be met. As discussed below, this condition stems, at least for the simplest case of slip initiation along a preexisting fault, from a combination of two fundamental concepts: (1) slip is initiated when the shear stress acting on the fault overcomes the frictional resistance and (2) the frictional resistance is given by the product of the friction coefficient times the normal effective stress, defined as the normal stress across the fault reduced by the fluid pressure. This condition of slip initiation, referred to as the Coulomb criterion, can then be translated as a limit condition on the magnitude of the vertical and horizontal stress and of the pore pressure, which depends on the inclination of the fault. The formation of a fault follows similar concepts but accounts for an additional shear resistance due to cohesion; also the actual orientation of the created fault corresponds to the inclination for which the condition of slip is first met.
Although the initial in situ stress state and pore pressure are often close to the limit condition required to cause slip on an existing fault, not all perturbations in the stress and pore pressure associated with fluid injection or extraction eventually trigger a seismic event. First, the perturbation must be destabilizing in its nature; that is, it must bring the system closer to critical conditions, irrespective of the magnitude of the perturbation. Indeed some perturbations are stabilizing, meaning that they move the system farther away from critical conditions. The degree of destabilization can be assessed by a certain parameter m that characterizes the nature of the stress and pore pressure perturbation (Figure G.1). Second, if the perturbation is indeed destabilizing, the magnitude of the perturbation has to be large enough to reach critical conditions. Finally, not all slip events are seismic, although most are, as gouge-filled faults could respond in a ductile stable manner.
It is useful to contrast the case of fluid injection in reservoir rocks, where the fluid flows and is stored in the pore network of the rock, from that in crystalline impermeable rocks, where the injected fluid is essentially transmitted and stored in the fracture network. In the permeable case, the pore pressure increases in the rock induce stress variation in the reservoir and in the surrounding rock. In the impermeable case, the stress induced by injection is negligible (except in situations where the fracture network is very dense), but fluid pressure change can be transmitted over a large distance by fractures that offer little resistance to flow. Although our analysis in this appendix refers to a finite-extent reservoir, solution of the infinite case lies within the finite solution. For the purposes of understanding pore
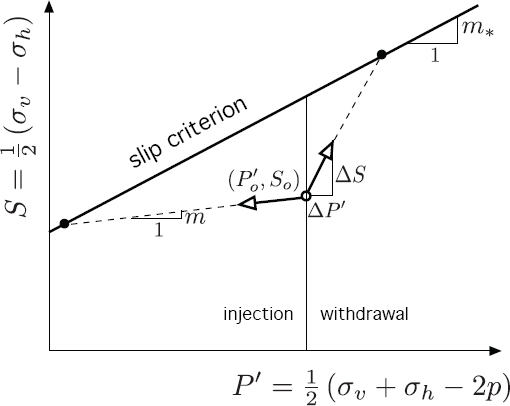
FIGURE G.1 Effective stress change in a reservoir induced by injection or withdrawal of fluid.
pressure perturbation in an infinite reservoir, one simply takes the length of the reservoir to infinity, which causes the reference time scale to go to infinity.
FLUID INJECTION AND EXTRACTION IN A (PERMEABLE) RESERVOIR ROCK
An increase of pore pressure in a permeable rock that is free to deform induces an increase of volume. This physical phenomenon is akin to thermal expansion (i.e., the volume increase experienced by an unconstrained material when subjected to a temperature increase). However, because the deformation of the rock is inhibited by the surrounding material, an increase of pore pressure induces a volume change that is smaller than the unconstrained volume change that would have been for the same pore pressure increase. In addition the compressive stresses in the rock are increased by an amount proportional to the pore pressure increase (see Box 2.3). But for very specific situations, the compressive stress increases in the vertical and in the horizontal directions are unequal, the stress ratio being a function of the shape of the reservoir and the contrast in elastic properties between the reservoir and the surrounding rocks (Rudnicki, 1999, 2002). In particular, the ratio of the induced vertical stress to the induced horizontal stress decreases with the aspect ratio of the reservoir (i.e., the ratio of the reservoir thickness to the lateral extent). For a “thin” reservoir, characterized by a small aspect ratio, the vertical stress change is negligible,
and all the stress increase takes place in the horizontal direction, with increases that range between 40 and 80 percent of the pore pressure increase.
The expansion of the reservoir as a whole also alters the stress state in the surrounding rock, in particular inducing a decrease of the horizontal stress above and below a thin reservoir. These stress variations could in principle also trigger normal faulting in these regions; however, the combination of stress and pore pressure change caused by fluid injection is more likely to trigger seismicity in the reservoir rather than outside. The reverse is true for fluid extraction.
FLUID INJECTION IN A FRACTURED IMPERMEABLE ROCK
Unlike fluid injection in permeable rocks, the injection of fluid in fractured impermeable rock is essentially inducing an increase of fluid pressure in the fractures, with negligible concomitant changes in the stress. It is therefore a worst case compared to the permeable rock case, where the increase of pore pressure is in part offset by an increase of the compressive stress, which is a stabilizing factor. (In other words, factor m introduced in Figure G.1 is about equal to zero.) Because fractures can be very conductive and offer less storage compared to a permeable rock, the pore pressure perturbations can travel on the order of kilometers from the point of injection.
Coulomb Criterion and Effective Stress
For slip to take place on a fault, a critical condition involving the normal stress σ (the force per unit area normal to the fault), the shear stress τ (the force per unit area parallel to the fault), and the pressure ρ of the fluid on the fault plane, must be met (see Figure G.2 for a representation of σ and τ). This condition is embodied in the Coulomb criterion, |τ| = μ(σ – ρ) + c, which depends on two parameters: the coefficient of friction μ, with values typically in the narrow range from 0.6 to 0.8, and the cohesion c, equal to zero, however, for a frictional fault.
The Coulomb criterion simply expresses that the condition for slip on the fault is met when the magnitude of the “driving” shear stress, |τ|, is equal to the shear resistance μ(σ – ρ) + c. The quantity (σ – ρ) is known as the effective stress, a concept initially introduced by Terzaghi (1940) in the context of soil failure. It captures the counteracting influence of the fluid pressure ρ on the fault to the stabilizing effect of the compressive stress σ acting across the fault.
As long as the shear resistance is larger than the shear stress magnitude, the fault is stable. However, an increase of the shear stress magnitude or a decrease of the shear strength would cause the fault to slip if the two quantities become equal. For example, an increase of the fluid pressure induced by injection could be responsible for a drop of shear strength large enough to reach the critical conditions.
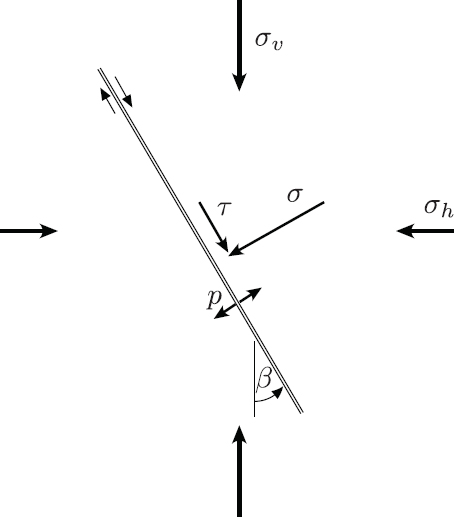
FIGURE G.2 The normal and shear stress, σ and τ, acting across the fault depends on the vertical and horizontal stresses, σv and σh, and the fault inclination β. The fault is infiltrated by fluid at pressure ρ.
The normal and shear stress on the fault can actually be expressed in terms of the in situ vertical and horizontal stresses, σv and σh, through a relation that depends on the fault inclination β (Figure G.2). The above Coulomb criterion can then be expressed as a limiting condition in terms of the effective vertical and horizontal stresses σ′v = σv – ρ and σ′h = σh – ρ or equivalently in terms of their half-sum and half-difference, P′ and S. Figure G.3 provides a graphical representation of the Coulomb criterion in terms of these two quantities.
The fault is stable if the point representative of the (effective) in situ stress state is below the slip criterion. A perturbation (ΔP′, ΔS), induced by fluid injection or withdrawal, to an existing state (P′o, So) that moves the point (P′o+ ΔP′, So+ ΔS) to be on the Coulomb line will cause slip and trigger a seismic event. However, only some perturbations are destabilizing in nature (i.e., they move the representative stress point [P′, S] closer to the critical conditions). For example, the destabilizing perturbation shown in Figure G.3 is characterized by a slope m = ΔS/ΔP′ smaller than mo and a “direction” corresponding to both ΔP′ and ΔS being negative. A perturbation characterized by the same slope m, but positive variations ΔP′ and ΔS, would be stabilizing.
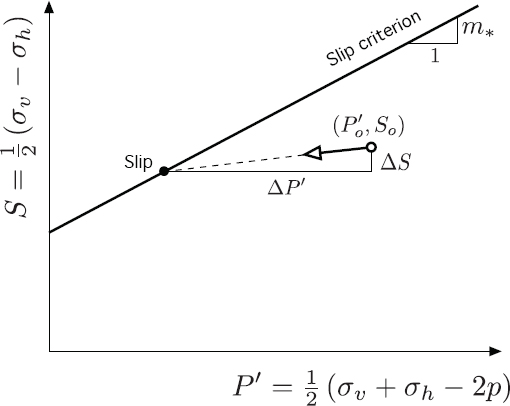
FIGURE G.3 Stress and pore pressure perturbations from an initial stable state leading to critical conditions. The vertical intercept represents the rock cohesive strength and is zero for a preexisting frictional fault. The slope mo of the slip criterion depends on the friction coefficient μ and on the fault inclination β. The sketch corresponds to the normal conditions when σ′v > σ′h.
The existence of a perturbation ΔS reflects the fact that injection or extraction of fluid in deep layers has consequences beyond simply increasing or decreasing the pore fluid pressure. As explained in Chapter 2, the propensity of permeable rocks to expand (contract) as a response to increase (decrease) of pore pressure induces stress change not only in the reservoir but also in the surrounding rocks. Only in the particular case of impermeable rocks, where flow of fluids only takes place in a fracture network, are the perturbations essentially only of a hydraulic nature. For example, injection of fluid in fractured impermeable rock causes mainly an increase of pore pressure Δρ leading to ΔP′ < 0 and ΔS = 0, which would cause the stress point in Figure G.3 to move horizontally (m = 0) to the left.
So far the discussion has been focused on slip on a preexisting fault of known inclination β. The formation of a fault associated with the large-scale shear failure of the rock can be treated within the same framework, with the critical difference that the inclination of the created fault depends only on the friction coefficient μ. It also follows that in the representation of Figure G.3, the slope mo of the slip criterion (now usually referred to as the Mohr-Coulomb criterion) is exclusively a function of μ. The vertical intercept of the Mohr-Coulomb criterion with the S axis then embodies the cohesive shear strength of the rock.
REFERENCES
Rudnicki, J.W. 1999. Alteration of regional stress by reservoirs and other inhomogeneities: Stabilizing or destabilizing? Pp. 1629-1637 in Proceedings of the Ninth International Congress on Rock Mechanics, edited by G. Vouille and P. Berest. London: Taylor & Francis.
Rudnicki, J.W. 2002. Eshelby transformations, pore pressure and fluid mass changes, and subsidence. Pp. 307-312 in Poromechanics II, Proceedings of the Second Biot Conference on Poromechanics, edited by J.-L. Auriault et al. Leiden: A.A. Balkema.
Terzaghi, K. 1940. Theoretical Soil Mechanics. New York: Wiley.


