
Types and Causes of Induced Seismicity
Energy technology activities known to have produced induced seismicity, whether significant enough to be felt by humans or so small as to be detected only with sensitive monitoring equipment, are fluid injection and withdrawal as well as purposeful fracturing of rocks. For each of these activities the critical components required to produce induced seismicity are the presence and orientation of existing faults, the state of stress of the Earth’s crust, the rates and volumes of fluid injection or withdrawal, and time. Understanding these components gives some confidence in being able to draw conclusions about what seismicity might be induced in the future, and under what conditions. The physical mechanisms1 responsible for inducing seismic events are discussed here with reference to specific energy technologies; detailed explanations of these technologies and their relationship to induced seismic events are presented in Chapter 3.
FACTORS AFFECTING INITIATION AND MAGNITUDE OF A SEISMIC EVENT
Shallow earthquakes result from slip (movement) along a preexisting fault. Two critical questions concerning such earthquakes are (1) which factors are responsible for the initiation of a seismic event and (2) which factors control the magnitude of the event.
Initiation of a Seismic Event
The Earth’s crust is crossed by a network of preexisting fractures and faults of various sizes. Any of these faults could, in principle, be activated if the shear stress (τ) acting on the fault overcomes its resistance to slip or movement of the adjacent rock blocks (called “shear resistance”). In most cases, the shear resistance (or shear strength) is due to friction. In other words, the shear strength is proportional to the difference between the normal stress (σ) acting on the fault and the pressure (ρ) of the fluid permeating the fault and the surrounding rock. The fault remains stable (does not slip) as long as the magnitude of
_____________________
1 Although hydromechanical coupling is the dominant mechanism responsible for inducing seismic events, other coupling mechanisms (e.g., thermomechanical and chemomechanical) could also play a role.
the shear stress (τ) is smaller than the frictional strength, which can be represented by this expression: μ(σ – ρ). The term (σ – ρ) is called the effective stress. The symbol μ represents the friction coefficient, a parameter that varies only in a narrow range, typically between 0.6 and 0.8 for most rock types. This condition for triggering slip, known as the Coulomb criterion, is discussed in more detail in Box 2.1 and Appendix G (see also Jaeger et al., 2007; Scholz, 2002).
The key parameters controlling the initiation of slip are therefore the normal and shear stresses acting on the fault as well as the pore fluid pressure (hereafter simply referred to as “pore pressure”). The normal and shear stresses on the fault depend on the orientation of the fault and on the state of stress in the rock. Due to the weight of the overlying rock and other processes in the Earth’s crust, rocks are usually under compression. The compressive normal stress acting on a rock at depth varies with direction; this variation of the normal stress with direction is linked to the shear stresses that are responsible for slip along a fault if the frictional resistance of the fault is overcome. In contrast, for a fluid at rest, the state of stress is hydrostatic: the normal stress is the same in all directions, and it cannot transmit any shear stresses.
The state of effective stress at a point in the Earth involves both the stress tensor and the pore pressure. The stress tensor is described by the vertical stress (σv) and the minimum and maximum horizontal stresses (σh and σH) that act in two orthogonal directions. The direction of σH, as well as the relative values of σv, σh, and σH, control the orientation of the fault most likely to slip; three different fault regimes are defined depending on the relative magnitude of σv, σh, and σH (Box 2.2). Once the most critical fault orientation has been identified, the normal and shear stresses acting on the fault can in principle be computed from the state of effective stress.
Determination of the in situ state of stresses in the subsurface is complex and often expensive. Consequently, the information on the in situ stress in the Earth is usually too fragmentary to allow confident estimates of the actual stresses acting on a fault. In most cases the only reliable information available is the magnitude of the vertical stress, as it can simply be estimated from the average density of the overlying rock and the depth. Estimating the general fault types and configurations as well as the broad orientation of the maximum and minimum horizontal stresses at a scale of tens or hundreds of kilometers is also sometimes possible, based on a variety of stress indicators (see also Figure 4 in Box 2.2).
In contrast to the difficulty of determining the maximum and minimum horizontal stresses and their orientations, the undisturbed initial pressure of the fluid permeating the rock and the fractures or faults can usually be reliably estimated from the depth of the rocks, under normally pressurized conditions. Techniques also exist for direct measurement of the pore pressure from a well.
Although the conditions for initiating slip on a preexisting fault are well understood, the difficulty remains to make reliable estimates of the various quantities in the Coulomb
criterion. Lacking these estimates, predicting how close or how far the fault system is from instability remains difficult, even if the orientation of the fault is known. This implies that the magnitude of the increase in pore pressure that will cause a known fault to slip cannot generally be calculated. Nonetheless, understanding how different factors contribute to slip initiation is valuable because it provides insight about whether fluid injection or withdrawal may be a stabilizing or a destabilizing factor for a fault (in other words, whether fluid injection or withdrawal causes the difference between the driving shear stress and the shear strength to increase or decrease). Any perturbation in the stress or pore pressure that is associated with an increase of the shear stress magnitude and/or a decrease of the normal stress and/or an increase of the pore pressure could be destabilizing; such a perturbation brings the system closer to critical conditions for failure. A large body of evidence suggests that the state of stress and pore pressure are often not far from the critical conditions where a small destabilizing perturbation of the stress and/or of the pore pressure could cause a critically oriented fault to slip (Zoback and Zoback, 1980, 1989).
Magnitude of a Seismic Event
The moment magnitude scale, designated M, is directly related to the amount of crustal energy released during a seismic event (Hanks and Kanamori, 1979). This energy can be thought of as the total force released during the earthquake times the average fault displacement over the fault rupture area (see also the section Earthquakes and Their Measurement in Chapter 1).
Earthquake magnitude is correlated to the area of the rupture surface. Earthquakes with large magnitudes always involve large parts of the Earth’s crust, because the large energies being released can only be stored in large volumes of rock, and large rupture areas are necessary to produce large fault displacements. Correlations between M and rupture area from observations of historical earthquakes indicate that an increase of 1 magnitude unit implies, on average, an increase by a factor of about 8 in fault rupture area, and a concurrent increase by a factor of about 4½ in rupture displacement (Wells and Coppersmith, 1994). The following examples are typical fault rupture areas and rupture displacements associated with earthquakes of M 4 and M 5:
|
|
M 4 |
M 5 |
|
Fault rupture area: |
1.4 km2 (~0.5 mi2) |
11 km2 (~4.2 mi2) |
|
Fault displacement: |
1 cm (~0.4 in) |
4.5 cm (~1.8 in) |
A larger-magnitude earthquake implies both a larger area over which crustal stress is released and a larger displacement on the fault. From the definition of M, we can expect that a 1-unit increase in magnitude will be associated with a factor of about 32 larger release
BOX 2.1
Conditions Leading to Seismic Slip on a Fault
Shallow earthquakes result from slip along a preexisting fault. The slip is triggered when the stress acting along the fault exceeds the frictional resistance to sliding. The critical conditions are quantified by the Coulomb criterion, which embodies two fundamental concepts, friction and effective stress. These two concepts can be illustrated by considering the shearing of a split block (Figure 1). The block is subjected to a normal force Fn and a shear force Fs, which can be translated into a normal stress σ = Fn/A and the shear stress τ = Fs/A acting across the joint, with A designating the interface area of the joint. The joint (and possibly also the block if it is porous) is infiltrated by fluid at pressure ρ.
According to the Coulomb criterion, there is no relative movement across the joint, as long as the shear stress (τ) is less than the frictional strength μ(σ – ρ), where μ is the coefficient of friction. The conditions for slip are thus met when τ = μ(σ – ρ). The term (σ – ρ) is called the effective stress; the presence of effective stress in the Coulomb criterion shows that the fluid pressure (ρ) counterbalances the stabilizing effect of the normal stress (σ). The Coulomb criterion indicates that slip can be triggered by a decrease of the normal stress, an increase of the pore pressure, and/or an increase of the shear stress (Figure 1b).
Note that the common concept that “injected fluids cause earthquakes by lubricating underground faults” is not accurate because fluids do not decrease the coefficient of friction, μ. Rather, injected fluids (or extracted fluids) cause earthquakes by changing the stress conditions around faults, bringing these stresses into a condition where driving stresses equal or exceed resistive stresses, thereby promoting slip on the fault.
Within the context of slip on a fault, the normal and shear stresses acting across the fault, σ and τ, can be directly expressed in terms of the vertical stress (σv), the horizontal stress (σh), and the fault inclination (β) (Figure 2). Prior to injection or extraction of fluid, the initial state is stable because the shear stress (τo) is less than the frictional strength μ(σo – ρo), although the condition could be close to critical. Injection or extraction of fluid could cause changes in the stress and pore pressure such that the critical condition expressed as τ = μ(σ – ρ) is met (Figure 2b is a graphical representation).
This box describes the simple case of a frictional fault. The more general case of a fault with cohesive-frictional strength is treated in Appendix H.
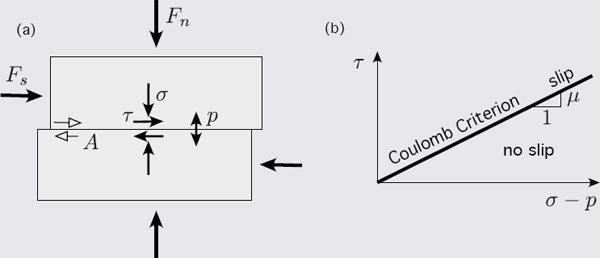
Figure 1 (a) Shearing of a jointed block subjected to normal force Fn and shear force Fs, with fluid inside the joint at pressure ρ. Slip along the joint is triggered when the shear stress τ is equal to the frictional strength μ(σ – ρ), where (σ – ρ) is the effective stress and μ is the coefficient of friction. (b) Graphical representation of the Coulomb criterion: there is no slip if the “point” (σ – ρ, τ) is below the critical line defined by slope μ.
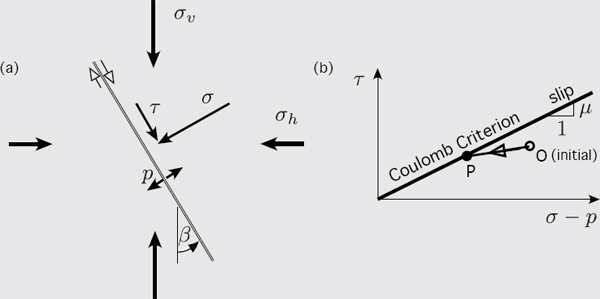
Figure 2 (a) The normal and shear stresses (σ and τ) acting across the fault depend on the vertical and horizontal stress (σv and σh) and the fault inclination (β). (b) Fluid injection or extraction could induce changes in the stress and the pore pressure; for example, fluid injection could move the initially stable “point” “O” in Figure 2b to a new position “P” that is on the critical Coulomb line, thus triggering slip on the fault. The inclination of the segment OP is a function of the poroelastic coupling described in Box 2.3.
BOX 2.2
In Situ Stress State
The full characterization of the state of stress at a point of the subsurface requires in principle six independent quantities, illustrated through the following example.
Imagine that a small cube of rock centered on the point of interest is cut from its surrounding. To leave the material inside the cube undisturbed by the cutting, forces have to be applied on each face of the cube to mimic the action of the surrounding medium onto the cut material, noting also that forces acting on opposed faces are equal and opposite in direction. However, in considering in situ stress state, using the term “stress,” which is equivalent to the force exerted over a defined area, is more appropriate than discussing “force” alone; in this way, stress is not dependent on the size of the cube.
If the cube is rotated in space, the stresses acting on its faces change in magnitude and direction. However, a certain orientation of the cube exists for which each face is only loaded by a stress normal to the face (Figure 1). The three independent normal stresses are referred to as principal stresses, and their corresponding orientations in space as principal directions. On two faces of the cube oriented according to the principal directions, the normal stress is maximum and minimum and for any other orientation of the cube, the normal stress on any face is in between these two limiting values. The principal stress acting on the face parallel to the minimum and maximum principal stresses is called intermediate.
A set of six quantities, the three principal stresses and their directions, thus represents the state of stress. Fortunately, vertical can often be considered as one of the principal directions, with the consequence that the vertical stress σv at depth h is then simply given by the weight of the overlying rock (i.e., σv =pgh, where p is the average density of the overlying rock and g is gravity). Determination of the state of stress is then reduced to identifying three quantities, the minimum and maximum horizontal stresses, respectively σh and σH, and the azimuth of σH (or equivalently of σh).
Stress data compiled by Brown and Hoek (1978) confirm that, despite some scattering, the vertical stress is proportional to depth in a manner consistent with an average rock density p = 2,700 kg/m3 (~170 lb/ft3) (Figure 2a).
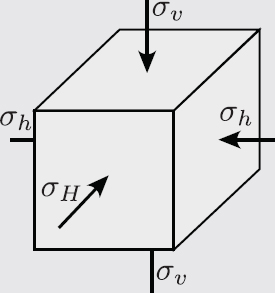
Figure 1 State of stress in the subsurface, with one of the principal stress directions being vertical. By convention, σH > σh.
The ratio of the mean horizontal stress to the vertical stress (Figure 2b) appears to vary over a narrower range with increasing depth, the ratio being generally less than 1 at depths larger than 2 km (~1.2 miles).
The relative magnitude of the three principal stresses, σh, σH, and σv, establishes the conditions for the orientation of the faults. Three regimes of stress, each associated with different fault orientations, are commonly defined (Figure 3): (a) thrust fault regime
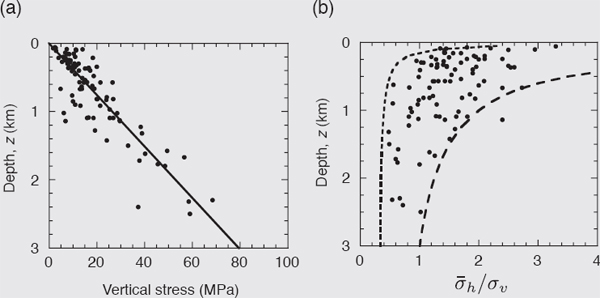
Figure 2 (a) Vertical stress variation with depth; the linear trend corresponds to a mean density of 2,700 kg/m3. (b) Variation of the ratio of the mean horizontal stress (σH + σh)/2 over the vertical stress σv with depth. SOURCES: Figure modified from Jaeger et al. (2007), which was itself redrawn from the original figure of Brown and Hoek (1978).
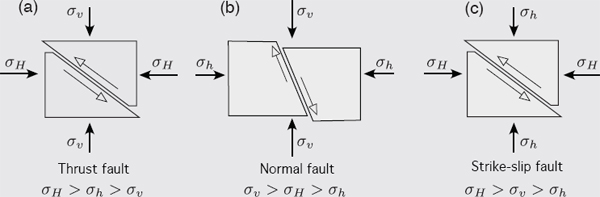
Figure 3 (a) Thrust fault, (b) normal fault, and (c) strike-slip fault. (Cross sections shown are in vertical plane for (a) and (b) and horizontal plane for (c).)
with σv equal to the minimum principal stress, (b) normal fault regime with σv equal to the maximum stress, and (c) strike-slip fault regime corresponding to the vertical stress being equal to the intermediate principal stress.
Determination of three unknown quantities (σh, σH, and their orientation) remains a formidable problem. Most of the time, the only information available is the stress regime and the broad orientation of σH, which can be inferred using a variety of stress indicators such as earthquake focal mechanisms, wellbore breakouts, drilling-induced fractures, and other data (Zoback and Zoback, 1980, 1989).
Furthermore, the stress varies from point to point within the Earth, subject to the constraint of having to satisfy the equilibrium equations, a consequence of Newton’s second law. Spatial variation of the state of stress exists at various scales, as the stress is affected by the structure of the subsurface, the geometry and mechanical properties of different lithologies, preexisting faults and other discontinuities in the crust, and other characteristics. Yet, when viewed at the scale of hundreds of kilometers, patterns emerge that can be seen on the stress map for North America (Figure 4). This stress map, a compilation of all available stress information, shows the orientation of σH and the stress regime superimposed on a topographical map of North America (Heidbach et al., 2008).
The example above refers to the initial state of stress (i.e., to the stress prior to injection or extraction of fluid). Large variation of the pore pressure and/or temperature could also induce significant stress changes that have to be accounted for when assessing the potential for induced seismicity.
in crustal energy (a factor often cited in news reports following large earthquakes), and the estimates cited in the examples from empirical observations are in general agreement with that definition.
Most existing fractures in the Earth’s crust are small and capable of generating only
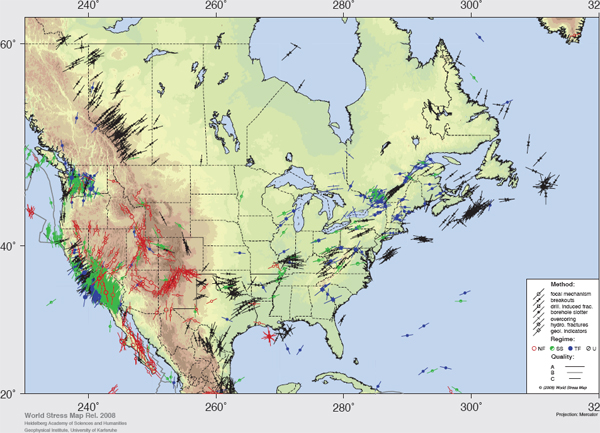
Figure 4 North America stress map. The stress map displays the orientations of the maximum horizontal compressive stress (σH). The length of the stress symbols represents the data quality, with A being the best quality. Quality A data are assumed to record the orientation of σH to within 10°-15°, quality B data to within 15°-20°, and quality C data to within 25°. As can be seen from this global dataset, stress measurements are absent in many parts of North America and the offshore regions. Because stress measurements are important in the consideration of induced seismicity, their measurement, particularly in areas where data are sparse, could usefully contribute to understanding the potential for induced seismicity related to energy development. The tectonic regimes are NF for normal faulting, SS for strike-slip faulting, TF for thrust faulting, and U for an unknown regime. Topographic relief is indicated by green (lower elevations) to brown (higher elevations) shading. SOURCE: Data used to plot this map were accessed from www.world-stress-map.org/ (see Heidbach et al., 2008).
small earthquakes. Thus, for fluid injection to trigger a significant earthquake, a fault or faults of substantial size must be present that are properly oriented relative to the existing state of crustal stress, and these faults must be sufficiently close to points of fluid injection to have the rocks surrounding them experience a net pore pressure increase.
SEISMICITY INDUCED BY FLUID INJECTION
Injection of fluid in rocks causes an increase of the pore pressure and also modifies the state of the stress (Hsieh, 1996; NRC, 1990). The stress change is associated with a volume expansion of the rock due to the increase of the pore pressure, similar to the familiar thermal expansion experienced by materials (Box 2.3). However, the pore pressure perturbation
BOX 2.3
Stress Induced by Fluid Injection or Withdrawal
Injection or extraction of fluid into or from a permeable rock induces not only a pore pressure change in the reservoir but also a perturbation in the stress field in the reservoir and in the surrounding rock. The physical mechanism responsible for this hydraulically induced stress perturbation can be illustrated by considering the injection of a finite volume of fluid inside a porous elastic sphere surrounded by a large impermeable elastic body (see Figure). The magnitude of the induced pore pressure (Δρ), once equilibrated, is proportional to the volume of fluid injected.
Assuming that the sphere is removed from the surrounding body, the pore pressure increase (Δρ) induces a free expansion of the sphere (ΔV*), similar in principle to the familiar thermal expansion experienced by a solid subject in response to a temperature increase. To force the expanded sphere back to its earlier size requires the application of an external confining stress (Δσ*), which is then relaxed. The final state corresponds to a constrained expansion of the sphere (ΔV), which is less than the free expansion; this state can be associated with a stress perturbation (Δσ) that is isotropic and uniform inside the sphere, but nonisotropic and nonuniform outside the sphere. The magnitude of the stress perturbation decays away from the sphere, becoming negligible at a distance about twice the sphere radius. The stress induced inside the sphere is compressive when the pore pressure increases (fluid injection) but tensile if the pore pressure decreases from its ambient value (fluid withdrawal).
This example illustrates the fundamental mechanism by which the stress field in the rock is modified by injection or withdrawal of fluid. The complexities associated with geological settings—in particular, the actual shape of the reservoir, its size, as well as the nonuniformity of the pore pressure field—affect the nature of the stress perturbation. The horizontal and vertical stress variations within most geological reservoirs are rarely identical; inside a tabular reservoir of large lateral extent compared to its thickness, only the horizontal stress is affected by the pore pressure change.
In the case of fluid injection in a fractured impermeable basement rock, such as that which may be a target for development of enhanced geothermal systems (EGS; see also Chapter 3), the perturbation is only of a hydraulic nature and the stress change can generally be ignored.
An analysis of the pore pressure and stress perturbation indicates that, in general, fluid injection increases the risk of slip along a fault located in the region where the pore pressure has increased. In the case of fluid withdrawal, the region at risk is generally outside the reservoir (see also Nicholson and Wesson, 1990).
dominates over the stress variation and, when the consequence of fluid injection with regard to the induced seismicity is considered, the stress perturbations can often be ignored. Disregarding the stress change in the rock caused by injection is a conservative approach because these kinds of perturbations are usually of a stabilizing nature (see Appendix G for a detailed explanation).
Pore pressure increases in the joints and faults are potentially destabilizing, since they
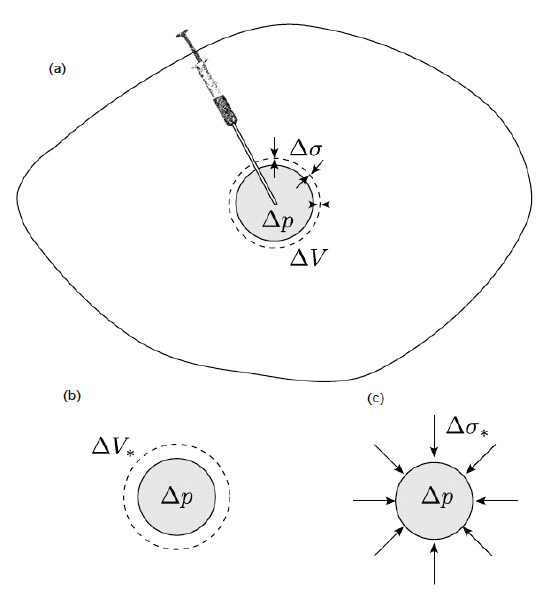
Figure (a) Injection of a finite volume of fluid inside the porous elastic sphere embedded in a large impermeable elastic body induces a pore pressure increase Δρ inside the sphere as well as a stress perturbation Δσ inside and outside the sphere, caused by the expansion ΔV of the sphere. (b) If the sphere is freed from its elastic surrounding, it will expand by the amount ΔV* due to the pore pressure increase Δρ. (c) A confining stress Δσ* needs to be applied on the free sphere to prevent the expansion ΔV* caused by Δρ. If the material in the surrounding medium is much softer than the material in the sphere, then ΔV ![]() ΔV* and Δσ
ΔV* and Δσ ![]() 0; if the medium is much stiffer, then ΔV
0; if the medium is much stiffer, then ΔV ![]() 0 and Δσ
0 and Δσ ![]() Δσ*. Δσ refers only to the radial stress in the exterior region. Note: Syringe based on a concept from H.F. Wang (Wang, 2000).
Δσ*. Δσ refers only to the radial stress in the exterior region. Note: Syringe based on a concept from H.F. Wang (Wang, 2000).
cause a reduction of the slip resistance of a fault located in the region of pore pressure increase. In assessing the potential for induced seismicity, two basic questions arise: (1) What is the magnitude of the pore pressure change? and (2) What is the extent of the volume of rock where the pore pressure is modified in any significant manner? The magnitude of the induced pore pressure increase and the extent of the region of pore pressure change depend on the rate of fluid injection and total volume injected, as well as on two hydraulic properties of the rock, its intrinsic permeability (k) and its storage coefficient (S), and on the fluid viscosity (μ).
The permeability (k) is a quantitative measure of the ease of fluid flow through a rock; it depends strongly on the porosity of the rock (the volume percentage of voids in the rock volume) but also on the connectivity between pores. The storage coefficient (S) is a measure of the relative volume of fluid that needs to be injected in a porous rock in order to increase the pore pressure by a certain amount; the storage coefficient depends on the rock porosity in addition to the fluid and rock compressibility. The permeability (k) can vary by many orders of magnitude among rocks; for example, the permeability of a basement rock such as granite could be up to a billion times smaller than the permeability of oil reservoir sandstone (Figure 2.1).
However, the storage coefficient increases only by about one order of magnitude between a tight basement rock and high-porosity sandstone. The ratio k:μS is the hydraulic diffusivity coefficient (c), which provides a measure of how fast a perturbation in the pore
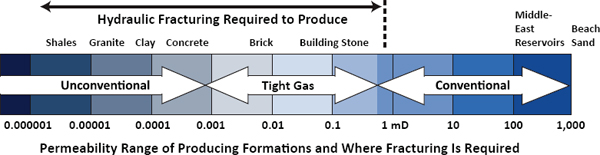
FIGURE 2.1 Comparison of permeability in oil and gas reservoirs utilizing permeability values for typical rock types and common building materials. The higher the connectivity between the pore spaces, the higher the permeability; for oil and gas reservoirs, higher permeability generally indicates greater ease with which the hydrocarbons will flow out of the reservoir and into a production well. Permeability is most commonly measured using a unit called a millidarcy (mD), and permeabilities can range between 1,000 mD (high permeability, comparable to beach sand) to very low permeability (0.000001 mD, which would describe the least permeable rocks such as shales). Other common materials (such as granite or brick) are noted on the upper part of the scale in this figure to give a sense of the range of permeabilities on the millidarcy scale. Although hydraulic fracturing has been used for decades to stimulate some conventional reservoirs, hydraulic fracturing is required to produce from low-permeability reservoirs such as tight sands and shales (left-hand side of the diagram). SOURCE: Adapted from King (2012).
pressure propagates in a saturated rock; like the permeability (k), the diffusivity (c) can vary over many orders of magnitude for different rocks. These parameters can be determined either from laboratory tests on drill core samples from wells or from pumping or injection tests, which have the advantage of providing estimates that are averaged over a scale relevant for reservoir calculations.
The intrinsic permeability of basement rocks is so low that the transport of fluid in these rocks can be thought of as taking place almost exclusively in the network of fractures that is pervading the crust. In other words, the rock itself can be viewed as being impermeable. Concepts of permeability and storage coefficient can be extended to fractures, where they transform into a transmissivity and storativity, with their ratio also having the meaning of diffusivity (see, e.g., Nicholson and Wesson, 1990; NRC, 1996).
The important point is that faults and fractures in basement rocks offer relatively little resistance to flow, and thus the equivalent permeability and diffusivity of these fractured rocks (with fractures and rocks viewed as a whole) can be very high. For example, the hydraulic diffusivity deduced from the time evolution of spatial spread of microseismic events measured during injection of water into a crystalline rock at Fenton Hill, an EGS site (Fehler et al., 1998), is about 0.17 m2/s (Shapiro et al., 2003), a value in the range of those for very permeable sandstones. The combination of high transmissivity, small storativity, and the planar nature of fractures implies that significant pore pressure changes can be transmitted over considerable distances (several kilometers [miles]) through a fracture network from an injection well.
In permeable rocks, where the fluid is dominantly transported by a connected network of pores, the injection of fluid from a well can be viewed as giving rise to an expanding “bulb,” centered on the well, which represents the region where the pore pressure has increased. The increase in pore pressure decreases with distance from the well until it becomes about equal to the initial pore pressure, prior to injection, at the edge of this expanding region. Once the size of this bulb becomes larger than the thickness of the permeable layer, the shape of this region becomes approximately cylindrical over the height of the layer. The region of perturbed pore pressure continues to grow radially until it meets bulbs growing from other injection wells or until it reaches the lateral boundaries of the reservoir (see also Nicholson and Wesson, 1990).
The dependence of the magnitude of induced pore pressure and of the size of the perturbed pore pressure region on the injection rate, the volume of fluid injected, and the rock hydraulic properties (permeability and storage coefficient) is complex. Numerical simulations are generally needed to establish these relationships, which depend on the geometry of the permeable rock. However, some general rules apply either at the early stage of injection when the bulb of increased pore pressure grows unimpeded by the interaction with the lateral boundaries of the reservoir or with other bulbs, or at a late stage of injection when the increase of the pore pressure is nearly uniform in the reservoir, which is here assumed
to be of finite extent (see Appendix H for the calculation of the pore pressure induced by injection into a disc-shaped reservoir).
At the early stage of injection, the size of the bulb will essentially depend on the diffusivity of the rock and on the duration of injection (equal to the ratio of injected volume over the injection rate). The maximum induced pore pressure is equal to the ratio of the injection rate over the permeability times a function of the duration of injection. This means that the bulb size increases but the maximum pore pressure decreases with increasing rock permeability, everything else being equal. In other words, the induced pore pressure dissipates faster with increasing permeability. At the late stage of injection, the induced pore pressure does not depend on the injection rate and on the permeability, because it becomes proportional to the ratio of the volume of fluid injected over the storage coefficient.
The extent of the induced pore pressure field and the magnitude of the induced pressure are both relevant when assessing the risk of induced seismicity. A larger pore pressure increase brings the system closer to the conditions for initiating slip on a suitably oriented fault, if such a fault exists; a larger region of disturbed pore pressure will increase the risk of intersecting and activating a fault.
Inducing a significant seismic event requires an increase of the pore pressure above levels that have existed prior to fluid injection and over a region large enough to encompass a fault area consistent with the magnitude of the earthquake. For example, an earthquake of magnitude M 3 results from a rupture area of about 0.060 km2 (corresponding to 15 acres). Such a situation was encountered at the Rangely, Colorado, oilfield starting in 1957, when sustained waterflooding operations (secondary recovery to improve petroleum production) over a period of several years caused the pore pressure to increase (Box 2.4). Eventually, pore pressure reached a level about 17 MPa (170 bars)2 above the preproduction pore pressure, a threshold at which a series of seismic events began to occur; the largest of these events was M 3.4. However, waterflooding would not be expected to cause any significant seismic activity if the pore pressure did not exceed the initial pore pressure in a reservoir. Operators generally do not exceed preproduction pore pressure during waterflooding projects because they tend to maintain relative balance between the volumes of fluid injected and extracted. Exceptions to this generally balanced condition for waterflooding and resulting induced seismicity are cited in Appendix C.
Observations and monitoring of hydraulic fracturing treatments indicate that generally only microseismic events (microseisms, M < 2.0; see Chapter 1) are produced because the volume of fluid injected is relatively small (see also Chapter 3 for further details). Despite the fact that hydraulic fracturing does increase pore pressure above the minimum in situ stress (typically σh), the area affected by the increase in pore pressure is generally small, remaining in the near vicinity of the created fracture.
_____________________
2 MPa = megapascal; 1 MPa is equivalent to 10 bars or about 10 atmospheres of pressure.
SEISMICITY INDUCED BY FLUID WITHDRAWAL
Fluid extraction from a reservoir can cause declines in the pore pressure that can reach hundreds of bars. The declining pore pressure causes large contraction of the reservoir, which itself induces stress changes in the surrounding rock (Segall, 1989), in particular increasing horizontal stresses above and below the reservoir that could lead to reverse faulting (Figure 2.2). Grasso (1992) estimates that volume contraction of reservoirs from fluid withdrawal can cause earthquakes up to M 5.0.
Several examples of induced seismicity associated with fluid withdrawal and associated pore pressure decrease have been reported, notably at the Lacq gas field in France (Box 2.5). A study of induced seismicity associated with natural gas extraction in the Netherlands (Van Eijs et al., 2006) indicates that the three most important factors in producing seismicity are the pore pressure drop from pumping, the density of existing faults overlying the gas field, and the contrast in crustal stiffness between the reservoir rock and the surrounding rock.
Another proposed mechanism for initiating slip on preexisting faults is linked to the reduction of the vertical stress on the layers underlying the reservoir from which a large mass of hydrocarbons has been extracted (McGarr, 1991). In this mechanism, the buoyancy force of the Earth’s lithosphere will cause an upward movement in the part of the crust that has been unloaded, thereby inducing slip on preexisting faults at depth.
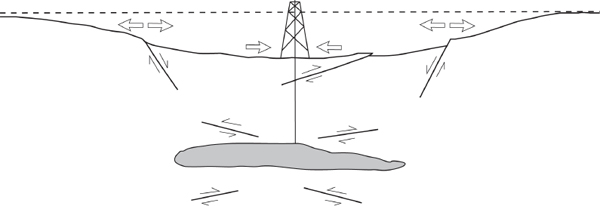
FIGURE 2.2 Observed faulting suggested to be associated with fluid withdrawal. Open arrows denote horizontal strain. In this interpretation, normal faults develop on the flanks of a field when the oil reservoir is located in a region of crustal extension. Reverse faults may develop above and below the reservoir if the reservoir is located in a region undergoing compression. Adapted after Segall (1989).
BOX 2.4
Induced Seismicity at the Rangely, Colorado, Oilfield
The Rangely, Colorado, induced seismicity experiment is an important milestone in the study of induced seismicity that firmly established the effective stress mechanism for induced seismicity. Water injection at the Rangely oilfield began in 1957 in response to declining petroleum production and decreased reservoir pressures. As a result of the waterflooding (secondary recovery) operations, reservoir pore pressures increased throughout the field, and by 1962 pore pressure in parts of the field substantially exceeded the original preproduction pressure of about 170 bars (17 MPa). In the same year the Uinta Basin Seismological Observatory, located about 65 km (~39 miles) from Rangely, began operation and detected numerous small seismic events M ≥ 0.5 in the vicinity of Rangely. With sustained fluid injection and elevated pore pressures the seismic events continued and the largest, M 3.4, occurred on August 5, 1964. Detailed monitoring with a local U.S. Geological Survey (USGS) seismic network installed in 1969 showed that the seismic events were occurring along a subsurface fault within the oilfield (Figure 1).
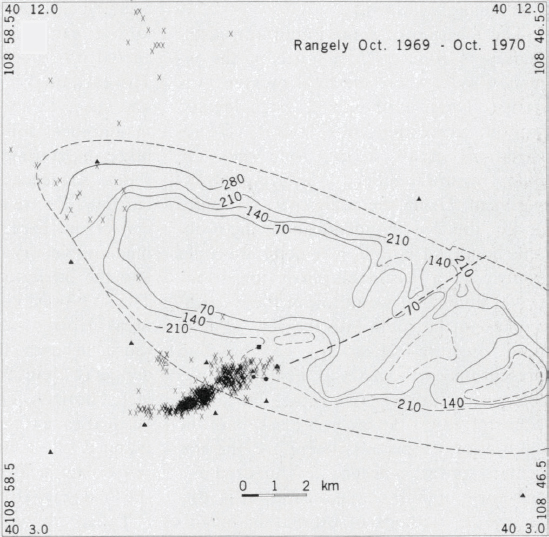
Figure 1 Earthquakes (x) located at Rangely between October 1969 and November 1970. The contours are bottom-hole 3-day shut-in pressures as of September 1969; the interval is 70 bars (7 MPa). Seismic stations are represented by triangles; experimental wells are represented by dots. The heavy, dashed line indicates the fault mapped in the subsurface. SOURCE: Raleigh et al. (1976).
With the cooperation of the Chevron Oil Company, which operated the field, USGS researchers carried out a controlled induced seismicity experiment beginning in November 1970 and continuing to May 1974 (Raleigh et al., 1976). One goal of the experiment was to quantitatively test the effective stress theory for activation of slip on preexisting faults by pore pressure increases (Box 2.1). This portion of the experiment entailed a program of careful measurements of the parameters involved in the Coulomb criterion (Box 2.1), including in situ stress measurements, monitoring and modeling of changes of reservoir pore pressures, laboratory measurement of the sliding resistance between rock surfaces in the reservoir formation where seismic events were occurring, and detailed seismic monitoring to precisely locate the events and determine the fault orientation with respect to the stress field. Together these measurements, when used with the Coulomb criterion expressed in terms of the effective stress, predicted that a critical reservoir pressure of 257 bars was required to induce earthquakes at an injection site within the cluster of earthquakes—a result that agreed with the observed and modeled pore pressures. The second phase of the experiment turned seismic events “on” and “off” by cycling the pore pressures above and below the critical reservoir pore pressure of 257 bars (25.7 MPa) (Figure 2). This experiment proved that induced seismic events could be controlled by regulating the pore pressures.
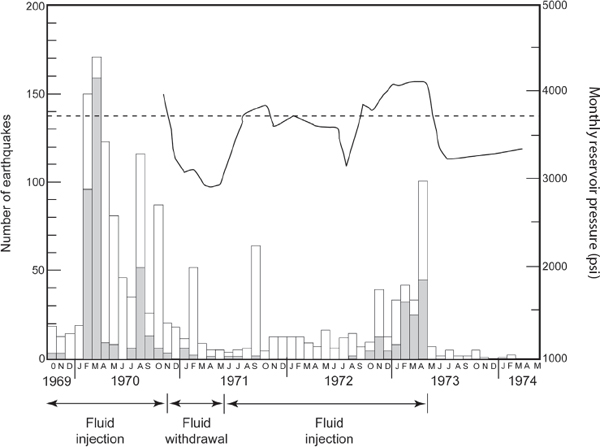
Figure 2 Frequency of seismic events at Rangely. Stippled bars are seismic events within 1 km of the experimental wells. The clear bars represent all other events. Pressure history in well Fee 69 is shown by the heavy line and predicted critical pressure is designated by the dashed line. SOURCE: Raleigh et al. (1976).
BOX 2.5
Induced Seismicity at the Lacq Gas Field (France)
The Lacq gas field in southwestern France offers one of the best-documented cases of seismicity induced by extraction of pore fluids (Grasso and Wittlinger, 1990; Segall et al., 1994). The gas reservoir is a 500-m-thick (~1,640-feet-thick) sequence of limestone that forms a dome-shaped structure at depths of 3.2 to 5.5 km (~2.0 to 3.4 miles) (Figure 1). The reservoir was highly overpressured when production started in 1957, with a pressure of about 66 MPa (660 bars) at a depth of 3.7 km (~2.3 miles) below sea level. The first felt earthquake took place in 1969, at a time when the pore pressure had decreased by about 30 MPa (300 bars). By 1983, the pressure had dropped by 500 bars, and 800 seismic events with magnitude up to M 4.2 had been recorded
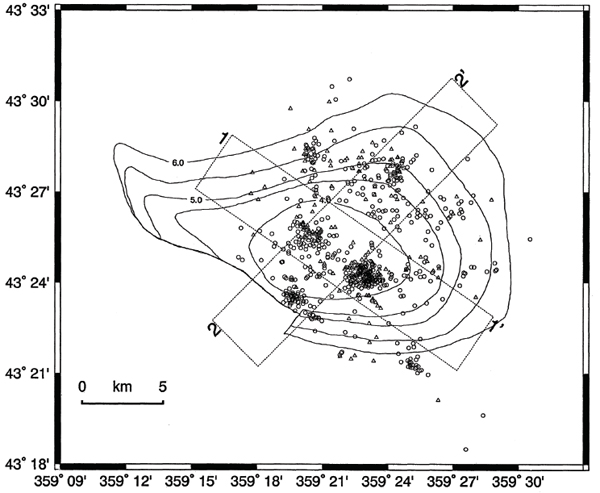
Figure 1 Location of seismic events compared to the size of the gas field (contours indicate depth to the top of the gas reservoir). Locations were determined from a local network and were based on an assumed velocity model. Triangles on the map are epicenters for events between 1976 and 1979; circles represent epicenters for events from 1982 to 1992. The rectangular areas (1-1’ and 2-2’) refer to other parts of the analysis conducted by Segall et al. (1994) and are not discussed further. SOURCE: After Segall et al. (1994).
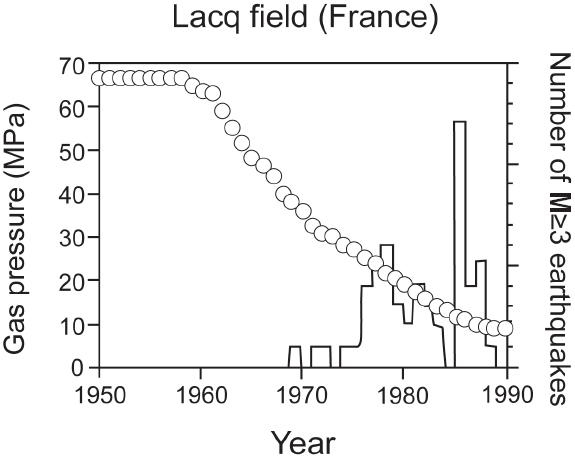
Figure 2 Decline of the pore pressure due to production at the Lacq gas reservoir and number of recorded earthquakes with magnitude M ≥ 3, with time, gas pressure (in MPa; 1 MPa is equal to 10 bars) (circles, left scale), and number of M > 3 earthquakes per year (solid line, right scale). The number of earthquakes increased with decreasing pressure. SOURCE: Segall (1989).
(Figure 2). The epicenters of 95 percent of the well-located events and all of the M > 3 events were within the boundaries of the gas field (Grasso and Wittlinger, 1990).
An analysis of the stress changes above and below the reservoir indicates that the induced seismicity is consistent with a thrust fault regime where the least compressive stress is vertical. Furthermore, the maximum shear stress change is calculated to be about 0.1 MPa (1 bar) for a pressure drop of 30 MPa (300 bars), suggesting that the in situ stress prior to production was close to causing frictional failure of the rock.
SOURCES: Segall (1989); Segall et al. (1994); Segall and Fitzgerald (1998); Grasso and Wittlinger (1990); Grasso (1992).
Both the conditions that lead to the initiation of a seismic event and the factors that affect the magnitude of the resulting event are well understood. The conditions of initiation are embodied in the Coulomb criterion (involving a comparison of the shear stress on the fault to the fault frictional strength), while the magnitude of the seismic event is related to the area of the fault undergoing slip. Inducing a seismic event requires a triggering event that will either increase the shear stress or reduce the normal effective stress on the fault and/or reduce the fault frictional resistance, for example, an increase of the pore pressure that reduces the frictional strength to a level at which it is overcome by the driving shear stress. However, to cause a significant event requires activating slip over a large enough area; for example, a seismic event of M 4 involves a fault area of about 1.4 km2 (~0.5 square miles) and a slip of about 1 m (~39 inches).
Unfortunately, despite our understanding of the factors affecting the initiation and the magnitude of a seismic event, the values of the process parameters (such as the injection rate or the volume of fluids injected) that will trigger the seismic event and what magnitude the event will be are generally not possible to quantify. The inability to make these kinds of predictions is due to several factors: (1) fragmentary knowledge of the state of stress in the Earth; (2) lack of knowledge about the faults themselves, including their existence (if they have not yet been mapped) and their orientations and physical properties; and (3) difficulty in collecting the basic data (hydraulic and mechanical parameters, geometry of the geological structure, such as the reservoir) that are required to calculate the pore pressure and stress change induced by the fluid injection or withdrawal.
Nonetheless, the insights into the mechanisms causing seismic events allow us to make some broad conclusions. In processes involving fluid injection, the pore pressure increase is the dominant factor to be considered, as stress change can often be ignored. Any increase of the pore pressure above historical undisturbed values may bring the system closer to critical conditions. The probability of triggering a significant seismic event increases with the volume of fluid injected: the larger the volume injected, the more likely a larger fault will be intersected. However, injection of fluid in depleted reservoirs (such as in secondary recovery stimulation—waterflooding) is unlikely to create an earthquake, irrespective of the volume of fluid injected, if the pore pressure remains below preproduction values.
The transient region of high pore pressure that surrounds a newly created hydraulic fracture is not expected to be large enough for a significant seismic event to be triggered, except in rare cases where the new hydraulic fracture intersects or is very near an existing fault. Even in such cases, the magnitude of the event is expected to be small because a large fault area will not be affected.
The fluid injected in crystalline basement rocks is essentially transmitted by a network of interconnected fractures and joints. Because of the high transmissivity and low storativity
of these kinds of rocks, the potential exists to induce pore pressure increase at considerable distances from the injection well and thus trigger slip on faults that are located kilometers away from the injection source.
Seismicity induced by fluid withdrawal cannot be explained without taking into account the accompanying stress changes, which are associated with the large-scale contraction of the reservoir caused by pore pressure reduction or uplift caused by removal of a significant mass of hydrocarbons. The magnitude of the events can be potentially large, because the stress change takes place over areas that are similar in size to the reservoir. However, to trigger an earthquake requires the initial state of stress to be very close to critical, because the perturbation of the stress is minute compared to the magnitude of the pore pressure reduction. For example, in the well-documented Lacq gas field (France) the increase of the maximum shear stress was estimated to be about 0.1 MPa (1 bar) in regions surrounding the reservoir for a pressure drop of 30 MPa (300 bar) in the reservoir.
Brown, E.T., and E. Hoek. 1978. Trends in relationships between in situ stresses and depth. International Journal on Rock Mechanics 15:211-215.
Fehler, M., L. House, W.S. Phillips, and R. Potter. 1998. A method to allow temporal variation of velocity in travel-time tomography using microearthquakes induced during hydraulic fracturing. Tectonophysics 289:189-202.
Grasso, J.-R. 1992. Mechanics of seismic instabilities induced by the recovery of hydrocarbons. Pure and Applied Geophysics 139(3-4):507-534.
Grasso, J.-R., and Wittlinger. 1990. 10 years of seismic monitoring over a gas field area. Bulletin of the Seismological Society of America 80:450-473.
Hanks, T.C., and H. Kanamori. 1979. A moment magnitude scale. Journal of Geophysical Research 84:2348-2350.
Heidbach, O., M. Tingay, A. Barth, J. Reinecker, D. Kurfeß, and B. Müller. 2008. The World Stress Map database release 2008, doi:10.1594/GFZ.WSM.
Hsieh, P.A. 1996. Deformation-induced changes in hydraulic head during ground-water withdrawal. Ground Water 34(6):1082-1089.
Jaeger, J.C., N.G.W. Cook, and R.W. Zimmerman. 2007. Fundamentals of Rock Mechanics, 4th ed. New York: Blackwell Publishing.
King, G.E. 2012. Hydraulic Fracturing 101: What every representative, environmentalist, regulator, reporter, investor, university researcher, neighbor, and engineer should know about estimating frac risk and improving frac performance in unconventional gas and oil wells. Paper SPE 152596 presented to the Society of Petroleum Engineers (SPE) Hydraulic Fracturing Technology Conference, The Woodlands, TX, February 6-8.
McGarr, A. 1991. On a possible connection between three major earthquakes in California and oil production. Bulletin of the Seismological Society of America 81(3):948-970.
NRC (National Research Council). 1990. The Role of Fluids in Crustal Processes. Washington, DC: National Academy Press.
NRC. 1996. Rock Fractures and Fluid Flow: Contemporary Understanding and Applications. Washington, DC: National Academy Press.
Nicholson, C., and R.L. Wesson. 1990. Earthquake hazard associated with deep well injection: A report to the U.S. Environmental Protection Agency. U.S. Geological Survey (USGS) Bulletin 1951. Reston, VA: USGS. 74 pp.
Raleigh, C. B., J.H. Healy, and J.D. Bredehoeft. 1976. An experiment in earthquake control at Rangely, Colorado. Science 191:1230-1237.
Scholz, C.H. 2002. The Mechanics of Earthquakes and Faulting. Cambridge: Cambridge University Press.
Segall, P. 1989. Earthquakes triggered by fluid extraction. Geology 17:942-946.
Segall, P., and S.D. Fitzgerald. 1998. A note on induced stress changes in hydrocarbon and geothermal reservoirs. Tectonophysics 289:117-128.
Segall, P., J.-R. Grasso, and A. Mossop. 1994. Poroelastic stressing and induced seismicity near the Lacq gas field, southwestern France. Journal of Geophysical Research 99(B8):15,423-15,438.
Shapiro, S.A., R. Patzig, E. Rothert, and J. Rindschwentner. 2003. Triggering of seismicity by pore-pressure perturbations: Permeability-related signatures of the phenomenon. Pure and Applied Geophysics 160(5):1051-1066.
Van Eijs, R.M.H.E., F.M.M. Mulders, M. Nepveu, C.J. Kenter, and B.C. Scheffers. 2006. Correlation between hydrocarbon reservoir properties and induced seismicity in the Netherlands. Engineering Geology 84:99-111.
Wang, H.F. 2000. Theory of Linear Poroelasticity with Applications to Geomechanics and Hydrogeology. Princeton, NJ: Princeton University Press.
Wells, D.F., and K.J. Coppersmith. 1994. New empirical relationships among magnitude, rupture length, rupture width, rupture area, and fault displacement. Bulletin of the Seismological Society of America 84(4):974-1002.
Zoback, M.L., and M.D. Zoback. 1980. State of stress in the conterminous United States. Journal of Geophysical Research 85:6113-6156.
Zoback, M.L., and M.D. Zoback. 1989. Tectonic stress field of the conterminous United States. Memoirs of the Geological Society of America 172:523-539.


