
Retirement Process in Japan: New Evidence from the Japanese Study on Aging and Retirement1(JSTAR)
Hidehiko Ichimura and Satoshi Shimizutani
One of the most distinct characteristics of the Japanese labor market of the elderly is “late retirement,” compared to the other countries of the Organisation for Economic Co-operation and Development (OECD). The data on effective retirement age, which is most frequently quoted for an international comparison, show that the average effective retirement age for Japanese males is 69.5 years and for females is 66.5 years. These are the oldest ages among developed countries (Organisation for Economic Co-operation and Development, 2008).
Clearly, this measure alone is insufficient to capture decisions about retirement. At least three limitations are pointed out in the literature. First, the definition of retirement depends on subjective perceptions that may differ across individuals (Lazear, 1986; Lumsdaine and Mitchell, 1999). For example, several studies have revealed that the timing of retirement does not coincide with the decision to leave the labor force or to receive pension benefits (e.g., Banks and Smith, 2006, for the United Kingdom, and Shimizutani, 2011, for Japan). Second, individuals may not retire at once
____________
1 This study was prepared for the Conference on Policy Research and Data Need to Meet the Challenges and Opportunities of Population Aging in Asia, New Delhi, on March 14-15, 2011. We are grateful to the Indian National Science Academy, the host of the conference, and other sponsoring organizations. We also thank Asako Jufuku, Hirokazu Matsuyama, and Yuta Kikuchi for excellent research assistance. In addition, we thank the referees and Daigo Nakata, as well as participants at the conference for their constructive comments. Ichimura thanks the Japan Society for the Promotion of Science for its support through the Basic Research Grant.
but gradually, and the process of retirement may take some time. In addition, retirement may not be an absorbing state (Banks and Smith, 2006). Third, the retirement decision may be jointly made by a married couple (Gustman and Steinmeier, 2009). If this is the case, retirement behavior needs to be considered as an outcome of intrahousehold decision-making, in addition to a variety of factors including socioeconomic, health, and other circumstances.
In this chapter, we will describe Japanese workers’ retirement processes using the Japanese Study on Aging and Retirement (JSTAR). JSTAR, for the first time, provides publicly available panel data on individuals who were between the ages of 50-75 in 2007. To our knowledge, this study is the first to explore the retirement process in Japan using panel data. Thus, the contribution of this study is to provide new evidence on the process uncovered by JSTAR.
While research on retirement in Japan has been accumulated, the studies are limited in two ways.2 First, the studies use cross-sectional data, which makes it impossible to uncover a retirement “process.” Second, the studies use data sets with a very limited variety of variables. In particular do they contain family demographics, such as spouses’ work status or if they have elderly or other dependents?3
JSTAR, a sister survey of the Health and Retirement Study (HRS), English Longitudinal Survey on Ageing (ELSA), and Survey on Health, Ageing and Retirement in Europe (SHARE), overcomes those two obsta-
____________
2 Research carried out in Japanese workers’ retirement behavior is largely limited to two areas: the labor supply effect of social security earnings test and the effect of mandatory retirement on the transition from a primary job to a secondary job.
3 Some existing surveys are often used in analysis of aging in Japan. The National Survey of Family Income and Expenditure collects data every five years on a wide variety of economic variables and family demographics but less information on health. The Comprehensive Survey of People’s Living Conditions is implemented every three years with small-scale surveys in between years to collect rich information on health, family, and some economic variables. The Survey on Employment of the Elderly focused on working conditions and experience of the elderly between 55 and 69 but ended in 2004. Those surveys are large but cross-sectional. On the other hand, there are three panel data sets on elderly people. The National Long-run Panel Survey on the Life and Health of the Elderly started in 1987 and collects data every three years, which is a Japanese version of AHEAD. Together with the Nihon University Japanese Longitudinal Study of Aging, these surveys provide detailed information on the health status of the elderly aged 60 (or 65) and older and less information on economic status. Thus, the retirement process is not captured well. Lastly, the Ministry of Health, Labour, and Welfare started a panel survey of the senior population (Chukonen Jyudan Chosa), tracking individuals in their 50s in 2007 every two years. The sample size is larger than that of JSTAR with nationwide regions, but the information is insufficient to capture precise amounts of pension income or medical/long-term care expenses. It also lacks data on previous working experiences or future expectations. In most cases, microdata are not accessible or only limitedly accessible.
cles. JSTAR contains a variety of variables comparable to those in HRS/ELSA/SHARE and intends to address a variety of socioeconomic issues related to the aging population, with an emphasis on both interdisciplinarity and international comparability (see Ichimura, Hashimoto, and Shimizutani, 2009).
MEASUREMENT OF RETIREMENT
Retirement depends on definition. The definitions include an affirmative answer to a question regarding retirement status: “Are you currently retired?” as well as a state in which the individual is out of the labor force with the intention of remaining out permanently, and a state in which the individual receives some of his or her income as pension benefits (Lazear, 1986).4 We explore retirement behavior using the three measures by examining the first wave (baseline) of JSTAR in this section. The sample in the baseline are those who are aged 50-75 and randomly chosen from household registration after regional stratification in each of the five municipalities in 2007.5 The sample size is more than 4,000, excluding those who did not provide information on work status from the total sample size of about 4,200.
Figures 8-1a and 8-1b illustrate nonworking status and its decomposition for males and females separately.6 For males, the proportion of the nonworking very gradually increases from less than 5% at age 50 to about 8% at age 59, but the share jumps at age 60 to about 17% and increases along with age in the 60s. However, the nonworking proportion is still only slightly above 60% at around age 70. Most nonworkers are accounted for by retirement, but only slightly above 50% classify themselves as retired at age 70. The results differ from those by Banks and Smith (2006),
____________
4 Lazear (1986) includes further definitions such as (1) a state the individual has reduced his/her hours substantially from some lifetime average and intends to maintain hours at or below the current level, (2) a state that the individual appears on some company’s retirement roll, and (3) a state that the individual receives a primary social security payment. We will refer to (1) below.
5 Note that JSTAR does not employ a probabilistic national sampling but has an emphasis on securing a larger number of samples in the same socioeconomic environment.
6 JSTAR asked respondents and spouses, if any, to choose one among the following choices when asked about their current working status: (1) currently working, (2) leave of absence, (3) not currently working, (4) don’t know, and (5) refuse to answer. Respondents who choose (1) or (2) are “working” and those who choose other choices are further asked whether they are searching for a job currently or plan to search in the future. If the answer is affirmative, they are categorized as “unemployed.” The respondents who are neither explicitly working nor unemployed are further divided into retired, homemakers, or medically treated. As explained above, these questions are also asked for the spouses, but we only use the data on the respondents in this chapter.
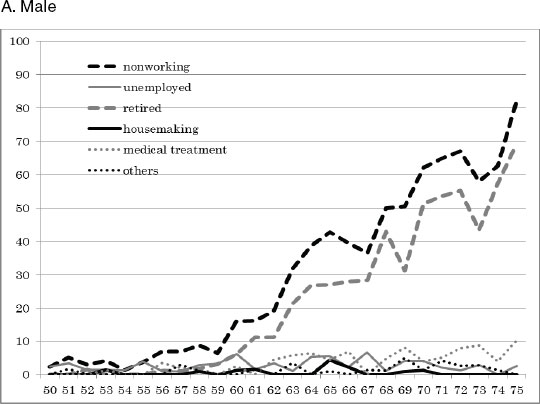
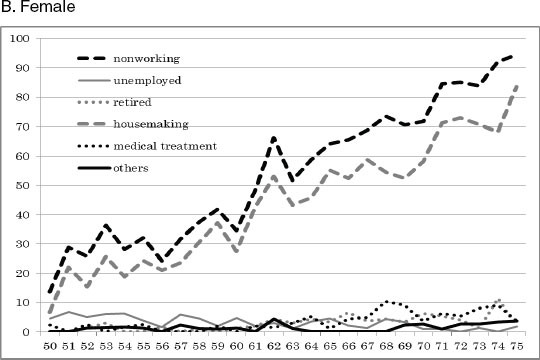
FIGURE 8-1 The proportion of males and females who are nonworking.
SOURCE: Data from JSTAR (2007).
which reveal that nonworking status and retirement is identical for people aged 65 and older in the United Kingdom. For females, the proportion of those nonworking is higher than that for males and increases with age after 50, compared to 60 for males. At a closer look, the proportion starts at about 12% at age 50 and increases to about 40% at age 60. It continues to increase in the 60s, reaching 70% at age 70. In contrast to males, a larger fraction of women’s nonworking status is accounted for by homemaking, not by retirement. We should note that this must be women who are now no longer working and describe themselves as “homemakers” rather than “retired,” although they are retired in the sense of having left the labor force as they reach traditional retirement ages. Those patterns do not differ much across different educational attainment either for males or females (results are omitted to save space).7
Figures 8-2a-d present the distribution of actual and expected retirement age in the first wave. We use the term “actual retirement age” for those who have already retired to differentiate from “expected retirement age” referring to those who have yet not retired.8 For males, the left panel of the figure shows twin peaks in the histogram of actual retirement age, and the mode (25%) is found at age 60, followed by age 65 (15%). In contrast, the right panel shows that the age to retire in the future is concentrated at age 65, followed by age 70 and age 60. While omitted to save space, the distribution of actual retirement age is homogeneous across different levels of educational attainment, while that of expected retirement age is later for lower educational attainment. The largest fraction is observed at age 70 among those who completed junior high school only.
For females, the largest fraction in distribution of actual retirement age (left panel) is observed at age 60, which is also the case for males but the distribution is flatter, implying the distribution has a single peak at age 60. In contrast, the largest fraction in expected retirement age (right panel) is found at age 65, identical with the case for males, but the second peak is found at age 60 in contrast to age 70 for males. When decomposing by educational attainment, females’ expected retirement age is later at age 70 for lower educational attainment.
In sum, the most frequently observed retirement age for those who have already retired is age 60 for both sexes, followed by age 65 for males. The most popular retirement age for those who are expecting to retire
____________
7 The proportions of nonworking persons from the Labor Force Survey are 6.9% (39.2%) for those aged 55-59, 25.6% (57.8%) for those aged 60-64, and 51.5% (74.2%) for those aged 65-75 for males (females).
8 A very small portion of the respondents had retired before reaching age 50, and they are omitted from the figures. The sample size is 438 (797) for males and 57 (450) for females for actual (expected) retirement age. Seven respondents answered in a range (i.e., I expect to retire between age A and age B) and are excluded.
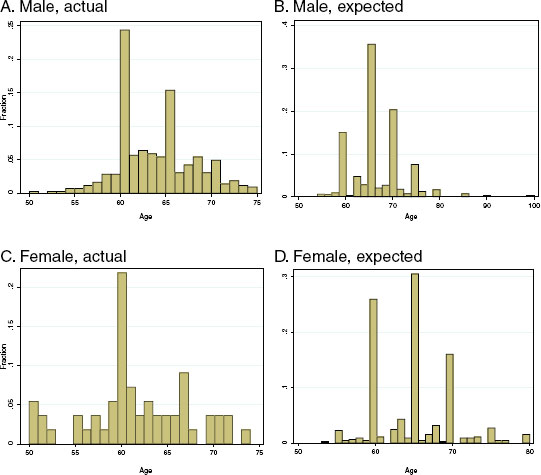
FIGURE 8-2 The distribution of retirement age.
SOURCE: Data from JSTAR (2007).
is age 65 for both sexes, followed by age 70 for males and by age 60 for females.9 The distribution of actual retirement age does not differ much across educational attainment for both sexes, but the expected retirement age tends to be later for those with lower education.
Of course, these patterns may be a reflection of employment institutions, such as the start year to receive pension benefits. Thus, we turn to an examination of the distribution of the age to receive a pension.
The public pension program in Japan consists of three programs: the Employees’ Pension Insurance (EPI, Kosei Nenkin) whose pensioners
____________
9 Rust (1989) found “twin peaks” in the retirement ages for older Americans who file for Social Security benefits using the Retirement History Survey (RHS) in the 1970s. The two peaks are observed at age 62 when the individual is eligible to receive a reduced benefit and at age 65 when the individual is eligible to full benefits. Lumsdaine and Mitchell (1999) argue that the two marked peaks remain after controlling for pension income available at those ages.
are private-sector employees; the Mutual Aid Insurance (MAI; Kyosai Nenkin) covering employees in the public sector and private schools; and the National Pension Insurance (NPI; Kokumin Nenkin) whose pensioners are not covered by EPI or MAI.10 NPI has a flat-rate benefit only, and the normal eligibility age is 65 for both sexes. The minimum years of contribution is 25 years, and the monthly benefit for the fully insured (with 40 years of contribution) is about 66,000 yen per month (about US $800). The NPI program allows a 10-year window in claiming benefits. Individuals who claim benefits between ages 60 and 64 undergo benefit reduction, and individuals who claim benefits between ages 66 and 70 enjoy benefit rewards.11
The EPI program consists of flat-rate and wage-proportional components. The flat-rate component has the same contribution-benefit structure as NPI and the wage-proportional component depends on age, months of contributions, and a benefit multiplier that differs across gender and birthday. The normal eligibility ages for both components of EPI are set at age 65, but EPI beneficiaries are also entitled to receive a “special benefit” before age 65 that is close to formal benefits in most cases. The normal eligibility ages for special benefits differs between males and females and between flat-rate and wage-proportional components. As of 2011, the eligibility age for the wage-proportional component is 60 for both sexes, not allowing earlier or later claiming. Meanwhile, the eligibility age for the flat-rate component has gradually risen since 2001, and it was 63 for males and 61 for females in 2007. EPI beneficiaries were able to enjoy earlier claiming of the flat-rate component of a special benefit for males aged 60-62 and females aged 60 in 2007. One can delay either the flat-rate or wage-proportional component. (See the detail formula in Shimizutani and Oshio, 2011.) In contrast with some European countries that have high take-up rates, the disability program participation is still low and the effect on labor force participation is very limited in Japan. The main reason is the strict eligibility rules, although major revisions to the disability program have slightly expanded the eligibility for these programs (Oshio and Shimizutani, 2011).
Together with the social security program, the employment policies for the elderly have been reformed, focusing on extension of mandatory retirement age. In 2004, the Employment Measures Law was revised to include an obligatory clause that requires firms to raise the mandatory
____________
10 In terms of the number of pensioners, EPI and NPI contributed to the total by slightly less than one-half respectively, and MAI occupies the remaining small portion.
11 For those who were born after April 2, 1941, the actuarial reduction rate before age 65 is 0.5% per month and the actuarial credit rate after age 65 is 0.7% per month (Shimizutani and Oshio, 2011).
retirement age to 65 or above by 2013 or to completely abolish it. The proportion of firms with mandatory retirement steadily increased to above 90% in the mid-1990s, and the most dominant retirement age is now 60. Some firms have indeed started extending it further to age 65 (Oshio, Oishi, and Shimizutani, 2011).
Figures 8-3a and 8-3b depict the distribution of age to start receiving any type of public pension benefits. The sample is confined to those who have received any benefits. For both sexes, close to one-half of the respondents started to receive pension benefits at age 60. The second largest fraction is found at age 65: one-quarter for males and more than 30% for females. This observation reflects the eligible ages to receive public pension benefits.
That the proportion of those who started to receive pension benefits at age 65 is larger for females reflects the fact that a larger fraction than males are NPI pensioners. By educational attainment, females who are junior high school graduates represent the largest proportion at age 65, followed by age 60, which also is a reflection that a larger proportion of NPI pensioners are females rather than males. The distribution of males is not changed across educational level.
The observation in this section is that age 60 is a specific age in Japan to retire, probably because it is the age at which people become eligible to receive pension benefits. Because the eligible age for EPI pension benefits is now in transition from 60 to 65, it is natural that the expected retirement age is changing to age 65 for the yet-to-be-retired group. However, we should keep in mind that the proportion of people working exceeds more than 30% at age 70 and some portion of the elderly keep working in their later age. In other words, the institutional reason is an important factor to account for retirement behavior but cannot completely explain labor supply behavior of the elderly.12 This is what we examine in the next section.
TRANSITION IN WORKING STATUS BETWEEN JSTAR FIRST AND SECOND WAVES
This section focuses on the transition of work status, using both the first and second waves in JSTAR. By doing so, we capture retirement “process,” which has been unexplored in Japan. The sample is confined to the respondents who were interviewed in both waves in the five municipalities.
First, we preview retirement process transition between two years in terms of the change of work status and hours worked before retirement.
____________
12 Banks and Smith (2006) provide evidence that the proportion of nonworking and retirement jumps to 100% at age 65 in the United Kingdom because of an institutional reason: pension benefits depend on the last salary.
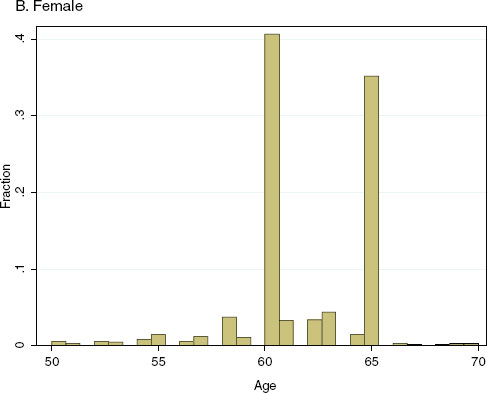
FIGURE 8-3 The distribution of starting age to receive benefits.
SOURCE: Data from JSTAR (2007).
The work status and hours worked are measured at the time of interview. Table 8-1 shows the change in work status between the first and the second wave in three definitions (working/nonworking, employed/self-employed, and full-time/part-time status) in three age ranges (60-64, 65-69, and 70 and older as of the first wave). In what follows, we call those who are wage earners and not self-employed “employed” and those who are working on a regular basis “full-time” workers. For males, the upper panel of the table shows that the transition probability into “not working” from “working” increases after age 65 from about 20 to 25%. The transition probability into “working” from “not working” drops sharply after age 65 from 17 to 5% and remains the same for the age group 70-75. For females, the transition probability into “not working” from “working” increases after age 70 from less than 20 to 27% while the transition probability into “working” from “not working” gradually drops from about 8 to 3% from age 60-75. The middle panel shows that there is very little transition between self-employment and employment status from age 60-75 for both sexes.
TABLE 8-1 Transition of Work Status Between Two Years
| Male | |||
| 2009 | |||
| Age 60-64 | Working | Not Working | |
| 2007 | Working Not Working |
80.3% 17.1% |
19.7% 82.9% |
| 2009 | |||
| Age 65-69 | Working | Not Working | |
| 2007 | Working Not Working |
75.0% 5.4% |
25.0% 94.6% |
| 2009 | |||
| Age 70-75 | Working | Not Working | |
| 2007 | Working Not Working |
77.5% 5.0% |
22.5% 95.0% |
| Female | |||
| 2009 | |||
| Age 60-64 | Working | Not Working | |
| 2007 | Working Not Working |
83.0% 8.2% |
17.0% 91.8% |
| 2009 | |||
| Age 65-69 | Working | Not Working | |
| 2007 | Working Not Working |
85.1% 5.6% |
14.9% 94.4% |
| 2009 | |||
| Age 70-75 | Working | Not Working | |
| 2007 | Working Not Working |
73.0% 2.6% |
27.0% 97.4% |
| Male | |||
| 2009 | |||
| Age 60-64 | Employed | Self-Employed | |
| 2007 | Employed Self-Employed |
98.0% 0.0% |
2.0% 100.0% |
| 2009 | |||
| Age 65-69 | Employed | Self-Employed | |
| 2007 | Employed Self-Employed |
100.0% 4.1% |
0.0% 95.9% |
| 2009 | |||
| Age 70-75 | Employed | Self-Employed | |
| 2007 | Employed Self-Employed |
100.0% 0.0% |
0.0% 100.0% |
| Male | |||
| 2009 | |||
| Age 60-64 | Full time | Part time | |
| 2007 | Full time Part time |
28.6% 5.4% |
71.4% 94.6% |
| 2009 | |||
| Age 65-69 | Full time | Part time | |
| 2007 | Full time Part time |
40.0% 2.0% |
60.0% 98.0% |
| 2009 | |||
| Age 70-75 | Full time | Part time | |
| 2007 | Full time Part time |
16.7% 0.2% |
83.3% 99.8% |
| Female | |||
| 2009 | |||
| Age 60-64 | Employed | Self-Employed | |
| 2007 | Employed Self-Employed |
98.5% 1.8% |
1.5% 98.2% |
| 2009 | |||
| Age 65-69 | Employed | Self-Employed | |
| 2007 | Employed Self-Employed |
97.1% 3.8% |
2.9% 96.2% |
| 2009 | |||
| Age 70-75 | Employed | Self-Employed | |
| 2007 | Employed Self-Employed |
100.0% 0.0% |
0.0% 100.0% |
| Female | |||
| 2009 | |||
| Age 60-64 | Full time | Part time | |
| 2007 | Full time Part time |
42.1% 2.0% |
57.9% 98.0% |
| 2009 | |||
| Age 65-69 | Full time | Part time | |
| 2007 | Full time Part time |
37.5% 0.9% |
62.5% 99.1% |
| 2009 | |||
| Age 70-75 | Full time | Part time | |
| 2007 | Full time Part time |
50.0% 0.1% |
50.0% 99.9% |
SOURCE: Data from JSTAR (2007).
The lower panel shows the transition probability between full-time and part-time work. The information on full-time/part-time status is available only for the respondents who were employed or were high-ranked managers, so the sample size is reduced. As stated, full-time status is defined as whether one worked on a regular basis or not. For males, the transition probability into “part time” from “full time” is more than 70% and 60% in their 60s, and it increases to more than 83% after age 70. The transition probability into “full time” from “part time” is low, at 5% for the first half of the 60s and lower for the older group. For females, the transition into part time from full time remains at around 50 to 60% throughout the age range. The transition probability into “full time” from “part time” for female is low at 2% for the first half of the 60s and lower for the older group.
Second, we examine changes in working hours before retirement. Figures 8-4a and 8-4b present evidence on working hours in the first wave (2007) for those who had retired by the second wave (2009). The working hours are converted into an annual basis using hours worked per week and weeks worked, i.e., 52 weeks minus nonworking weeks. Figure 8-4a reports the mean of annual working hours in three age groups (60-64, 65-69, and 70 and older) in the first wave for males and females, respectively. For males, the average annual working hours are 1,890 hours for ages 60-64, decline to 1,390 for ages 65-69, and remain at the same level for age 70 and older (1,380 hours). Males who retire at ages 60-64 seem to retire from close to full-time work, but this tendency is weakened in the older age group. For females, the average working hours is 1,620 hours for ages 60-64 and decreases to 940 hours for ages 65-69. Surprisingly, the average working hours jumps up to 1,870 hours, which corresponds to working hours for full-time workers, probably because only full-time workers keep working after 70 and older.
Figure 8-4b verifies this result further by examining 25th percentile, 50th percentile, and 75th percentile of hours worked per year for those who retired in the age categories we examined. For males, individuals below 65 seem to retire directly from full-time work. In older age categories, however, the majority of males seem to retire after reducing some work hours. For females, although the majority seem to retire from full-time work below age 65, more than 25% retire via reduced working hours. Most individuals who retire in the 65-69 category seem to retire via reduced work hours while individuals who retire above 70 seem to retire directly from full time.
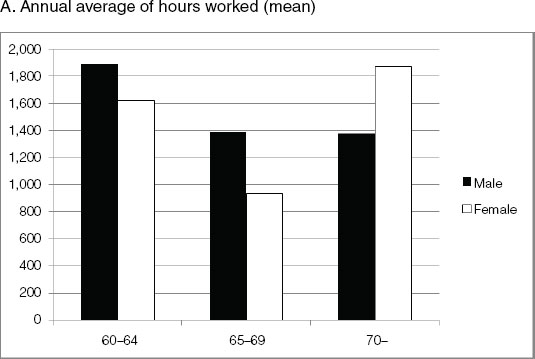
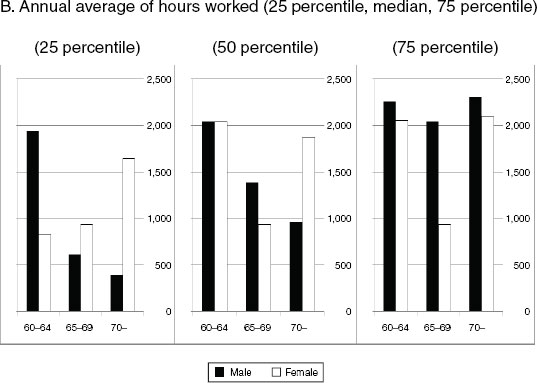
FIGURE 8-4 Hours worked before retirement.
SOURCE: Data from JSTAR (2007).
EMPIRICAL FRAMEWORK
We empirically examine the retirement process above using a regression framework. Our emphasis is on fact-finding, taking advantage of the first opportunity to explore the retirement process with JSTAR. Thus, we employ a reduced-form specification to examine how specific predetermined variables are associated with endogenous variables.
We first examine the retirement decision in 2009, R2009, given the work status (working or not working) in 2007, W2007, and other variables. We employ the linear probability model for the ease of interpretation of the coefficients where we conduct the empirical analysis separately for males and females with different working status in 2007. For those who were working in 2007, we introduce dummy variables indicating different hours of work status: less than 30 hours per week, between 30-40 hours per week, and above 40 hours a week. These dummy variables are denoted by dHW.
We also include age (in 2007) dummy variables: 50-59, 60-64, 65-69, and 70 and older. These dummy variables are denoted by dA. Age and hours-worked dummy variables are interacted completely. By fully interacting the dummy variables, we intend to capture the effects of age and working hours on the outcome variables flexibly. The interaction terms are denoted by dA . dHW.
We wish to control for a host of other variables. We gather these variables in three categories: health-related variables (denoted xH), socioeconomic-related variables (denoted xSE), and family-related variables (denoted xF).
Health-related variables include word recall measuring the memory, grip strength, Activities of Daily Living (ADL) limitation , and a measure of depression in 2007. The socioeconomic variables include net assets over lifetime in 2007, educational attainment, and employment status (employed or self-employed) if working. Family-related variables include marital status, as well as its change between 2007 and 2009, the youngest child’s age, and the number of parents for whom the individual provides care.
In order to conserve the number of parameters, we assume that these variables affect an outcome only via three linear indices (x’HθH, x’SEθSE, and x’ FθF) representing each of the three categories using the variables discussed above. We then interact each of these three indices completely with the age and hours-worked dummy variables and also with the interaction terms of age and hours-worked dummy variables to allow for flexible ways these variables affect the outcome. We keep the index structure to conserve the number of parameters.
The estimated model is
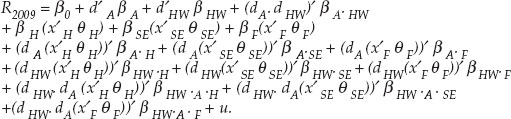
Note that the resulting model is a nonlinear in its parameters. We normalize the coefficients defining the three indices by setting one of the coefficients to 1; for the health index the variable corresponding to the normalized coefficient is the CES-D scale depression measure, for the socioeconomic index it is the dummy variable indicating high education level (more than two-year college), and for the family index it is whether the person is married or not in 2007.
We refer to the males’ and females’ regression results for 2007 workers as Regression 1 and results for 2007 nonworkers as Regression 2. For nonworkers, there is no conditioning on the hours-worked dummy variables. We also conduct the same regression analysis for the working hours given the same set of regressors for males and females who worked in 2007. We refer to the results as Regression 3.
ESTIMATION METHOD
We estimate all models in Regressions 1-3 by the nonlinear least squares method using the model specified.
In carrying out the estimation, we faced some difficulty due to item nonresponse in certain regressors. In order to keep as many samples as possible in the estimation, we “impute” the missing data for three variables: total assets, grip strength, and word recall, before estimating each specification. We apply the method of Arellano and Meghir (1992) in our context of missing regressors assuming that the nonresponses occur randomly.
First, we regress total assets on all the regressors in the estimation as well as additional variables (information on the job at age 54) for those whose asset data is available. Then, we obtain a “total asset hat” using the actual values if not missing and the estimated values if missing. Second, we perform the similar procedure for word recall using “total asset hat” and obtain “word recall hat.” Third, we again perform the similar procedure for grip strength using “total asset hat” and “word recall hat” and obtain “grip strength hat.” Finally, we estimate “total asset hat hat” using “word recall hat” and “grip strength hat.” We use those three estimated
variables in the estimation. We performed those steps separately for each estimation.
EMPIRICAL RESULTS
Table 8-2 presents the summary statistics of the variables used in the regressions. The sample size of those whose work status was available in 2009 and were aged between 50-74 in 2007 are 1,481 for males and 1,430 for females, respectively.
We review the statistics below, comparing males and females. First, the proportion of retired respondents in 2009 is 36% for males and 58% for females. The averages of weekly working hours are reduced from 30.1 hours to 25.4 hours for males, and from 13.3 hours to 12.1 hours for females between the two years. Second, the age structure is similar for both sexes: about 40% in their 50s, with a slightly higher proportion for males. Third, the proportion of the depressed, which is measured in the Center for Epidemiological Studies Depression Scale (CES-D Scale), or the number of words recalled are slightly higher for females, while grip strength is higher for males. A smaller proportion of both sexes have ADL limitations in terms of six basic activities. Fourth, the proportion of having a spouse is close to 90% for males and three-quarters for females, while that of having a working spouse is more than 50% for males and 60% for females. About 10% are engaged in family care of their own or spousal parents. The proportion of those who do not have a child is less than 10% and the age of the youngest child is higher for females. Fifth, educational attainment is higher for males, which is observed in the higher proportion of graduates of two-year colleges or more (including university graduates). The share of EPI or MAI beneficiaries is higher for males. The amount of net assets is also larger for males. The amount is defined as the sum of current stock of assets, either financial or real, minus any debts, either mortgage or nonmortgage, labor income before retirement (expected retirement age as available if not yet retired), Social Security benefits between retirement and the timing of death (expected survival age as available) and expected (or realized) bequests, subtracting expected expenditure (including imputed rents) between now to death. In the regression analysis, four categorical dummy variables are created by dividing the asset level into four groups depending on thresholds of net assets: 1 million, 15 million, and 35 million yen.
Table 8-3 reports the estimated coefficients in Regressions 1-3 for males. The third column reports the result of Regression 2, which explores the factors affecting probability of retirement in 2009 given the respondent reported being retired in 2007. The result indicates that most males are still retired with probability close to 1, except for those in their 50s who
TABLE 8-2 Summary Statistics
| Male | Female | |||||
| Variables | # Obs. | Mean | S.D. | # Obs. | Mean | S.D. |
| Retirement in 2009 | 1,481 | 0.36 | 0.48 | 1,430 | 0.58 | 0.49 |
| Working hours in 2009 [#] | 1,388 | 25.36 | 23.57 | 1,363 | 12.06 | 18.40 |
| Working hours in 2007 [#] | 1,929 | 30.07 | 24.65 | 1,957 | 13.25 | 19.01 |
| Working hours | 1,929 | 1,957 | ||||
| Working hours = 0 | 0.31 | 0.46 | 0.58 | 0.49 | ||
| 0 < Working hours ≤ 30 | 0.11 | 0.31 | 0.18 | 0.38 | ||
| 30 < Working hours ≤ 40 | 0.06 | 0.23 | 0.08 | 0.26 | ||
| 40 < Working hours | 0.52 | 0.50 | 0.17 | 0.37 | ||
| Age | 2,032 | 2,031 | ||||
| Age 50-59 | 0.39 | 0.49 | 0.35 | 0.48 | ||
| Age 60-64 | 0.20 | 0.40 | 0.20 | 0.40 | ||
| Age 65-69 | 0.21 | 0.41 | 0.20 | 0.40 | ||
| Age 70-74 | 0.19 | 0.39 | 0.22 | 0.41 | ||
| Depressed | 1,903 | 0.23 | 0.42 | 1,905 | 0.27 | 0.44 |
| Memory (word recall) [#] | 1,768 | 4.94 | 1.59 | 1,860 | 5.33 | 1.58 |
| ADL limitations (any) | 2,022 | 0.05 | 0.22 | 2,029 | 0.06 | 0.24 |
| Grip strength [#] | 1,898 | 35.73 | 6.96 | 1,959 | 22.71 | 4.73 |
| Spouse | 2,032 | 0.88 | 0.32 | 2,031 | 0.75 | 0.44 |
| Working spouse | 1,785 | 0.53 | 0.50 | 1,516 | 0.60 | 0.49 |
| Providing care | 2,032 | 0.14 | 0.45 | 2,031 | 0.11 | 0.37 |
| No child | 2,032 | 0.09 | 0.29 | 2,030 | 0.08 | 0.28 |
| Minimum child age [#] | 1,833 | 30.30 | 8.33 | 1,847 | 34.11 | 8.27 |
| Education | 2,032 | 2,031 | ||||
| Education_ high | 0.26 | 0.44 | 0.15 | 0.36 | ||
| Education_middle | 0.41 | 0.49 | 0.50 | 0.50 | ||
| Education_low | 0.33 | 0.47 | 0.35 | 0.48 | ||
| EPIMAI | 1,878 | 0.75 | 0.43 | 1,876 | 0.45 | 0.50 |
| Net asset in million yen | 1,468 | 1,374 | ||||
| Asset > 35 | 0.33 | 0.47 | 0.26 | 0.44 | ||
| 15 ≤ Asset < 35 | 0.28 | 0.45 | 0.25 | 0.43 | ||
| 1 ≤ Asset < 15 | 0.19 | 0.39 | 0.22 | 0.42 | ||
| Asset < 1 | 0.20 | 0.40 | 0.26 | 0.44 | ||
NOTE: [#] means the variable is not a dummy variable.
SOURCE: Data from JSTAR (2007).
have a point estimate of being in the retired status with probability 46.8% when health, family, and socioeconomic indices are held at 0. None of these indices is statistically significant for any age group, although point estimates are sometimes nontrivial.
For males who worked in 2007, we examine the retirement decision depending on different hours worked in that year: less than 30 hours per week, greater or equal to 30 but less than 40 hours per week, and greater
TABLE 8-3 Male Estimation
| Column | 1 | 2 | 3 | 4 |
| Working Hours in 2007 > 0 | Working Hours in 2007 = 0 | |||
| Retirement in 2009 | Working hours in 2009 | Retirement in 2009 | Working hours in 2009 | |
| Constant | -1.259 (0.285)*** | -76.53 (54.34) | 0.468 (0.392) | 33.08 (18.81) |
| H index (health index) | -0.0558 (0.0421) | -21.38 (9.266)* | -0.0689 (0.0863) | 2.635 (3.346) |
| F index (family index) | 0.592 (0.179)*** | 3.102 (4.785) | -0.230 (0.151) | 4.028 (5.070) |
| E index (economic index) | -0.0871 (0.0743) | -0.374 (1.325) | -0.00554 (0.0387) | 1.656 (3.399) |
| Age 60-64 | 1.467 (0.578)* | 76.61 (54.78) | 0.473 (0.491) | -40.90 (21.85) |
| Age 65-69 | 3.314 (0.757)*** | 48.44 (51.94) | 0.541 (0.464) | -35.54 (20.99) |
| Age 70-74 | -0.0264 (1.415) | 50.38 (47.26) | 0.423 (0.404) | -32.79 (19.33) |
| H3040 (30 ≤ working hours ≤ 40) | 1.038 (0.430)* | 109.4 (55.34)* | ||
| Hm40 (40 < working hours) | 1.387 (0.291)*** | 107.3 (52.99)* | ||
| Age 60-64 *H3040 | 0.636 (0.817) | -95.01 (61.26) | ||
| Age 65-69 * H3040 | -2.141 (0.969)* | -92.96 (61.59) | ||
| Age 70-74 * H3040 | 0.247 (1.404) | -98.20 (58.55) | ||
| Age 60-64 * Hm40 | -1.348 (0.659)* | -48.81 (52.54) | ||
| Age 65-69 * Hm40 | -3.061 (0.798)*** | -20.31 (52.06) | ||
| Age 70-74 * Hm40 | 0.805 (1.597) | -31.41 (65.37) | ||
| H3040 * H index | 0.214 (0.165) | 21.20 (9.770)* | ||
| Hm40 * H index | 0.0522 (0.0439) | 18.90 (9.102)* | ||
| H3040 * F index | -0.356 (0.237) | -2.131 (3.836) | ||
| Hm40 * F index | -0.632 (0.188)*** | -2.499 (4.079) | ||
| H3040 * E index | 0.0324 (0.0624) | 0.471 (1.571) | ||
| Hm40 * E index | 0.0899 (0.0765) | 0.593 (1.530) | ||
| Age 60-64 * H index | 0.0236 (0.0658) | 15.60 (9.024) | 0.112 (0.130) | -5.106 (5.709) |
| Age 65-69 * H index | 0.167 (0.0954) | 15.82 (9.215) | 0.0846 (0.102) | -2.742 (3.450) |
| Age 70-74 * H index | -0.185 (0.128) | 16.38 (9.258) | 0.0306 (0.0553) | -2.405 (3.152) |
| Age 60-64 * H3040 * H index | -0.140 (0.166) | -18.06 (9.968) | ||
| Age 65-69 * H3040 * H index | -0.236 (0.213) | -22.93 (10.84)* | ||
| Age 70-74 * H3040 * H index | 0.0264 (0.189) | -29.52 (13.33)* | ||
| Age 60-64 * Hm40 * H index | -0.0721 (0.0786) | -11.85 (9.224) | ||
| Age 65-69 * Hm40 * H index | -0.136 (0.0869) | -9.005 (9.356) | ||
| Age 70-74 * Hm40 * H index | 0.256 (0.156) | -12.78 (13.52) | ||
| Age 60-64 * F index | -0.591 (0.267)* | -4.773 (6.977) | 0.199 (0.151) | -3.550 (4.741) |
| Age 65-69 * F index | -1.123 (0.355)** | 0.667 (2.622) | 0.276 (0.177) | -4.918 (6.310) |
| Age 70-74 * F index | -0.258 (0.408) | 4.447 (5.520) | 0.275 (0.179) | -4.411 (5.580) |
| Age 60-64 * H3040 * F index | -0.283 (0.338) | 6.348 (9.350) | ||
| Age 65-69 * H3040 * F index | 0.676 (0.409) | -0.734 (3.282) | ||
| Age 70-74 * H3040 * F index | 0.021 (0.441) | -6.343 (7.892) | ||
| Age 60-64 * Hm40 * F index | 0.574 (0.288)* | 3.026 (4.906) | ||
| Age 65-69 * Hm40 * F index | 1.077 (0.357)** | 0.278 (2.974) | ||
| Age 70-74 * Hm40 * F index | 0.0816 (0.441) | -5.333 (6.935) | ||
| Age 60-64 * E index | 0.134 (0.114) | 0.315 (1.406) | 0.0218 (0.150) | -3.413 (6.438) |
| Age 65-69 * E index | 0.108 (0.0977) | -0.961 (1.950) | 0.00228 (0.0166) | -1.453 (3.048) |
| Age 70-74* E index | -0.0431 (0.0937) | 2.248 (3.877) | 0.00291 (0.0207) | -1.469 (3.050) |
| Age 60-64 * H3040 * E index | -0.0349 (0.0794) | 0.0960 (1.836) | ||
| Age 65-69 * H3040 * E index | 0.0571 (0.107) | -0.281 (1.917) | ||
| Age 70-74 * H3040 * E index | 0.0978 (0.129) | -1.890 (3.602) | ||
| Age 60-64 * Hm40 * E index | -0.196 (0.163) | 2.041 (3.660) | ||
| Age 65-69 * Hm40 * E index | -0.158 (0.135) | 2.990 (4.880) | ||
| Age 70-74 * Hm40 * E index | -0.00848 (0.0952) | -1.133 (2.677) | ||
| Memory (word recall) | 0.129 (0.137) | -0.218 (0.122) | -0.872 (1.038) | -0.762 (0.891) |
| ADL limitations (any) | -6.325 (2.875)* | 1.323 (0.734) | 1.352 (2.414) | -0.780 (1.153) |
| Grip strength | -0.0618 (0.0489) | -0.0905 (0.0404)* | 0.0481 (0.102) | -0.0347 (0.0566) |
| Working spouse | -0.0918 (0.126) | 2.533 (3.487) | 0.927 (0.920) | 1.370 (1.986) |
| Providing care | -0.159 (0.228) | -1.773 (2.796) | -0.819 (0.562) | -1.384 (1.850) |
| Column | 1 | 2 | 3 | 4 |
| Working Hours in 2007 > 0 | Working Hours in 2007 = 0 | |||
| Retirement in 2009 | Working hours in 2009 | Retirement in 2009 | Working hours in 2009 | |
| No child | 1.883 (0.535)*** | -2.920 (5.221) | -0.783 (1.670) | -3.465 (6.541) |
| Minimum child age | 0.0594 (0.0186)** | 0.0760 (0.123) | -0.0521 (0.0499) | -0.131 (0.200) |
| Education_middle | 1.993 (1.419) | 2.706 (3.942) | -16.28 (117.7) | -2.279 (5.561) |
| EPI/MAI beneficiaries | -1.126 (1.052) | -5.819 (9.023) | -3.620 (27.15) | -1.572 (3.138) |
| Asset_m3500 | -1.379 (1.382) | -3.143 (5.088) | 14.36 (104.7) | 2.844 (6.771) |
| (Asset ≥ 35 million yen) | ||||
| Asset_15003500 | -1.126 (1.244) | -2.095 (3.658) | 11.95 (87.75) | 1.538 (3.804) |
| (15 ≤ Asset < 35 million yen) | ||||
| Asset_1001500 | 1.018 (1.145) | -1.923 (3.523) | 0.0979 (8.954) | -0.763 (2.258) |
| (1 ≤ Asset < 15 million yen) | ||||
| Number of observations | 847 | 793 | 367 | 361 |
| R-squared | 0.188 | 0.295 | 0.187 | 0.21 |
NOTE: Robust standard errors in parentheses. * denotes p < 0.1; ** p < 0.05; *** p < 0.01.
SOURCE: Data from JSTAR (2007).
or equal to 40 hour per week, for males in their 50s, 60-64, 65-69, and 70 and older. The first column in Table 8-3 summarizes the regression results that we use to predict retirement rates in 2009 by age and hours-worked group below. As described in Table 8-1, those who retired in 2007 remain retired with high probability if they are aged 60 and older. When males work at all, the probability of retiring in two years is significantly less; it is one-quarter without much difference across age groups when they are working less than 30 hours per week. For males who worked 30-40 hours per week, there are differences across age groups. Those who are in their 50s have low probability (5% or less) of retirement in 2009 once they worked at least 30 hours. Interestingly, those who are in their 70s also have low probability of retirement two years later (close to 0%) once they worked 30 hours but below 40 hours per week. While the point estimate of the retirement probability in 2009 goes up for this age group when they worked 40 hours or more per week, the coefficient is not statistically significant (see Table 8-3). On the other hand, the retirement probability does not seem to differ depending on the working hours once they worked for males in their 60s; the retirement probability remains around 10-20%.
This suggests that for those who retire in their 60s, about two-thirds retire via reduced hours, whereas people who are working in their 70s retire mostly after reducing working hours.
Figures 8-5a and 8-5b examine the effects of health, socioeconomic, and family factors on the retirement probability for males. Figure 8-5a shows males whose indices are all above the median values, while Figure 8-5b shows males whose indices are all below the median values. In our construction, the health index is normalized by the CES-D measure so that the health index takes on a higher value when health variables move in the direction indicated by the coefficients in the way analogous to lower the CES-D measure. Similarly, the family index takes on higher value when a variable in the index times its coefficient moves in the same direction as being married, and the socioeconomic index takes on higher value when a variable in the index times its coefficient moves in the same direction as having longer years of education.
For those who retired in 2007, there is no statistically significant difference between the two figures, as discussed earlier, although visually there are some differences. But there is a large and statistically significant difference shown in Figures 8-5a and 8-5b across age groups when they worked in 2007. First, the probability to retire for males in their 50s who work less than 30 hours per week is not affected very much by the three indices, but for those who work 30-40 hours, the probability to retire declines to zero. For those who work more than 40 hours in the higher index values, the probability to retire increases, and for those who work for more than 40 hours in the lower index values, the probability slightly declines to less
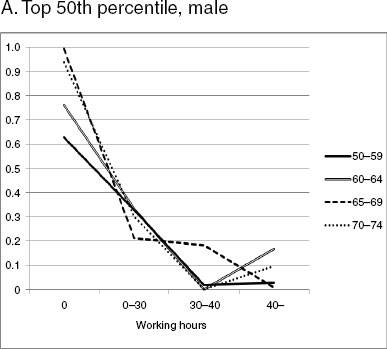
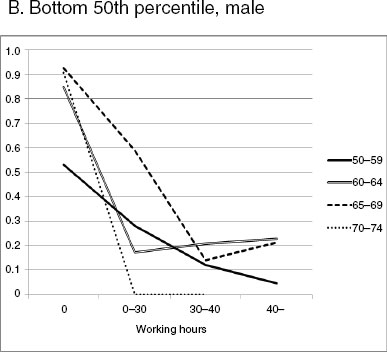
FIGURE 8-5 Predicted retirement rate (male).
SOURCE: Data from JSTAR (2007).
than 10%. Males in their 70s have a similar tendency, though the decline of retirement probability is larger in the lower percentile.
Second, the largest difference is observed for males aged 65-69. Males in this age category who have higher index values retire with much lower probability compared to those who have lower index values (21% versus 59% when they work less than 30 hours and about 0% versus 21% when they work more than 40 hours). The effect of the higher family index is opposite for this age group compared to males in their 50s. Overall, the only index that affects the retirement decision in 2009 is the family index. The health and the socioeconomic indices do not seem to affect the retirement decision with statistical significance.
On the other hand, the health index affected the working hours decision in 2009. The CES-D measure used to normalize the index and the grip strength are statistically significant variables in the health index. This can be seen in the second column of Table 8-3 reporting the results from Regression 3, which we use to predict working hours in 2009 by age and hours-worked group below. First, one can see a clear difference between the age groups. Except for males in their 50s and 70s, on average, working hours seem to be declining. Second, the working hours of males in their 50s rebound from 0 to about 10 hours, but males above 60 seem to stay constant at around 0.
The effect of health index values can be seen clearly in Figures 8-6a and 8-6b. These figures are analogously constructed with Figures 8-5a and 8-5b, except that the vertical axis is the predicted hours worked instead of the predicted retirement probability. For males in their 50s, the predicted working hours for those with the low index values and who worked less than 30 hours per week is about 14 hours per week, whereas for those with high index values, it is more than 34 hours per week. This amount does not differ much from those who worked longer hours per week in 2007. Analogous results hold for those in their 70s. Those with lower index values are predicted to work less hours in 2009 compared to their working hours in 2007, but those with higher index values are predicted to keep working around the same hours per week with the hours worked per week in 2007. Compared with males in their 50s and 70s, the difference between high and low index values are much smaller for males in their 60s.
Table 8-4 reports the estimated coefficients for females in Regressions 1-3. The third column reports the result of Regression 2, which explores the factors affecting probability of retirement in 2009 given the respondent reported being retired in 2007. The result indicates that those in their 50s with a lower health index and higher family index retire with higher probability. The effects of the indices are opposite for females above 70. Those who have a higher health index value and lower family index value retire with higher probability. However, the effect is not so
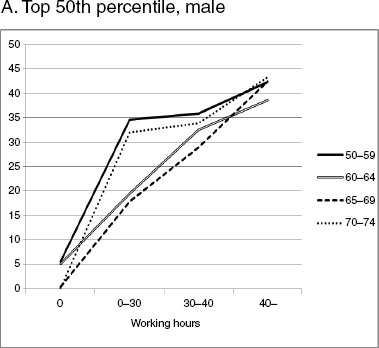
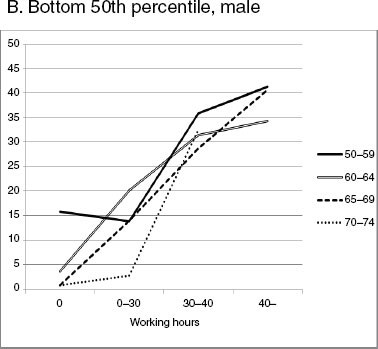
FIGURE 8-6 Predicted working hours (male).
SOURCE: Data from JSTAR (2007).
TABLE 8-4 Female Estimation
| Column | 1 | 2 | 3 | 4 |
| Working Hours in 2007 > 0 | Working Hours in 2007 = 0 | |||
| Retirement in 2009 | Working hours in 2009 | Retirement in 2009 | Working hours in 2009 | |
| Constant | -0.127 (0.135) | 15.42 (11.95) | 0.832 (0.150)*** | 1.378 (3.919) |
| H index (health index) | -0.0686 (0.0760) | -0.0300 (0.261) | -0.152 (0.0692)* | 3.800 (1.804)* |
| F index (family index) | -0.155 (0.0915) | 0.0012 (0.00038)** | 0.0986 (0.0494)* | -1.932 (1.473) |
| E index (economic index) | 0.203 (0.0937)* | -0.362 (2.063) | -0.0264 (0.0350) | 3.213 (1.902) |
| Age 60-64 | -0.0765 (0.226) | -19.48 (16.85) | -0.242 (0.227) | 6.538 (5.137) |
| Age 65-69 | -0.151 (0.271) | 2.211 (23.79) | -0.0950 (0.188) | 2.894 (4.231) |
| Age 70-74 | 1.090 (0.494)* | 13.35 (39.75) | 0.194 (0.175) | -1.931 (4.141) |
| H3040 (30 ≤ working hours ≤ 40) | 0.0699 (0.139) | 19.43 (16.55) | ||
| Hm40 (40 < working hours) | 0.241 (0.163) | 41.63 (15.45)** | ||
| Age 60-64 * H3040 | 0.680 (0.718) | -35.55 (24.46) | ||
| Age 65-69 * H3040 | 0.708 (0.554) | -0.677 (34.49) | ||
| Age 70-74 * H3040 | 0.201 (0.520) | 6.217 (203.9) | ||
| Age 60-64 * Hm40 | -0.0415 (0.279) | 40.96 (25.97) | ||
| Age 65-69 * Hm40 | 0.486 (0.457) | 124.4 (50.22)* | ||
| Age 70-74 * Hm40 | 2.027 (1.937) | -0.246 (68.71) | ||
| H3040 * H index | -0.104 (0.0979) | 0.110 (0.908) | ||
| Hm40 * H index | 0.143 (0.106) | 0.164 (1.346) | ||
| H3040 * F index | 0.0871 (0.0784) | -0.0021 (0.00052)*** | ||
| Hm40 * F index | 0.164 (0.0992) | -0.00029 (0.00051) | ||
| H3040 * E index | -0.179 (0.119) | 2.263 (3.409) | ||
| Hm40 * E index | -0.232 (0.104)* | 6.036 (4.156) | ||
| Age 60-64 * H index | 0.0880 (0.155) | -0.146 (1.208) | 0.0397 (0.0735) | -2.355 (1.720) |
| Age 65-69 * H index | 0.121 (0.200) | 0.0352 (0.352) | 0.133 (0.0731) | -3.691 (1.868)* |
| Age 70-74 * H index | 0.101 (0.274) | -0.0228 (0.298) | 0.160 (0.0708)* | -3.880 (1.820)* |
| Column | 1 | 2 | 3 | 4 |
| Working Hours in 2007 > 0 | Working Hours in 2007 = 0 | |||
| Retirement in 2009 | Working hours in 2009 | Retirement in 2009 | Working hours in 2009 | |
| Age 60-64 * H3040 * H index | 0.992 (0.217)*** | -0.191 (1.586) | ||
| Age 65-69 * H3040 * H index | -0.111 (0.290) | -0.128 (1.088) | ||
| Age 70-74 * H3040 * H index | -0.536 (0.916) | -1.661 (14.32) | ||
| Age 60-64 * Hm40 * H index | -0.306 (0.183) | 0.351 (2.895) | ||
| Age 65-69 * Hm40 * H index | -0.351 (0.250) | 0.868 (7.111) | ||
| Age 70-74 * Hm40 * H index | 3.364 (4.901) | 0.162 (1.421) | ||
| Age 60-64 * F index | -0.0486 (0.0874) | -0.00118 (0.000790) | 0.107 (0.0809) | -1.967 (2.063) |
| Age 65-69 * F index | -0.0666 (0.106) | -0.000843 (0.000607) | -0.0350 (0.0675) | 0.492 (1.756) |
| Age 70-74 * F index | 0.412 (0.201)* | 0.000677 (0.00156) | -0.118 (0.0591)* | 2.352 (1.541) |
| Age 60-64 * H3040 * F index | 0.155 (0.168) | -0.000351 (0.00104) | ||
| Age 65-69 * H3040 * F index | 0.297 (0.211) | 0.00322 (0.00107)** | ||
| Age 70-74 * H3040 * F index | 0.101 (0.139) | 0.0154 (0.00980) | ||
| Age 60-64 * Hm40 * F index | 0.00244 (0.107) | 0.000448 (0.00111) | ||
| Age 65-69 * Hm40 * F index | 0.216 (0.175) | 0.00557 (0.00117)*** | ||
| Age 70-74 * Hm40 * F index | 0.109 (0.229) | 0.0000363 (0.00284) | ||
| Age 60-64 * E index | -0.402 (0.143)** | -0.535 (4.415) | 0.0130 (0.0393) | -3.557 (2.214) |
| Age 65-69 * E index | -0.486 (0.182)** | -1.098 (3.296) | 0.0907 (0.0601) | -4.406 (2.335) |
| Age 70-74* E index | 0.0933 (0.225) | -2.259 (6.260) | 0.0138 (0.0321) | -3.152 (1.905) |
| Age 60-64 * H3040 * E index | 0.150 (0.215) | 5.103 (6.339) | ||
| Age 65-69 * H3040 * E index | -0.0508 (0.451) | -0.108 (6.097) | ||
| Age 70-74 * H3040 * E index | -1.016 (1.169) | 98.69 ( . ) | ||
| Age 60-64 * Hm40 * E index | 0.318 (0.168) | 4.908 (6.874) | ||
| Age 65-69 * Hm40 * E index | 0.507 (0.204)* | 5.825 (8.722) | ||
| Age 70-74 * Hm40 * E index | -1.645 (1.407) | -15.97 (11.82) | ||
| Memory (word recall) | -0.0411 (0.0410) | -4.481 (36.74) | -0.0773 (0.0742) | -0.0970 (0.0797) |
| ADL limitations (any) | 0.372 (0.347) | 16.65 (142.0) | -1.339 (0.412)** | -1.505 (0.584)* |
| Grip strength | -0.0111 (0.0106) | -4.062 (33.36) | 0.0454 (0.0327) | 0.0436 (0.0340) |
| Working spouse | -1.266 (0.398)** | 7283.6 ( . ) | -0.409 (0.228) | -0.196 (0.251) |
| Providing care | 1.131 (0.546)* | 1021.3 (848.5) | 0.280 (0.174) | 0.233 (0.165) |
| No child | -1.706 (1.254) | -6020.0 (4603.5) | 1.831 (0.929)* | 1.361 (1.055) |
| Minimum child age | -0.0749 (0.0402) | -308.3 (126.2)* | 0.0411 (0.0251) | 0.0332 (0.0273) |
| Education_middle | -0.143 (0.134) | 0.775 (0.370)* | -0.665 (0.946) | 0.0551 (0.376) |
| EPI/MAI beneficiaries | -0.220 (0.194) | -0.145 (0.368) | 0.133 (0.608) | 0.552 (0.463) |
| Asset_m3500 | -0.194 (0.170) | -0.829 (0.588) | 1.487 (1.505) | 0.176 (0.517) |
| (Asset Ͱ≤; 35 million yen) | ||||
| Asset_15003500 | 0.0916 (0.243) | -1.452 (0.939) | 1.327 (1.251) | 0.109 (0.404) |
| (15 ≤ Asset < 35 million yen) | ||||
| Asset_1001500 | 0.196 (0.212) | 0.543 (0.604) | 1.635 (1.346) | 0.370 (0.526) |
| (1 ≤ Asset < 15 million yen) | ||||
| Number of observations | 526 | 500 | 690 | 680 |
| R-squared | 0.190 | 0.428 | 0.113 | 0.119 |
NOTE: Robust standard errors in parentheses. * denotes p < 0.1; ** p < 0.05; *** p < 0.01
SOURCE: Data from JSTAR (2007).
large, as almost everyone stays retired with high probability in any case as seen in Figures 8-7a and 8-7b for working hours set at 0 (discussed below).
For females who worked in 2007, we examine the retirement decision in the same way we did for males using Regression 1. The results are reported in Table 8-4’s first column, which we use to predict retirement rates in 2009 by age and hours-worked group below. When females work at all, the probability of retiring in two years is significantly less; it is less than 28% (slightly higher than males’ 26%), and there is not much difference across different age groups when they are working less than 30 hours per week. The probability of retirement in 2009 is around 20 to 28%, the same as males’ results. However, there is a significant difference across index values. For females, socioeconomic variables affect the retirement decision in a statistically significant way.
Comparing Figures 8-7a and 8-7b, females in their 50s on average are not affected much by the index value. Regardless of the index value, they retire with about 20% probability when they work less than 30 hours per week but retire with about 10% probability when they work more. Those who are above 70 with a higher index value retire with much higher probability, at 55% when they work less than 30 hours. In contrast, for those with a lower index value, the probability of retirement declines to close to zero for females who work at all.
On the other hand, females in their 60s who work less than 30 hours per week retire with less probability when their indices values are high (around 0%) compared to those who have lower indices values, at around (40 to 50%). The difference is still large for the 60-64 age group when females work between 30 to 40 hours per week (about 5% versus 40%).
Turning to the working hours decision in 2009, the health index affected for males, but the family index affected for females. The marital status variable and the minimum child’s age (higher age implies less index value) are the statistically significant variables in the family index. This can be seen in the second column of Table 8-4. It reports results from Regression 3, which we use to predict working hours in 2009 by age and hours-worked group in Figures 8-8a and 8-8b. First, unlike males, one cannot see a clear difference between the age groups. Second, all groups seem to be predicted to work less in 2009 than the hours worked per week in 2007. Third, it is observed that females with higher indices values work more hours if they are in their 50s or 60s.
CONCLUSION
We have examined the transition of work status and working hours for Japanese males and females who were between ages 50-75 in 2007 using the JSTAR data. Here we summarize our findings.
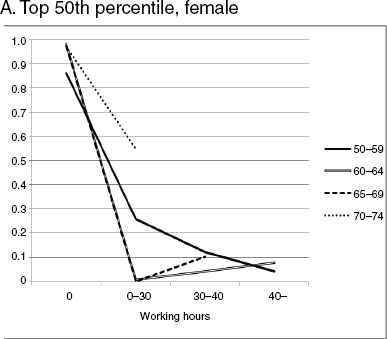
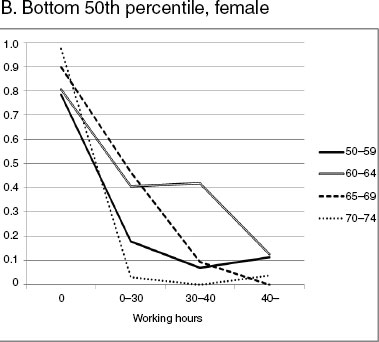
FIGURE 8-7 Predicted retirement rate (female).
SOURCE: Data from JSTAR (2007).
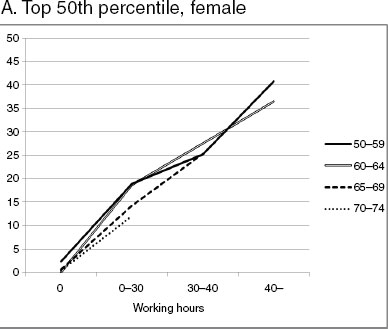
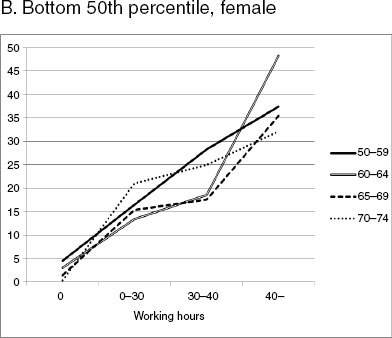
FIGURE 8-8 Predicted working hours (female).
SOURCE: Data from JSTAR (2007).
For males and females, we find strong evidence that those who retire stay retired two years later once they are aged 60 and older for males and for females in general. This decision does not seem to be affected much by the health, family, and socioeconomic indices, although there are statistically significant indices for females. Males in their 50s, on the other hand, do seem to come back to work to some extent. Interestingly, among this age group, it is the unhealthy who are predicted to work longer hours two years later (16 hours per week versus 6 hours per week).
For males and females who were not retired in 2007, retirement probabilities are predicted to be between 20-28% when the three indices are evaluated at the mean values. However, the retirement decisions of males and females seem to be affected by different factors. The important index affecting males’ retirement decisions seems to be the family index, whereas the socioeconomic index affects in a statistically significant way the retirement decision for females. Although the sources and the magnitude of the effect of the indices are different, the direction of the effects is the same across males and females. For both males and females, those who are in their 60s retire with lower probability when they have a higher index. The largest effects are observed among males who are aged 65 and older when they work less than 30 hours, females who are aged 60 and older when they work less than 30 hours, and females aged 60-64 when they work between 30-40 hours per week.
In terms of hours worked, the Regression 3 results for males and females show that males and females with a lower index tend to reduce hours worked more quickly than those with a higher index. Overall, higher-index males seem to keep working at current working hours longer than their lower index values counterparts. If their working hours are reduced to 30 hours or less per week when they are in their 50s or above 70, higher index value persons retire with higher probability than those with lower index values. If they reach 30 working hours or less per week when they are in their 60s, they tend to stay in the labor market longer if they have lower index values.
The pattern we have described above is of course tentative to the extent we have assumed stationarity of behavior across different cohorts. To what extent this assumption holds up needs to be examined using longer panel data.
We also need to examine to what extent the pattern described depends on current institutional arrangements. In order to examine this, we need to find some variations in data that can be regarded equivalent to institutional changes.
REFERENCES
Arellano, M., and C. Meghir. (1992). Female labour supply and on-the-job search: An empirical model estimated using complementary data sets. Review of Economic Studies 59(3):537-559.
Banks, J., and S. Smith. (2006). Retirement in the UK. Oxford Review of Economic Policy 22(1):40-56.
Gustman, A., and T. Steinmeier. (2009). Integrating Retirement Models. NBER Working Paper #15607. Cambridge, MA: National Bureau of Economic Research.
Ichimura, H., H. Hashimoto, and S. Shimizutani. (2009). JSTAR First Results: 2009 Report. RIETI Discussion Paper Series #09-E-047, Research Institute on Economy, Trade and Industry. Project on Intergenerational Equity and Center for Intergenerational Studies, Hitotsubashi University, Discussion Paper #443-447. Available: http://www.rieti.go.jp/jp/publications/dp/09e047.pdf.
Japanese Study on Aging and Retirement. (2007). Research Institute of Economy, Trade and Industry. Available: http://www.rieti.go.jp/en/projects/jstar/index.html.
Lazear, E. (1986). Retirement from the labor force. Pp. 305-355 (Chapter 5) in Handbook of Labor Economics, Volume 1, O.C. Ashenfelter and R. Layard (Eds.). Amsterdam: Elsevier.
Lumsdaine, R., and O.S. Mitchell. (1999). New developments in the economic analysis of retirement. Pp. 3,261-3,307 (Chapter 49) in Handbook of Labor Economics, Volume 3C, O.C. Ashenfelter and D. Card (Eds.). Amsterdam: Elsevier.
Organisation for Economic Co-operation and Development). (2008). Ageing and Employment Policies—Statistics on Average Effective Age of Retirement. Paris: Organisation for Economic Co-operation and Development.
Oshio, T., and S. Shimizutani. (2011). Disability Pension Program and Labor Force Participation in Japan: A Historical Perspective. NBER Working Paper #17052. Cambridge, MA: National Bureau of Economic Research.
Oshio, T., A. Oishi, and S. Shimizutani. (2011). Social security reforms and labor force participation of the elderly in Japan. Japanese Economic Review 62(2):248-271.
Rust, J. (1989). Dynamic programming model of retirement behavior. Pp. 359-398 in The Economics of Aging, D. Wise (Ed). Chicago: University of Chicago Press.
Shimizutani, S. (2011). A new anatomy of the retirement process in Japan. Japan and the World Economy 23(3):141-152.
Shimizutani, S., and T. Oshio. (2011). Claiming Behavior of Public Pension Benefits: New Evidence from Japanese Study on Aging and Retirement (JSTAR). Mimeograph.


