
Household Dynamics and Living Arrangements of the Elderly in Indonesia: Evidence from a Longitudinal Survey1
Like many other developing countries in Asia, Indonesia is experiencing rapid population aging (Kinsella and He, 2009). The average number of children born per women has declined from around 4 in the early 1980s to around 2.5 in 2000, while life expectancy has increased from around 56 to 68 during the same period. In 2005, the percentage of those aged 60 and older was around 7.5% of the total population. While this is a lower percentage than, for instance, Singapore or even Thailand, it still amounts to 16 million people, given Indonesia’s population size (Ananta and Arifin, 2009). One of the consequences of these demographic changes over the past few decades is that families are smaller and the number of children from whom parents can draw support at a later age also becomes smaller. This is particularly important in Indonesia and in other developing countries in the region, where social programs and pension schemes to support the elderly are lacking.2 In Indonesia, as
____________
1 I gratefully acknowledge the financial support of the World Bank’s Research Support Budget (RF-P121879-RESE-BBRSB). Earlier results of the paper were presented at the Conference on Policy Research and Data Needs to Meet the Challenges and Opportunities of Population Aging in Asia, New Delhi, March 14-15, 2011. All errors are mine. These are the views of the author and should not be attributed to the World Bank and its member countries.
2 See Abikusno (2009) for a discussion on past and recent laws and government policies related to older persons in Indonesia. Although 1966-1998 saw few policies that addressed aging issues, the recognition of the issues and waves of reforms in 1998 brought about laws and policies that are seen to be more favorable to older persons (including one on pension). In 2004, a law on the comprehensive national security system was passed that contains articles written to protect the pension sector.
in other developing countries in the region, support for the elderly has primarily come from networks of families or relatives, with remittances from children living elsewhere and shared residence being the two most important mechanisms.
In addition to demographic pressure, there have also been concerns that pressure from “modernization” would weaken traditional family structures. Moreover, as the population ages, Indonesia is experiencing nutrition and health transitions with the population moving out of undernutrition and communicable diseases and the elderly population increasingly exposed to higher risk factors correlated with chronic health problems (Witoelar, Strauss, and Sikoki, 2009). In Indonesia, early concerns about the implications of population aging, rapid economic changes, and changing health challenges on traditional familial support systems and family structures have been brought up by Hugo (1992) and by Wirakartakusumah et al. (1997). Despite these concerns, a number of empirical studies on aging and living arrangements in Southeast Asia done in the late 1990s suggest that shared living remains common and the decline in co-residency was modest, as was reviewed by Frankenberg, Chan, and Ofstedal (2002) and by Beard and Kunharibowo (2001). One of the aims of this chapter is to revisit the question and see how much the pattern of living arrangements among the elderly has changed.
Data from the National Socioeconomic Survey (the Susenas), the nationally representative survey of households conducted annually in Indonesia, indeed show that the living arrangements among the elderly had not changed considerably between 1993 and 2007. Figures 10-1 and 10-2 show living arrangements by age in 1993 and 2007 for men and women aged 55 and older, respectively. The figures show that, like in many countries in Asia, most older adults in Indonesia co-reside with at least one of their children. There are differences in the living arrangement patterns between males and females, as will be discussed later in this chapter. Overall, the patterns do not seem to have changed over the years. (Similar patterns emerge when we use data from other years of the Susenas between 1993 and 2007.) These figures seem to still be consistent with what some previous studies have found on the patterns of living arrangements of the elderly in Southeast Asia. Frankenberg, Chan, and Ofstedal (2002) found that in Indonesia, Singapore, and Taiwan, the pattern of living arrangements is relatively stable, at least throughout the 1990s.
It is important to note, however, that the Susenas is not particularly well suited for analysis of this kind. First, one could only identify relationships in the household relative to the household head. Second, only limited socioeconomic characteristics were collected. Third and perhaps most importantly, the survey does not collect any information on nonco-resident family members. In addition, cross-sectional analysis may
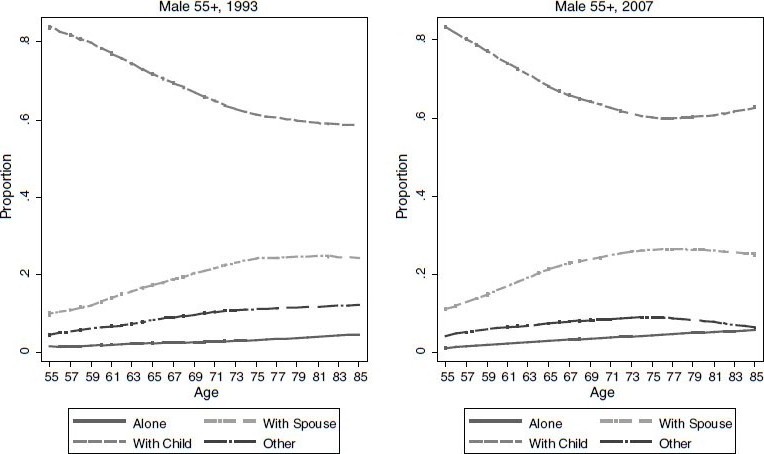
FIGURE 10-1 Living arrangements of males aged 55 and older.
SOURCE: Data from National Socioeconomic Survey (Susenas), 1993 and 2007.
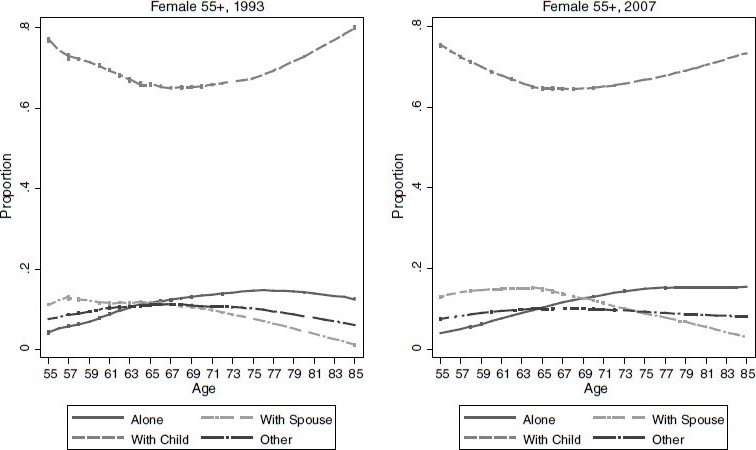
FIGURE 10-2 Living arrangements of females aged 55 and older.
SOURCE: Data from National Socioeconomic Survey (Susenas), 1993 and 2007.
mask what has really been happening to elderly living arrangements over the 14-year period. For example, studies have shown that in the wake of the Asian financial crisis in 1997-1999, one of the mechanisms used to cope with the crisis was to combine households (Frankenberg, Smith, and Thomas, 2003). Such episodes highlight the reality that co-residency and parental home-leaving are not merely lifecycle events.
The Indonesia Family Life Survey (IFLS), a longitudinal household survey that spans 1993 to 2007, does not have these limitations. The four rounds of the survey follow individuals over 14 years. Since the first round of the survey, household rosters listing all household members were completed. In addition to documenting the relationship of household members to the head, the roster also contains information that enables the researcher to link children to their biological parents. Rich information about households and individuals were collected, including socioeconomic variables, such as education, consumption, income, and labor market outcomes, as well as health. In addition, the survey also collects information of nonco-resident family members.3
This chapter is descriptive in nature, and its main objectives are straightforward. First, I want to document the pattern of living arrangements of the population aged 55 and older, by gender, over the survey years and see whether there have been significant changes over the 14 years. Second, I want to look at key socioeconomic characteristics that we hypothesize to be correlated with living arrangements. I first look at cross-section correlations between the covariates and living arrangements in the base year 1993 for those aged 55 and older. I also want to know whether relationships that existed in cross-sectional analysis hold in the longitudinal analysis. I use these baseline characteristics and study their correlations with living arrangements 14 years later.
The chapter is organized as follows. The next section will discuss the data and the key socioeconomic variables that we use in the analysis. I then document the living arrangements of individuals aged 55 and older in each of the survey years—1993, 1997, 2000, and 2007—as if they were independent cross-sections. Next, I employ a multivariate framework to look at cross-sectional correlations in the base year of 1993. Finally, I use the longitudinal sample of individuals to look at correlations between those key variables at the baseline year (1993) and living arrangements 14 years later under both the linear probability models (LPM) and multinomial logit (MNL) models.
____________
3 See Strauss et al. (2009a) for the overview of the IFLS Wave 4
DATA AND METHODOLOGYM
Data
The Indonesia Family Life Survey is a large-scale, broad-based longitudinal survey of households, individuals, and communities with detailed questions on a vast number of socioeconomic characteristics of the respondents. As noted above, the survey has been fielded four times (1993, 1997, 2000, 2007), covering a span of 14 years. The survey collects detailed questions about household membership, including questions about non-coresident family members, which is crucial for studies that aim to look at issues related to changing household structure and living arrangements. While the IFLS was not originally designed to specifically study aging and its consequences, it was expanded in the last round (IFLS4 2007) to include questions related to aging. The questions added were specifically chosen to be comparable to questions being asked in surveys on aging around the world, such as the Health and Retirement Study (HRS) in the United States; Survey of Health, Ageing and Retirement in Europe (SHARE), Korean Longitudinal Study of Ageing in South Korea (KLoSA), China Health and Retirement Longitudinal Study (CHARLS) in China, and the new Longitudinal Aging Study in India (LASI). IFLS4 has the advantage of having detailed information of the now “elderly” respondents when they were younger.
In this chapter, when the focus is on cross-sectional relationships between living arrangements of the elderly and household as well as individual covariates, I will restrict the sample on those aged 55 and older during the time of the survey (1993, 1997, 2000, and 2007), and the attention will be restricted to those who have at least one living child. In the longitudinal part of the analysis, where the focus is on the relationships between living arrangements in 2007 with covariates in the baseline year, 1993, we will restrict the sample to those who were 55 and older in 2007. The covariates come from 1993, when the individuals were 41 and older. One reason to look at the sample of those who were 55 and older in 2007, rather than focusing on those who were 55 and older in 1993 and see what happened 14 years later, is that I will not have to worry as much about mortality selection. Also, defining the sample in this way allows us to work with a significantly larger sample (around 3,800 individuals) as opposed to using the sample consisting of individuals 55 years and older who were also interviewed in 1993.
As in any longitudinal household survey, attrition becomes a concern, especially for a survey that spans over long period of time. IFLS has maintained a relatively low attrition rate, with around 90% of IFLS1 households and around 80% of IFLS1 household members re-contacted in
IFLS4. The low attrition rate was not due to low mobility; in fact, almost one-third of those interviewed in 1993 had moved by 2007. However, the survey managed to lower the attrition rate by tracking down some of the movers (see Thomas et al., forthcoming). For the older age group, the main cause of attrition is death. Of the household members aged 40 to 80 in 1993 (the main sample in this paper), the re-contact rate in 2007 was 95% with the following breakdown: around 70% were found, 25% had died, and 5% were not found (see Table 2.5 in Strauss et al., 2009b). To address this concern, I employ attrition-corrected person-weights when I look at living arrangement patterns in Tables 10-1 and 10-2.
Methodology
As the framework for this analysis, I considered four types of mutually exclusive and exhaustive living arrangements: (1) elderly living alone, where the household does not contain anyone but elderly; (2) elderly living with a spouse, where the household consists of only the elderly person and the spouse (who may or may not be elderly); (3) elderly living with at least one adult child, when the household contains at least one adult child of the elderly;4 and (4) other form of living arrangement, a residual category that includes households where the elderly live with siblings’ family, with immediate family of his/her children but not with any of one his/her children, and so forth.
The analysis focuses on adult children since one of main reasons one cares about co-residence is to look at elderly support. Only biological children are considered as children in the analysis. Therefore, an older adult who lives only with his/her daughter-in-law will not be categorized as living with a child, but will be indicated as living in the “other” category. An older adult who lives with a servant will be counted as living in the “other” category rather than “living alone.”
Multivariate Analysis
Using the sample of those aged 55 and older in 1993, I first look at cross-sectional correlations between individual characteristics and living arrangement using a simple linear probability model (LPM) with the dependent variable equal to 1 if the individual co-resided with at least one biological child in 1993. Still using the LPM and the 1993 covariates,
____________
4 Adult child here is defined as aged 15 and older. Note that as long as an adult child lives in the household, the elderly will be included in this category, including those who live with or without a spouse or with other people.
we then look at the probability of co-residence in 2007 for individuals who were aged 55 and older in 2007.
I follow the literature in this area by adopting a multinomial logit model of living arrangements. While there exist a large number of studies in the literature using this approach with cross-sectional data, the use of detailed panel data in this kind of analysis has so far been limited, especially for developing countries, due to the availability of the data. I set those living alone as the base group and then examine the relative risks of living only with a spouse, co-residing with a child, or living in another arrangement, as well as the marginal effects of changing one of the covariates. The usual assumption of the multinomial logit, the independence from irrelevant alternatives (IIA), applies. It implies that the relative probabilities for any of two available alternatives depend only on the attributes of those alternatives. In particular, it assumes that the unobservables in each alternative are not correlated with each other.
Covariates
In the multivariate analyses, I first put a focus on a limited number of variables at the baseline that are likely to have already been determined during the time of the survey. I use the individual’s own age, education, and the total number of surviving sons and daughters in the basic specification. For age, we use dummy variables indicating whether the individuals are aged 60-64, or 65 and older, with the group aged 55-59 being the omitted category. The non-linearity of the relationship between own age and living arrangements is apparent from the figures, which we want to capture in the multivariate context.
I created dummy variables indicating whether individuals have some primary education, completed primary education, or completed junior high school, using the group of those without schooling as the base category. The total number of living children at the time of the survey provides us with the potential number of sources of support for the elderly. I expect this variable to be positively correlated with co-residency. Here, it is crucial that I include not only children who are listed in the household rosters, but also other children living elsewhere.5
I use separate variables to indicate sons and daughters since anthropological literature on Indonesia suggests that gender is an important factor determining who will take care of the parents in old age, and it varies between ethnicities in Indonesia. I include a variable indicating
____________
5 Because of this requirement, I only include individuals aged 55 or older who were individually interviewed in 1993 since we only have information for these individuals regarding nonco-resident family members.
the age of the oldest child. In results not shown, I also include per capita expenditure—a proxy of income—as one of the covariates.6 Well-known studies from developed countries, such as the study by Costa (1997), have shown that income plays an important role enabling elderly to live alone. Privacy of both parents and children as a normal good has been modeled in studies of living arrangements in developed countries (see, for example, Ermisch, 1999). In the current study, the results show that per capita expenditure (pce) did not have statistically significant relationships with living arrangements of the elderly.
I then add information about the marital status of the elderly, and for those who are married, age of the spouse and the spouse’s education. In some specifications, I also consider several variables that we usually do not want to include as explanatory variables in cross-sectional analysis of living arrangements, such as information about labor participation of the individuals, their spouses, and their co-resident children. Employment decisions may very well be determined jointly with living arrangement decisions, although in Indonesia, Cameron and Cobb-Clark (2002) find little evidence that old-age support from children through financial transfer and co-residence affects the labor supply decisions of the elderly.
Finally, I use two variables measuring (subjectively) the health conditions of the individuals at the baseline year. First, I use self-assessment of basic physical functioning and Activities of Daily Living (ADLs). ADLs provide useful information about a person’s functional status and have been shown to be correlated with socioeconomic status (SES) measures (see, for instance, National Socioeconomic Survey, 1993, 2007). The second measure I use is General Health Status (GHS). In all four waves of IFLS, respondents were asked the question, “In general, how is your health?” with the following options: very healthy, somewhat healthy, somewhat unhealthy, and unhealthy. Those who answered somewhat unhealthy and unhealthy were coded to have poor health.
LIVING ARRANGEMENT PATTERNS
This section begins by going back to Figures 10-1 and 10-2 that show the patterns of living arrangement of adults aged 55 and older using the Susenas data from 1993 and 2007.7 The pattern that emerges from the fig-
____________
6 Per capita consumption is constructed from the household consumption expenditure module of IFLS, which reports the market expenditures as well as own production of households on food and nonfood items including on durable and nondurable goods.
7 Note that the Susenas does not separate biological and nonbiological children in categorizing relationship to the head of the households. The Susenas also does not separate parent and parent-in-law of the head of the households. Numbers used to create Figures 10-1 and 10-2 thus combine biological with non-biological children, parent with parent-in-law.
ures also shows, in contrast to women, as men age, they seem to rely less on their children but more on their spouses. For women, the likelihood of sharing residence with a child decreases with age before it increases again. At all ages, the percentage of men co-residing with a spouse is always higher than the percentage of those living alone or in other living arrangements. Figures created using other years of the Susenas between 1993 and 2007 (not shown) have a similar pattern. As mentioned, other than being available for every year, the Susenas is not well suited for this analysis.
Figures 10-3 and 10-4 use data from the IFLS1 and IFLS4 to look at living arrangements of IFLS respondents who are aged 55 and older.8 The majority of elderly men live with their adult child, and the age patterns do not seem to change between 1993 and 2007. The figures show, as in the Susenas data, a declining line describing the proportion of men aged 55 and older who live with at least a child by age, respectively. As they age, men are less likely to live with their adult children and more likely to live only with their spouses. From the figures alone, there does not seem to be a movement into co-residence as men age. The proportion living alone increases as men age, but it is well below 2% even for the oldest of the elderly.
The patterns for women show that in 1993, as in the Susenas, the proportion of elderly women living with a child decreases with age before increasing sharply at older age. For 2007, however, the U-shaped line is much less apparent. At the same time, the proportion of elderly women living alone increases with age. The U-shaped pattern is particularly interesting since the upturn suggests that as elderly women age they tend to move into shared living arrangements with their adult children, either by moving into the children’s households or by taking in the children who have left their households earlier. This pattern is consistent with the pattern of old-age support of elderly women by the children. Both for men and women, “other” living arrangements do not change with age.
Table 10-1 presents the distributions of living arrangements in each of the four waves of IFLS of individuals aged 55 and older. The table treats each wave of IFLS as if it were an independent, cross-sectional sample. The sample is weighted using cross-section person-weight that accounts for attrition.9 The table shows that living arrangement patterns seem to
____________
8 For the figures from IFLS to be comparable to the Susenas figures, biological and non-biological children are both included in the calculation. Parent and parent-in-law are also combined. In the analysis, however, only biological child and parent are used when we define parent-child shared living arrangement.
9 The estimates using the cross-sectional person-weights will be representative of the Indonesian population living in the IFLS provinces in 1993 (for IFLS1), 1997 (IFLS2), 2000 (IFLS3), and 2007 (IFLS4). See Strauss et al. (2009b) for a discussion of how the person-weights are constructed.
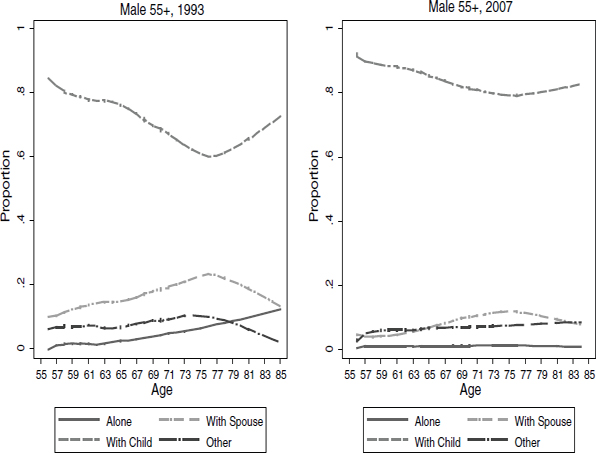

FIGURE 10-3 Living arrangements of males aged 55 and older.
SOURCE: Data from Indonesia Family Life Survey IFLS 1 and IFLS4.
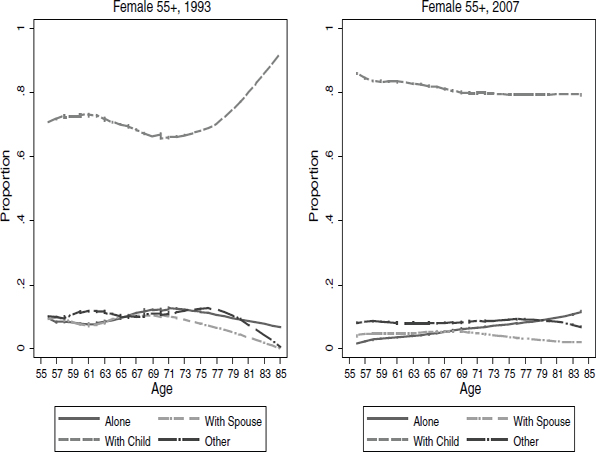

FIGURE 10-4 Living arrangements of females aged 55 and older.
SOURCE: Data from Indonesia Family Life Survey, IFLS 1 and IFLS4.
TABLE 10-1 Cross-Sectional Living Arrangement Patterns: 1993, 1997, 2000, and 2007 (IFLS)
| 55 + Older at Time of Survey | 1993 | 1997 | 2000 | 2007 | |
| Male | # of observations | 1,743 | 2,004 | 2,479 | 2,879 |
| % alone | 2.3 | 1.7 | 2.1 | 3.0 | |
| % with spouse | 16.0 | 17.1 | 14.1 | 19.5 | |
| % with ≥ 1 child | 70.3 | 68.9 | 72.4 | 66.2 | |
| % other | 11.4 | 12.3 | 11.9 | 12.4 | |
| Female | # of observations | 2,015 | 2,392 | 3,039 | 3,430 |
| % alone | 9.8 | 9.1 | 7.5 | 11.1 | |
| % with spouse | 9.7 | 10.6 | 8.8 | 12.5 | |
| % with ≥ 1 child | 60.8 | 63.2 | 66.6 | 61.4 | |
| % other | 19.6 | 16.9 | 17.5 | 15.9 | |
NOTE: The numbers were estimated using cross-sectional attrition-corrected person-weights for the corresponding year.
SOURCE: Author’s calculation based on data from Indonesia Family Life Survey—IFLS1, IFLS2, IFLS3, and IFLS4.
be relatively stable over the 14 years, with lower percentage of men living alone (around 3%) than women (7-10%), and the majority of the elderly living with at least one of their children. This seems to confirm the findings of previous studies that find modest if any decrease in co-residency. The table shows decreasing percentages of elderly living alone between 1993 and 2000, which then increased again in 2007. During the same period, co-residency with adult children increased and then decreased by 2007. Further study needs to be done to support this claim, but the pattern is consistent with the fact that during the period of economic crisis in 1997-1999 after the Asian financial crisis (which came right after a drought brought about by El Ni![]() o), one coping mechanism was to combine households (Frankenberg, Smith, and Thomas, 2003).
o), one coping mechanism was to combine households (Frankenberg, Smith, and Thomas, 2003).
Table 10-2 shows the marital status of the elderly and their living arrangements in 1993, 1997, 2000, and 2007, again weighted using the cross-sectional person-weights. It is clear that in each of the survey years, among those aged 55 and older, most of the men (close to 90%) are married while only around 40% women are. The table also shows that almost 90% of men who co-reside with an adult child are married; only a small fraction of men live with their adult children without their wives being present.
MULTIVARIATE ANALYSES
Tables 10-3a and 10-3b present the descriptive statistics of the analytical samples for the multivariate analyses: individuals aged 55 and older in
TABLE 10-2 Marital Status and Living Arrangements: 1993, 1997, 2000, and 2007
| Living Arrangements | |||||||||
| Living Alone | With Spouse Only | With an Adult Child | Other Living Arr. | All Living Arr. | |||||
|
Male Aged 55+ |
|||||||||
|
1993 |
|||||||||
|
Married |
11.8 | 99.9 | 93.4 | 93.0 | 92.5 | ||||
|
Divorced/separated |
72.5 | 0.1 | 6.1 | 4.1 | 6.3 | ||||
|
Never married |
15.7 | 0.0 | 13.7 | 23.1 | 52.6 | ||||
|
1997 |
|||||||||
|
Married |
2.7 | 100.0 | 90.7 | 89.9 | 90.7 | ||||
|
Divorced/separated |
68.6 | 0.0 | 8.8 | 6.7 | 8.0 | ||||
|
Never married |
28.7 | 0.0 | 0.4 | 3.3 | 1.4 | ||||
|
2000 |
|||||||||
|
Married |
10.1 | 100.0 | 88.8 | 88.4 | 88.8 | ||||
|
Divorced/separated |
60.6 | 0.0 | 10.3 | 6.0 | 9.1 | ||||
|
Never married |
29.2 | 0.0 | 0.9 | 5.7 | 2.1 | ||||
|
2007 |
|||||||||
|
Married |
16.3 | 100.0 | 86.9 | 83.8 | 87.0 | ||||
|
Divorced/separated |
65.1 | 0.0 | 11.9 | 11.6 | 11.0 | ||||
|
Never married |
18.6 | 0.0 | 1.2 | 4.6 | 2.0 | ||||
|
Female Aged 55+ |
|||||||||
|
1993 |
|||||||||
|
Married |
3.8 | 100.0 | 45.9 | 35.3 | 44.9 | ||||
|
Divorced/separated |
82.8 | 0.0 | 48.4 | 53.5 | 48.1 | ||||
|
Never married |
13.4 | 0.0 | 5.7 | 11.2 | 7.0 | ||||
|
1997 |
|||||||||
|
Married |
1.7 | 100.0 | 43.7 | 39.6 | 45.1 | ||||
|
Divorced/separated |
85.4 | 0.0 | 52.0 | 51.3 | 49.4 | ||||
|
Never married |
12.9 | 0.0 | 4.3 | 9.1 | 5.5 | ||||
|
2000 |
|||||||||
|
Married |
3.5 | 100.0 | 45.9 | 35.8 | 45.6 | ||||
|
Divorced/separated |
83.8 | 0.0 | 49.3 | 51.7 | 48.0 | ||||
|
Never married |
12.7 | 0.0 | 4.7 | 12.5 | 6.3 | ||||
|
2007 |
|||||||||
|
Married |
3.0 | 100.0 | 43.8 | 35.2 | 44.7 | ||||
|
Divorced/separated |
87.4 | 0.0 | 52.6 | 52.7 | 50.1 | ||||
|
Never married |
9.6 | 0.0 | 3.6 | 12.1 | 5.2 | ||||
NOTE: The numbers were estimated using cross-sectional attrition-corrected person-weights for the corresponding year.
SOURCE: Author’s calculation based on data from Indonesia Family Life Survey—IFLS1, IFLS2, IFLS3, and IFLS4.
TABLE 10-3a Analytical Sample: Living Arrangements in 1993 and 2007
| Male (N = 1,782) | Female (N = 2,016) | |||
| 1993 | 2007 | 1993 | 2007 | |
| Living Alone | 0.4 | 2.5 | 3.0 | 11.1 |
| Living with Spouse Only | 5.5 | 20.5 | 6.5 | 14.4 |
| Co-reside with an Adult Child | 68.7 | 65.1 | 75.2 | 63.8 |
| Other Living Arrangements | 25.4 | 11.9 | 15.4 | 10.7 |
SOURCE: Data from Indonesia Family Life Survey—IFLS1, IFLS2, IFLS3, and IFLS4.
2007 for whom we have data in 1993 and who have at least one surviving adult child. These restrictions bring down the number of eligible samples to around 3,800 observations. Table 10-3a shows the living arrangements in 1993 and 2000 of these individuals, and the Table 10-3b shows the 1993 covariates.
On average, the sample individuals were around 51 years old in 1993. Almost all of the men and most of the women were married in 1993, and on average they have around four surviving children. Most marriages in Indonesia are between older men and younger women, which are shown by the means of spouse’s age and also by the fact that the children of elderly women in the sample are older than that of men (14-31 years for women, 12-27 years for men). Higher incidence of poor GHS and ADL problems among women are consistent with recent findings on health of the elderly in Indonesia (Witoelar et al., 2009).
Cross-Sectional Relationships
Tables 10-4 and 10-5 show the cross-sectional relationships between the 1993 covariates and the probability of co-residing with an adult child in 1993 for elderly men and women, separately. The first columns of these tables include only variables that are more or less predetermined and exogenous to living arrangement. The next specifications then add some variables that are less exogenous, including those that are very likely to be determined jointly with living arrangements.
In Table 10-4, the negative coefficient on males aged 70 and older suggests that the decline in the proportion of elderly men who co-reside occurs at an older age when the men are likely to be more vulnerable. Own education seems to predict higher likelihood of co-residency and so does age of the oldest child. The number of living sons and daughters are positively correlated with higher probability of co-residency, unsurprisingly. However, as we add the variables that are related to having a
TABLE 10-3b Analytical Sample: Baseline Characteristics, 1993
| Male (N = 1,782) | Female (N = 2,016) | |||||||||
| Covariates (1993 variables) | Living Alone | With Spouse | With Adult Child | Other Living Arr. | All Males | Living Alone | With Spouse | With an Adult Child | Other Living Arr. | All Female |
| Own age (years) | 54.00 | 57.50 | 51.50 | 48.20 | 51.00 | 58.70 | 55.10 | 51.00 | 49.70 | 51.30 |
| Education (years) | 4.90 | 2.80 | 5.50 | 5.80 | 5.38 | 1.60 | 1.80 | 3.30 | 2.90 | 3.10 |
| # surviving children | 4.00 | 3.00 | 4.70 | 3.50 | 4.30 | 3.10 | 3.50 | 4.80 | 3.50 | 4.40 |
| # of sons | 2.40 | 1.40 | 2.40 | 1.70 | 2.15 | 1.50 | 1.90 | 2.40 | 1.70 | 2.30 |
| # of daughters | 1.60 | 1.50 | 2.30 | 1.80 | 2.15 | 1.60 | 1.70 | 2.30 | 1.80 | 2.20 |
| Age of oldest child (years) | 21.60 | 29.00 | 27.40 | 23.10 | 26.50 | 34.30 | 32.50 | 31.00 | 28.60 | 30.90 |
| Married = 1 | 0.71 | 1.00 | 0.98 | 0.99 | 0.98 | 0.07 | 1.00 | 0.78 | 0.70 | 0.78 |
| Spouse's age (years) | 0.00 | 51.30 | 43.90 | 38.60 | 42.80 | 0.00 | 61.80 | 42.10 | 41.40 | 42.00 |
| Spouse's education (years) | 0.00 | 1.96 | 3.74 | 4.22 | 3.75 | 0.00 | 2.67 | 3.90 | 3.40 | 3.63 |
| Max. yrs education of children (years) | 0.00 | 0.00 | 8.84 | 0.00 | 6.07 | 0.00 | 0.00 | 8.69 | 0.00 | 6.53 |
| Working = 1 | 1.00 | 0.92 | 0.90 | 0.94 | 0.91 | 0.65 | 0.59 | 0.49 | 0.58 | 0.52 |
| Spouse working = 1 | 0.00 | 0.59 | 0.45 | 0.50 | 0.47 | 0.00 | 0.82 | 0.64 | 0.68 | 0.64 |
| Co-resident child working = 1 | 0.00 | 0.00 | 0.47 | 0.00 | 0.33 | 0.00 | 0.00 | 0.57 | 0.00 | 0.43 |
| Any ADL problem = 1 | 0.00 | 0.16 | 0.11 | 0.08 | 0.11 | 0.50 | 0.31 | 0.27 | 0.22 | 0.27 |
| GHS poor = 1 | 0.00 | 0.12 | 0.11 | 0.09 | 0.11 | 0.22 | 0.14 | 0.14 | 0.11 | 0.14 |
| Rural = 1 | 0.14 | 0.74 | 0.55 | 0.63 | 0.58 | 0.62 | 0.74 | 0.53 | 0.72 | 0.57 |
SOURCE: Data from Indonesia Family Life Survey—IFLS1, IFLS2, IFLS3, and IFLS4.
TABLE 10-4 Cross-Sectional Analysis: LPM of Living with a Child, Male, Aged 55+, in 1993
| Variables in 1993 | (1) | (2) | (3) | (4) |
| Aged 60-69 | -0.026 | -0.015 | -0.018 | -0.019 |
| (0.98) | (0.86) | (1.05) | (1.09) | |
| Aged 70+ | -0.132 | -0.037 | -0.045 | -0.046 |
| (3.59)*** | (1.34) | (1.80)* | (1.81)* | |
| Completed primary | 0.037 | -0.042 | -0.027 | -0.028 |
| (1.14) | (1.86)* | (1.36) | (1.41) | |
| Completed junior high | 0.107 | -0.081 | -0.051 | -0.050 |
| (3.10)*** | (3.36)*** | (2.31)** | (2.27)** | |
| Completed senior high | 0.117 | -0.153 | -0.118 | -0.116 |
| (2.87)*** | (5.16)*** | (4.00)*** | (3.94)*** | |
| # of living sons | 0.034 | 0.003 | -0.007 | -0.006 |
| (4.66)*** | (0.59) | (1.47) | (1.41) | |
| # of living daughters | 0.040 | 0.015 | 0.014 | 0.014 |
| (5.13)*** | (2.88)*** | (2.83)*** | (2.90)*** | |
| Age of oldest child | 0.439 | 0.162 | 0.105 | 0.105 |
| (4.45)*** | (2.40)** | (1.47) | (1.48) | |
| Rural | -0.118 | 0.054 | 0.046 | 0.045 |
| (4.40)*** | (3.04)*** | (2.68)*** | (2.64)*** | |
| Spouse aged 60-69 | -0.020 | -0.025 | -0.026 | |
| (0.87) | (1.22) | (1.26) | ||
| Spouse aged 70+ | 0.009 | -0.002 | -0.005 | |
| (0.15) | (0.04) | (0.10) | ||
| Spouse, some primary sch. | 0.001 | 0.010 | 0.010 | |
| (0.04) | (0.47) | (0.47) | ||
| Spouse, compl. junior high | -0.113 | -0.090 | -0.089 | |
| (4.71)*** | (3.88)*** | (3.82)*** | ||
| Spouse, compl. senior high | -0.140 | -0.099 | -0.097 | |
| (4.54)*** | (2.92)*** | (2.86)*** | ||
| Divorced/widowed/never married | 0.018 | -0.005 | -0.006 | |
| (0.46) | (0.15) | (0.18) | ||
| Max. education of children | 0.073 | 0.061 | 0.061 | |
| (42.09)*** | (34.43)*** | (34.40)*** | ||
| Working | -0.017 | -0.012 | ||
| (0.92) | (0.63) | |||
| Spouse working | -0.010 | -0.010 | ||
| (0.62) | (0.64) | |||
| Child working | 0.268 | 0.267 | ||
| (16.78)*** | (16.79)*** | |||
| Poor GHS | 0.031 | |||
| (1.46) | ||||
| Any problem with ADLs | -0.003 | |||
| (0.16) | ||||
| Constant | 0.173 | 0.054 | 0.096 | 0.088 |
| (1.66)* | (0.79) | (1.30) | (1.20) | |
| Observations | 1,343 | 1,343 | 1,343 | 1,343 |
| R-squared | 0.11 | 0.62 | 0.68 | 0.68 |
NOTES: The sample consists of males aged 55-84 in 1993 with at least one living child. Dependent variable = 1 if the elderly was living with an adult child in 1993, 0 otherwise. Dummy variables for province of residence in 1993 are included in the regressions. Robust t statistics are in parentheses with significance at 10% (*), 5% (**), and 1% (***) indicated. Standard errors are corrected for clustering at the household level.
SOURCE: Author’s calculation based on data from Indonesia Family Life Survey—IFLS1.
spouse, the number of sons becomes not statistically significant, while the number of daughters is still statistically significant. Coefficients on own and spouse’s education are negative, but the coefficient on education of the child is positive. If own and spouse’s education is associated with income, the negative coefficients are consistent with the notion that privacy is a normal good: Elderly with higher household incomes tend to be less likely to co-reside with their children. Education of the children is positively associated with co-residency, perhaps suggesting that educated children are more equipped to support their elderly parents. This point is somewhat reinforced with the inclusion of the dummy variable indicating whether any of the co-resident children are working. The coefficient on this is positive. In the last specification, we include the measures for ADL and GHS, both of which are not statistically significant for men.
Turning to the results for women presented in Table 10-5, many of the correlations for men also exist women. One notable difference is that the number of sons is associated negatively with the probability of co-residence. Also, women having “poor health” is positively associated with co-residence, although having any problem with ADL has the opposite sign.
The results discussed thus far are based on cross-sectional relationships. For variables indicating labor participation, health status, and even marital status, making inference based on these cross-sectional correlations is problematic, given that labor market participation decisions and living arrangement decisions could are taken jointly.
Longitudinal Evidence
I next look at the longitudinal evidence, where the focus is on how the same covariates correlate with living arrangements 14 years later. The results of linear probability estimation of co-residency with a child in 2007 for men and women aged 55 and older are presented in Tables 10-6 and 10-7, respectively. The explanatory variables and the specifications are exactly the same as the cross-sectional analysis. Overall, the relationships are qualitatively similar to those we saw in the cross-sectional analysis.
For both men and women, own age correlates negatively with the probability of co-residing with a child. Note that these relationships differ from the one we have seen in the figures, in which for women, the probability of living with a child seems to be increasing with age. Controlling for other factors, the U-shape relationship between age and probability of co-residency for women is not evident. As in the cross-sectional results, for men, both the number of sons and daughters seem to correlate positively with future co-residency. However, for women, beyond the basic specification, the number of sons does not have statistically significant correlations with the probability of co-residency. The number of
TABLE 10-5 Cross-Sectional Analysis: LPM of Living with a Child, Female, Aged 55+, in 1993
| Variables in 1993 | (1) | (2) | (3) | (4) |
| Aged 60-69 | -0.057 | -0.012 | -0.017 | -0.013 |
| (2.02)** | (0.58) | (0.93) | (0.74) | |
| Aged 70+ | -0.210 | -0.037 | -0.035 | -0.022 |
| (5.17)*** | (1.24) | (1.31) | (0.80) | |
| Completed primary | 0.084 | -0.022 | -0.021 | -0.020 |
| (2.56)** | (0.91) | (1.00) | (0.96) | |
| Completed junior high | -0.044 | -0.170 | -0.143 | -0.138 |
| (0.97) | (6.93)*** | (6.53)*** | (6.30)*** | |
| Completed senior high | 0.020 | -0.202 | -0.175 | -0.174 |
| (0.33) | (6.21)*** | (5.09)*** | (5.07)*** | |
| # of living sons | 0.018 | -0.012 | -0.013 | -0.013 |
| (2.28)** | (2.21)** | (2.73)*** | (2.71)*** | |
| # of living daughters | 0.040 | 0.006 | 0.012 | 0.013 |
| (4.90)*** | (1.12) | (2.33)** | (2.52)** | |
| Age of oldest child | 0.625 | 0.334 | 0.267 | 0.273 |
| (9.64)*** | (9.14)*** | (9.14)*** | (9.14)*** | |
| Rural | -0.120 | 0.028 | 0.014 | 0.009 |
| (4.28)*** | (1.39) | (0.77) | (0.50) | |
| Spouse aged 60-69 | -0.021 | -0.026 | -0.027 | |
| (0.69) | (0.93) | (0.96) | ||
| Spouse aged 70+ | -0.036 | -0.038 | -0.038 | |
| (0.94) | (1.10) | (1.12) | ||
| Spouse, some primary sch. | -0.045 | -0.042 | -0.038 | |
| (1.43) | (1.52) | (1.37) | ||
| Spouse, compl. junior high | -0.069 | -0.043 | -0.042 | |
| (2.13)** | (1.47) | (1.44) | ||
| Spouse, compl. senior high | -0.179 | -0.106 | -0.105 | |
| (4.67)*** | (2.79)*** | (2.85)*** | ||
| Divorced/widowed/never married | -0.030 | -0.031 | -0.028 | |
| (0.86) | (0.96) | (0.86) | ||
| Max. education of children | 0.073 | 0.054 | 0.054 | |
| (40.20)*** | (28.00)*** | (28.10)*** | ||
| Working | -0.020 | -0.022 | ||
| (1.13) | (1.29) | |||
| Spouse working | 0.020 | 0.018 | ||
| (0.87) | (0.80) | |||
| Child working | 0.352 | 0.352 | ||
| (19.48)*** | (19.58)*** | |||
| Poor GHS | 0.040 | |||
| (1.97)** | ||||
| Any problem with ADLs | -0.051 | |||
| (2.87)*** | ||||
| Constant | 0.032 | -0.014 | -0.016 | -0.015 |
| (0.55) | (0.35) | (0.43) | (0.42) | |
| Observations | 1,277 | 1,277 | 1,277 | 1,277 |
| R-squared | 0.09 | 0.57 | 0.67 | 0.67 |
NOTES: The sample consists of females aged 55-84 in 1993 with at least one living child. Dependent variable = 1 if the elderly was living with an adult child in 1993, 0 otherwise. Dummy variables for province of residence in 1993 are included in the regressions. Robust t statistics are in parentheses with significance at 10% (*), 5% (**), and 1% (***) indicated. Standard errors are corrected for clustering at the household level.
SOURCE: Author’s calculation based on data from Indonesia Family Life Survey—IFLS1.
TABLE 10-6 LPM of Living with an Adult Child 14 Years Later, Male, Aged 55+, in 2007
| Variables in 1993 | (1) | (2) | (3) | (4) |
| Aged 60-69 | 0.011 | -0.005 | -0.009 | -0.009 |
| (0.41) | (0.23) | (0.48) | (0.50) | |
| Aged 70+ | -0.163 | -0.041 | -0.014 | -0.018 |
| (1.30) | (0.40) | (0.15) | (0.19) | |
| Completed primary | 0.024 | -0.030 | -0.025 | -0.025 |
| (0.77) | (1.39) | (1.29) | (1.27) | |
| Completed junior high | 0.067 | -0.070 | -0.048 | -0.047 |
| (2.11)** | (3.14)*** | (2.26)** | (2.25)** | |
| Completed senior high | 0.004 | -0.131 | -0.094 | -0.093 |
| (0.12) | (5.45)*** | (3.99)*** | (3.95)*** | |
| # of living sons | 0.065 | 0.015 | 0.006 | 0.006 |
| (9.79)*** | (3.52)*** | (1.53) | (1.52) | |
| # of living daughters | 0.057 | 0.011 | 0.009 | 0.009 |
| (7.82)*** | (2.49)** | (2.17)** | (2.16)** | |
| Age of oldest child | 0.465 | 0.123 | 0.104 | 0.104 |
| (11.35)*** | (5.07)*** | (4.42)*** | (4.42)*** | |
| Rural | -0.090 | 0.046 | 0.047 | 0.047 |
| (3.88)*** | (3.45)*** | (3.67)*** | (3.65)*** | |
| Spouse aged 60-69 | -0.064 | -0.075 | -0.076 | |
| (1.63) | (2.12)** | (2.12)** | ||
| Spouse aged 70+ | -0.103 | -0.093 | -0.090 | |
| (0.97) | (1.00) | (0.98) | ||
| Spouse, some primary sch. | -0.057 | -0.049 | -0.049 | |
| (3.27)*** | (3.06)*** | (3.03)*** | ||
| Spouse, compl. junior high | -0.113 | -0.099 | -0.098 | |
| (5.83)*** | (5.26)*** | (5.22)*** | ||
| Spouse, compl. senior high | -0.128 | -0.104 | -0.104 | |
| (5.75)*** | (4.60)*** | (4.56)*** | ||
| Divorced/widowed/never married | 0.087 | 0.047 | 0.044 | |
| (1.46) | (0.85) | (0.80) | ||
| Max. education of children | 0.077 | 0.072 | 0.072 | |
| (54.49)*** | (51.24)*** | (51.27)*** | ||
| Working | 0.021 | 0.023 | ||
| (0.97) | (1.05) | |||
| Spouse working | -0.024 | -0.025 | ||
| (1.99)** | (2.03)** | |||
| Child working | 0.171 | 0.171 | ||
| (12.55)*** | (12.57)*** | |||
| Poor GHS | 0.021 | |||
| (0.97) | ||||
| Any problem with ADLs | -0.004 | |||
| (0.17) | ||||
| Constant | 0.033 | 0.105 | 0.087 | 0.082 |
| (0.60) | (3.17)*** | (2.24)** | (2.09)** | |
| Observations | 1,782 | 1,782 | 1,782 | 1,782 |
| R-squared | 0.16 | 0.71 | 0.74 | 0.74 |
NOTES: The sample consists of males aged 55-84 in 2007 of whom 1993 data are available and who had at least one living child in 1993. Dependent variable = 1 if the elderly was living with an adult child in 2007, 0 otherwise. Dummy variables for province of residence in 1993 are included in the regressions. Robust t statistics are in parentheses with significance at 10% (*), 5% (**), and 1% (***) indicated. Standard errors are corrected for clustering at the household level.
SOURCE: Author’s calculation based on data from Indonesia Family Life Survey—IFLS1 and IFLS4.
TABLE 10-7 LPM of Living with an Adult Child 14 Years Later, Female, Aged 55+, in 2007
| Variables in 1993 | (1) | (2) | (3) | (4) |
| Aged 60-69 | -0.074 | -0.012 | -0.024 | -0.023 |
| (2.64)*** | (0.57) | (1.27) | (1.24) | |
| Aged 70+ | -0.154 | 0.045 | 0.047 | 0.049 |
| (1.37) | (0.51) | (0.56) | (0.59) | |
| Completed primary | 0.017 | -0.050 | -0.044 | -0.042 |
| (0.72) | (2.97)*** | (2.79)*** | (2.72)*** | |
| Completed junior high | 0.021 | -0.145 | -0.129 | -0.127 |
| (0.77) | (8.03)*** | (7.41)*** | (7.30)*** | |
| Completed senior high | 0.050 | -0.174 | -0.132 | -0.130 |
| (1.63) | (8.42)*** | (6.21)*** | (6.11)*** | |
| # of living sons | 0.048 | 0.005 | -0.003 | -0.003 |
| (8.58)*** | (1.24) | (0.86) | (0.83) | |
| # of living daughters | 0.044 | 0.015 | 0.014 | 0.014 |
| (7.24)*** | (3.64)*** | (3.65)*** | (3.76)*** | |
| Age of oldest child | 0.481 | 0.163 | 0.124 | 0.127 |
| (5.59)*** | (3.31)*** | (2.37)** | (2.35)** | |
| Rural | -0.113 | 0.035 | 0.037 | 0.036 |
| (5.56)*** | (2.55)** | (2.84)*** | (2.75)*** | |
| Spouse aged 60-69 | -0.020 | -0.024 | -0.026 | |
| (1.17) | (1.55) | (1.65)* | ||
| Spouse aged 70+ | -0.055 | -0.053 | -0.056 | |
| (1.60) | (1.74)* | (1.84)* | ||
| Spouse, some primary sch. | -0.013 | -0.012 | -0.013 | |
| (0.62) | (0.63) | (0.67) | ||
| Spouse, compl. junior high | -0.032 | -0.008 | -0.009 | |
| (1.48) | (0.40) | (0.46) | ||
| Spouse, compl. senior high | -0.091 | -0.061 | -0.062 | |
| (4.01)*** | (2.73)*** | (2.80)*** | ||
| Divorced/widowed/never married | -0.007 | 0.010 | 0.008 | |
| (0.29) | (0.38) | (0.31) | ||
| Max. education of children | 0.070 | 0.061 | 0.061 | |
| (44.91)*** | (41.68)*** | (41.64)*** | ||
| Working | -0.030 | -0.029 | ||
| (2.39)** | (2.30)** | |||
| Spouse working | 0.024 | 0.024 | ||
| (1.40) | (1.39) | |||
| Child working | 0.216 | 0.215 | ||
| (18.61)*** | (18.55)*** | |||
| Poor GHS | 0.048 | |||
| (2.52)** | ||||
| Any problem with ADLs | -0.020 | |||
| (1.38) | ||||
| Constant | 0.197 | 0.155 | 0.152 | 0.148 |
| (2.16)** | (2.89)*** | (2.59)*** | (2.46)** | |
| Observations | 2,016 | 2,016 | 2,016 | 2,016 |
| R-squared | 0.12 | 0.60 | 0.65 | 0.65 |
NOTES: The sample consists of females aged 55-84 in 2007 of whom 1993 data are available and who had at least one living child in 1993. Dependent variable = 1 if the elderly was living with an adult child in 2007, 0 otherwise. Dummy variables for province of residence in 1993 are included in the regressions. Robust t statistics are in parentheses with significance at 10% (*), 5% (**), and 1% (***) indicated. Standard errors are corrected for clustering at the household level.
SOURCE: Author’s calculation based on data from Indonesia Family Life Survey—IFLS1 and IFLS4.
daughters, on the other hand, is positively correlated with co-residency in all specifications. Elderly women who co-reside with their children are significantly more likely to co-reside with a daughter than with a son.
Finally, neither the ADL nor the GHS in 1993 seems to be correlated with the probability of elderly men co-residing 14 years later. For women, however, poor GHS in 1993 has a positive correlation with the probability to co-reside with their children in 2007.
The multinomial logit results add some insights. For each male and female, results from two specifications were presented. The first specification includes only the basic specification without the characteristics of the spouse. The second specification includes spouse’s characteristics and variables indicating work status of the respondent, the spouse, and the child, as well as health status of the elderly. Tables 10-8 and 10-9 show how predicted probabilities change with a change in a covariate, holding other variables at their means. These tables are based on regression results presented in Appendix Tables 10-A1 and 10-A2.10 Table 10-8 shows, for example, that an additional son would increase the probability of co-residence by 0.061, while an additional daughter would increase it by 0.042. Note, however, that from Appendix Table 10-A1, most of the coefficients for males are not statistically significant. For women, similar to the LPM results, the likelihood of co-residency with a child is higher, the more educated the children are. Table 10-8 shows that an increase of 1 year of maximum education of the children at the baseline year increases the probability of living with a child 14 years later by 0.010. For men, the coefficient is not significant and the marginal effect is negative. For women, having a spouse who works in the baseline year increases the likelihood of living with the spouse and decreases the likelihood of living with an adult child (see Appendix Table 10-A2). Again, this is consistent with the possibility that an elderly couple may value privacy and will tend to choose not to co-reside with a child if they have adequate resources. The results on age are consistent with what we have seen from the LPM results, and the U-shaped relationship between age and the likelihood of co-residency of elderly women is not evident. In fact, both older age groups show lower odds for co-residency compared to the age group 55-59 for both men and women.
____________
10 The marginal effects is defined as ![]() where j represents the possible outcomes (j = 0,1,2,3) and x is the vector of covariates. The discrete change (for example from xk = 0 to xk = 1) is defined as
where j represents the possible outcomes (j = 0,1,2,3) and x is the vector of covariates. The discrete change (for example from xk = 0 to xk = 1) is defined as ![]() .
.
CONCLUSIONS
In the 14 years between 1993 and 2007, there does not seem to be much change in living arrangements. The first thing to note from the descriptive results is that by focusing on age 55 and above for both men and women, we may be focusing on different lifecycle stages of the individuals. Because men tend to marry later and marry younger women, the sample of men consists of a much larger fraction of married men compared to women in the same age group. Mortality selection may play a role in the differences across groups, too, where relatively healthier men are observed in the sample. Own education and whether or not the elderly or his/her spouse is working in the base year are negatively correlated with the probability of living with an adult child, suggesting that elderly with more human capital (and household resources) may prefer living by themselves to living in a shared residence with their children.
There are gender differences in how own, spouse, or child’s characteristics at the baseline correlate with living arrangements. In particular, children’s potential earning (as measured by years of education) and work status seem to increase likelihood of co-residency for women, but not as much for men.
Further examination may tell us how much lifecycle variables such as age play a role in influencing a transition between living arrangements. More work should be done in looking at the transition, in particular since the four waves of IFLS would permit looking at transition between four different points in time (for respondents who were interviewed in all waves). More insights could be gained by such an exercise.
While the pattern of living arrangements seems to stay constant for now, demographic pressure will likely affect living arrangements as the population ages further. One important caveat of this paper is that the analysis excludes elderly who have no surviving children at the time of the survey—around 6 to 8%. This selected sample could include those who would be most vulnerable in old age.
TABLE 10-8 Changes in Predicted Probabilities from MNL: Living Arrangements of Males, Aged 55+, in 2007
| Pr (ylx) | ||||||
| x | sd(x) | |||||
| Marginal Effect | ||||||
| Number of sons | 2.151 | 1.499 | ||||
| ± 1 standard deviation | ||||||
| Marginal effect | ||||||
| Number of daughters | 2.149 | 1.434 | ||||
| ± 1 standard deviation | ||||||
| Marginal effect | ||||||
| Max. years of children's educ. | 6.060 | 5.073 | ||||
| ± 1 standard deviation | ||||||
| Marginal effect | ||||||
| Discrete Change from 0 to 1 | ||||||
| Own age | ||||||
| Aged 60-69 | 0.418 | 0.493 | ||||
| Age 70 | 0.275 | 0.447 | ||||
| Own education | ||||||
| Completed primary | 0.313 | 0.464 | ||||
| Completed junior high | 0.267 | 0.442 | ||||
| Completed senior high | 0.238 | 0.426 | ||||
| Maximum age of child > 15 | 0.945 | 0.228 | ||||
| Divorced/widowed/never married | 0.017 | 0.131 | ||||
| Spouse's age | ||||||
| Aged 60-69 | 0.043 | 0.202 | ||||
| Age 70 | 0.003 | 0.058 | ||||
| Spouse's education | ||||||
| Completed primary | 0.334 | 0.472 | ||||
| Completed junior high | 0.206 | 0.405 | ||||
| Completed senior high | 0.136 | 0.343 | ||||
| 0.576 | 0.494 | |||||
| Rural labor participation | ||||||
| Working | 0.912 | 0.283 | ||||
| Spouse working | 0.467 | 0.499 | ||||
| Any child working | 0.325 | 0.469 | ||||
| Health status | ||||||
| Any problem with ADLs | 0.106 | 0.308 | ||||
| “Poor” GHS | 0.107 | 0.309 | ||||
NOTE: This table is based on regressions in Appendix Table 10-A1, Specification 2.
SOURCE: Author’s calculation based on data from Indonesia Family Life Survey, IFLS1 and IFLS4.
| Living Alone | With Spouse | With Adult Child | Other Living Arr. | |||
| 0.209 | 0.659 | 0.124 | 0.008 | |||
| Ave.|Change| | With Spouse | With Adult Child | Other Living Arr. | Living Alone (base) | ||
| 0.023 | -0.018 | 0.043 | -0.027 | 0.002 | ||
| 0.031 | -0.034 | 0.061 | -0.026 | -0.001 | ||
| 0.023 | -0.015 | 0.046 | -0.005 | -0.026 | ||
| 0.021 | -0.034 | 0.042 | -0.009 | 0.000 | ||
| 0.011 | 0.022 | -0.006 | -0.014 | -0.014 | ||
| 0.002 | 0.004 | -0.001 | -0.003 | 0.000 | ||
| 0.039 | 0.057 | -0.078 | 0.012 | 0.010 | ||
| 0.087 | 0.131 | -0.174 | 0.029 | 0.014 | ||
| 0.032 | -0.060 | 0.050 | 0.015 | -0.005 | ||
| 0.044 | -0.076 | 0.088 | -0.008 | -0.003 | ||
| 0.090 | -0.135 | 0.179 | -0.038 | -0.007 | ||
| 0.042 | 0.085 | -0.037 | -0.045 | -0.003 | ||
| 0.088 | -0.176 | 0.125 | 0.011 | 0.039 | ||
| 0.017 | 0.010 | -0.032 | 0.023 | -0.002 | ||
| 0.346 | 0.059 | -0.692 | 0.569 | 0.064 | ||
| 0.016 | 0.000 | -0.033 | 0.030 | 0.002 | ||
| 0.005 | -0.003 | 0.009 | -0.006 | -0.001 | ||
| 0.025 | 0.018 | -0.046 | 0.031 | -0.003 | ||
| 0.030 | 0.048 | -0.053 | 0.011 | -0.006 | ||
| 0.018 | -0.018 | -0.018 | 0.035 | 0.001 | ||
| 0.034 | 0.067 | -0.067 | 0.000 | 0.001 | ||
| 0.032 | -0.051 | 0.065 | -0.013 | -0.001 | ||
| 0.005 | 0.010 | -0.005 | -0.003 | -0.002 | ||
| 0.015 | -0.030 | 0.020 | 0.008 | 0.002 | ||
TABLE 10-9 Changes in Predicted Probabilities from MNL: Living Arrangements of Females, Aged 55+, in 2007
| Pr (ylx) | ||
| x | sd(x) | |
|
Marginal Effect |
||
|
Number of sons |
2.262 | 1.565 |
|
± 1 standard deviation |
||
|
Marginal effect |
||
|
Number of daughters |
2.189 | 1.544 |
|
± 1 standard deviation |
||
|
Marginal effect |
||
|
Max. years of children’s educ. |
6.513 | 5.085 |
|
± 1 standard deviation |
||
|
Marginal effect |
||
|
Discrete Change from 0 to 1 |
||
|
Own age |
||
|
Aged 60-69 |
0.448 | 0.497 |
|
Age 70 |
0.269 | 0.444 |
|
Own education |
||
|
Completed primary |
0.266 | 0.442 |
|
Completed junior high |
0.170 | 0.375 |
|
Completed senior high |
0.117 | 0.321 |
|
Maximum age of child > 15 |
0.988 | 0.111 |
|
Divorced/widowed/never married |
0.221 | 0.415 |
|
Spouse's age |
||
|
Aged 60-69 |
0.197 | 0.398 |
|
Age 70 |
0.057 | 0.231 |
|
Spouse's education |
||
|
Completed primary |
0.231 | 0.421 |
|
Completed junior high |
0.191 | 0.393 |
|
Completed senior high |
0.154 | 0.361 |
|
|
0.577 | 0.494 |
|
Rural labor participation |
||
|
Working |
0.516 | 0.500 |
|
Spouse working |
0.641 | 0.480 |
|
Any child working |
0.426 | 0.495 |
|
Health status |
||
|
Any problem with ADLs |
0.275 | 0.447 |
|
“Poor” GHS |
0.140 | 0.347 |
NOTE: This table is based on regressions in Appendix Table 10-A2, Specification 2.
SOURCE: Author’s calculation based on data from Indonesia Family Life Survey, IFLS1 and IFLS4.
| Living Alone | With Spouse | With Adult Child | Other Living Arr. | |||
| 0.209 | 0.659 | 0.124 | 0.008 | |||
| Ave.|Change| | With Spouse | With Adult Child | Other Living Arr. | Living Alone (base) | ||
| 0.014 | -0.011 | 0.028 | -0.017 | 0.001 | ||
| 0.023 | -0.018 | 0.043 | -0.027 | 0.002 | ||
| 0.023 | -0.015 | 0.046 | -0.005 | -0.026 | ||
| 0.015 | -0.010 | 0.030 | -0.004 | -0.017 | ||
| 0.026 | -0.006 | 0.052 | -0.021 | -0.025 | ||
| 0.005 | -0.001 | 0.010 | -0.004 | -0.005 | ||
| 0.046 | 0.028 | -0.092 | 0.035 | 0.029 | ||
| 0.080 | 0.039 | -0.160 | 0.091 | 0.030 | ||
| 0.011 | 0.001 | -0.011 | 0.022 | -0.012 | ||
| 0.011 | 0.007 | -0.021 | 0.000 | 0.015 | ||
| 0.016 | 0.016 | 0.017 | -0.022 | -0.011 | ||
| 0.059 | 0.006 | -0.117 | 0.051 | 0.061 | ||
| 0.091 | -0.167 | 0.149 | -0.015 | 0.032 | ||
| 0.038 | -0.014 | -0.039 | -0.023 | 0.075 | ||
| 0.066 | -0.045 | -0.050 | -0.036 | 0.131 | ||
| 0.010 | -0.004 | 0.020 | -0.002 | -0.014 | ||
| 0.027 | 0.003 | 0.050 | -0.009 | -0.044 | ||
| 0.021 | -0.024 | 0.041 | -0.005 | -0.013 | ||
| 0.013 | 0.015 | -0.015 | 0.010 | -0.010 | ||
| 0.025 | 0.023 | -0.017 | -0.034 | 0.028 | ||
| 0.031 | 0.039 | 0.010 | 0.013 | -0.062 | ||
| 0.053 | -0.030 | 0.107 | -0.036 | -0.041 | ||
| 0.008 | 0.005 | -0.016 | 0.011 | 0.000 | ||
| 0.028 | -0.013 | -0.042 | 0.014 | 0.041 | ||
APPENDIX TABLE 10-A1 MNL of Living Arrangements, 1993-2007, Males, Aged 55+, in 2007 (living alone is the base outcome)
| Specification 1 | ||||||
| with spouse | with an adult child | other | ||||
| RRR | Z | RRR | Z | RRR | Z | |
| Aged 60-69 | 0.467 | -1.52 | 0.323* | -2.33 | 0.384 | -1.88 |
| Age 70+ | 0.540 | -1.16 | 0.236** | -2.79 | 0.381 | -1.78 |
| Some primary school | 1.584 | 1.04 | 2.220 | 1.84 | 2.311 | 1.81 |
| Completed primary | 1.519 | 0.90 | 2.310 | 1.85 | 1.781 | 1.18 |
| Completed junior high | 2.330 | 1.44 | 5.384** | 2.96 | 3.081 | 1.84 |
| # of living sons | 1.022 | 0.19 | 1.341 | 2.58 | 0.955 | -0.37 |
| # of living daughters | 0.861 | -1.30 | 1.085 | 0.74 | 0.918 | -0.71 |
| Age of oldest child | 2.497 | 1.30 | 1.451 | 0.57 | 1.019 | 0.03 |
| Spouse aged 60-69 | ||||||
| Spouse aged 70+ | ||||||
| Spouse, some primary sch. | ||||||
| Spouse, compl. primary | ||||||
| Spouse, compl. junior high | ||||||
| Divorced/widowed/never married | ||||||
| Max. education of children | ||||||
| Working | ||||||
| Spouse working | ||||||
| Child working | ||||||
| Any ADL problem | ||||||
| Poor GHS | ||||||
| Rural | 2.349 | 2.27 | 1.693 | 1.45 | 2.120 | 1.92 |
| Number of observations | 1,783 | |||||
| Likelihood ratio (Chi-squared) | 245.4 | |||||
| p-value | 0.000 | |||||
| Pseudo R-squared | 0.073 | |||||
NOTES: The sample consists of males aged 55-84 in 2007 of whom 1993 data are available and who had at least one living child in 1993. Relative risk ratios are reported. Province dummy variables are included in the regressions but not reported. * denotes p < 0.05; ** p < 0.01.
SOURCE: Author’s calculation based on data from Indonesia Family Life Survey, IFLS1 and IFLS4.
| Specification 2 | ||||||
| with spouse | with an adult child | other | ||||
| RRR | Z | RRR | Z | RRR | Z | |
| 0.460 | -1.53 | 0.155* | -2.35 | 0.389 | -1.83 | |
| 0.500 | -1.26 | 0.116** | -2.85 | 0.358 | -1.81 | |
| 1.459 | 0.80 | 0.976 | 1.65 | 2.224 | 1.64 | |
| 1.046 | 0.09 | 0.901 | 1.14 | 1.458 | 0.69 | |
| 1.333 | 0.40 | 2.593 | 1.95 | 2.101 | 1.01 | |
| 0.963 | -0.31 | 0.148 | 1.84 | 0.919 | -0.65 | |
| 0.831 | -1.53 | 0.121 | 0.36 | 0.913 | -0.73 | |
| 2.231 | 1.11 | 0.865 | 0.36 | 0.982 | -0.03 | |
| 1.324 | 0.35 | 0.954 | 0.23 | 1.500 | 0.48 | |
| 0.135 | -1.48 | 0.000 | -0.00 | 0.627 | -0.36 | |
| 0.773 | -0.60 | 0.309 | -0.73 | 0.976 | -0.05 | |
| 1.137 | 0.23 | 0.645 | 0.28 | 1.102 | 0.16 | |
| 1.608 | 0.56 | 1.121 | 0.39 | 1.857 | 0.71 | |
| 0.030** | -2.81 | 0.154* | -2.09 | 0.184 | -1.87 | |
| 1.056 | 1.31 | 0.042 | 0.79 | 1.012 | 0.26 | |
| 0.814 | -0.35 | 0.493 | -0.26 | 1.213 | 0.30 | |
| 1.226 | 0.56 | 0.285 | -0.61 | 0.891 | -0.31 | |
| 0.933 | -0.17 | 0.523 | 0.72 | 1.086 | 0.19 | |
| 1.342 | 0.48 | 0.760 | 0.40 | 1.246 | 0.34 | |
| 0.711 | -0.63 | 0.443 | -0.30 | 0.885 | -0.22 | |
| 2.601 | 2.41 | 0.726 | 1.67 | 2.238 | 1.96 | |
| 1,783 | ||||||
| 299.08 | ||||||
| 0.000 | ||||||
| 0.089 | ||||||
APPENDIX TABLE 10-A2 MNL of Living Arrangements, 1993-2007, Females, 55+, in 2007 (living alone is the base outcome)
| Specification 1 | ||||||
| with spouse | with an adult child | other | ||||
| RRR | Z | RRR | Z | RRR | Z | |
| Aged 60-69 | 0.588* | -2.10 | 0.465*** | -3.43 | 0.654 | -1.52 |
| Aged 70+ | 0.237*** | -5.04 | 0.294*** | -5.22 | 0.632 | -1.56 |
| Some primary school | 1.699 | 2.19 | 1.474 | 1.91 | 1.696* | 2.09 |
| Completed primary | 1.402 | 1.18 | 1.237 | 0.90 | 1.110 | 0.34 |
| Completed junior high | 2.148* | 2.05 | 1.902* | 2.01 | 1.299 | 0.61 |
| # of living sons | 0.908 | -1.54 | 1.123* | 2.35 | 0.875* | -2.01 |
| # of living daughters | 1.098 | 1.39 | 1.327*** | 5.09 | 1.202** | 2.68 |
| Age of oldest child | 0.386 | -0.85 | 0.448 | -0.76 | 0.695 | -0.29 |
| Spouse aged 60-69 | ||||||
| Spouse aged 70+ | ||||||
| Spouse, some primary sch. | ||||||
| Spouse, compl. primary | ||||||
| Spouse, compl. junior high | ||||||
| Divorced/widowed/never married | ||||||
| Max. education of children | ||||||
| Working | ||||||
| Spouse working | ||||||
| Child working | ||||||
| Any ADL problem | ||||||
| Poor GHS | ||||||
| Rural | 1.536 | 2.03 | 0.908 | -0.57 | 1.128 | 0.54 |
| Number of observations | 2,018 | |||||
| Likelihood ratio (Chi-squared) | 585.1 | |||||
| p-value | 0.000 | |||||
| Pseudo R-squared | 0.138 | |||||
NOTES: The sample consists of females aged 55-85 in 2007 of whom 1993 data are available and who had at least one living child in 1993. Relative risk ratios are reported. Province dummy variables are included in the regressions but not reported. * denotes p < 0.05; ** p < 0.01; *** p < 0.001.
SOURCE: Author’s calculation based on data from Indonesia Family Life Survey, IFLS1 and IFLS4.
| Specification 2 | ||||||
| with spouse | with an adult child | other | ||||
| RRR | Z | RRR | Z | RRR | Z | |
| 1.081 | 0.28 | 0.156 | -1.82 | 0.998 | -0.01 | |
| 1.183 | 0.49 | 0.157 | -2.05 | 1.462 | 1.10 | |
| 1.160 | 0.56 | 0.245 | 0.57 | 1.394 | 1.24 | |
| 0.897 | -0.33 | 0.208 | -0.85 | 0.825 | -0.56 | |
| 1.382 | 0.70 | 0.441 | 0.38 | 0.918 | -0.17 | |
| 0.836** | -2.65 | 0.054 | 0.37 | 0.835** | -2.60 | |
| 1.058 | 0.80 | 0.073*** | 4.13 | 1.179* | 2.34 | |
| 0.313 | -1.01 | 0.268 | -1.29 | 0.557 | -0.46 | |
| 0.404*** | -3.34 | 0.112** | -3.16 | 0.394** | -3.14 | |
| 0.155*** | -4.34 | 0.117** | -3.14 | 0.256** | -3.20 | |
| 1.152 | 0.50 | 0.307 | 0.85 | 1.179 | 0.54 | |
| 2.002 | 1.94 | 0.646* | 2.26 | 1.733 | 1.42 | |
| 0.813 | -0.48 | 0.451 | 0.61 | 1.124 | 0.25 | |
| 0.010 | -4.39 | 0.252 | -0.50 | 0.597 | -1.36 | |
| 1.042 | 1.73 | 0.021*** | 3.66 | 1.019 | 0.74 | |
| 0.982 | -0.09 | 0.116* | -2.16 | 0.524** | -3.07 | |
| 3.544*** | 4.42 | 0.440** | 2.97 | 2.176** | 2.63 | |
| 1.075 | 0.31 | 0.354 | 3.58 | 1.180 | 0.71 | |
| 1.069 | 0.27 | 0.191 | -0.12 | 1.104 | 0.40 | |
| 0.540 | -2.01 | 0.145 | -2.04 | 0.748 | -0.99 | |
| 1.437 | 1.56 | 0.207 | 0.64 | 1.254 | 0.96 | |
| 2,016 | ||||||
| 590.2 | ||||||
| 0.000 | ||||||
| 0.139 | ||||||
REFERENCES
Abikusno, N. (2009). Evaluation and implementation of ageing-related policies in Indonesia. In Older Persons in Southeast Asia: An Emerging Asset, E.N. Arifin and A. Ananta (Eds.). Singapore: ISEAS.
Ananta, A., and E.N. Arifin. (2009). Older persons in Southeast Asia: From liability to asset.
In Older Persons in Southeast Asia: An Emerging Asset, E.N. Arifin and A. Ananta (Eds.). Singapore: ISEAS.
Beard, V.A., and Y. Kunharibowo. (2001). Living arrangements and support relationships among elderly Indonesians: Case studies from Java and Sumatra. International Journal of Population Geography 7:17-33.
Cameron, L., and D. Cobb-Clark. (2002). Old age labour supply in the developing world. Applied Economic Letters 9(10):649-652.
Costa, D.L. (1997). Displacing the family: Union army pensions and elderly living arrangements. Journal of Political Economy 105:6.
Ermisch, J. (1999). Prices, parents, and young people’s household formation. Journal of Urban Economics 45(1):47-71.
Frankenberg, E., A. Chan, and M.B. Ofstedal. (2002.) Stability and change in living arrangements in Indonesia, Singapore, and Taiwan, 1993-99. Population Studies 56(2):201-213.
Frankenberg, E., J.P. Smith, and D. Thomas. (2003). Economic shocks, wealth and welfare. Journal of Human Resources 38(2):280-321.
Hugo, G. (1992). Aging in Indonesia: A neglected area of policy concern. Pp. 207-229 (Chapter 12) in Aging in East and Southeast Asia, D.R. Phillips (Ed). London: Edward Albert.
Indonesia Family Life Survey, Wave 1. (1994). Available: http://www.rand.org/labor/FLS/IFLS.html.
Indonesia Family Life Survey, Wave 2. (1997). Available: http://www.rand.org/labor/FLS/IFLS.html.
Indonesia Family Life Survey, Wave 3. (2000). Available: http://www.rand.org/labor/FLS/IFLS/ifls3.html.
Indonesia Family Life Survey, Wave 4. (2008). Available: http://www.rand.org/labor/FLS/IFLS/ifls4.html.
Kinsella, K., and W. He. (2009). An Aging World: 2008. U.S. Census Bureau, International Population Reports #PS95/09-1. Washington, DC: U.S. Government Printing Office.
National Socioeconomic Survey. (1993). Available: http://www.rand.org/labor/bps/susenas/1993.html.
National Socioeconomic Survey. (2007). Available: http://www.rand.org/labor/bps/susenas/2007.html.
Strauss, J., F. Witoelar, B. Sikoki, and A.M. Wattie. (2009a). The Fourth Wave of the Indonesia Family Life Survey: Overview and Field Report, Volume 1. Working Paper #WR-675/1-NIA/NICHD, Labor and Population Program. Santa Monica, CA: RAND Corporation.
Strauss, J., F. Witoelar, B. Sikoki, and A.M. Wattie. (2009b). User’s Guide for the Indonesia Family Life Survey: Wave 4, Volume 2. Working Paper #WR-675/1-NIA/NICHD, Labor and Population Program. Santa Monica, CA: RAND Corporation.
Thomas, D., F. Witoelar, E. Frankenberg, B. Sikoki, J. Strauss, C. Sumantri, and W. Suriastini. (Forthcoming). Cutting the costs of attrition: Results from the Indonesia Family Life Survey. Journal of Development Economics.
Wirakartakusumah, A., M. Djuhari, H. Sirait, and Z. Hidayat. (1997). Some problems and issues of older persons in Asia and the Pacific. Asian Population Studies 144:21-43.
Witoelar, F., J. Strauss, and B. Sikoki. (2009). Socioeconomic Success and Health in Later Life: Evidence from the Indonesia Family Life Survey. RAND Labor and Population Working Paper #WR-704. Santa Monica, CA: RAND Corporation.


