
Effects of Social Activities on Cognitive Functions: Evidence from CHARLS1
Yuqing Hu, Xiaoyan Lei, James P. Smith, and Yaohui Zhao
Cognitive function is a key dimension of the quality of life for the elderly in all countries. It is closely related to the ability to process information in daily life and helps shape overall well-being over the life course (McArdle, Smith, and Willis, 2011). Cognitive function involves operations such as perception, memory, creation of imagery, and thinking, and it declines sharply as people approach advanced age (Levy, 1994; Tilvis et al., 2004). With population aging, more people will begin to suffer from cognitive impairment. The situation is especially severe in China because of its extraordinary speed of population aging, accompanied by the eventual decline of families as a source of eldercare and the lack of long-term care facilities. It is thus important to study determinants of cognitive function to understand how to best postpone and slow down its eventual decline.
Social activities are of particular interest to us as they play a significant role in the daily lives of most Chinese elderly. Social-emotional Selec-
____________
1 This research was supported by grants from the National Institute on Aging to CCER at Peking University and the RAND Corporation, and grants from the Natural Science Foundation of China. It was also supported by the National Institute on Aging (Grant Number R21AG031372), Natural Science Foundation of China (Grant Numbers 70773002 and 70910107022), the World Bank (Contract 7145915), and the Fogarty International Center (Grant Number R03TW008358). The content is solely the responsibility of the authors and does not necessarily represent the official views of any of the funders. We appreciate the helpful comments received at the National Academy of Sciences meeting in New Delhi, India, and from the NAS reviewers.
tivity Theory (SST) argues that as people age, they become increasingly selective by investing greater resources in emotionally meaningful goals and activities. Present-oriented goals with emotional meaning are prioritized over future-oriented goals aimed at acquiring information about future decisions and expanding horizons (Löckenhoff and Carstensen, 2004). Due to a gradual decline in cognitive functioning and the ability to deal with complex cognitive tasks, the elderly seek out more emotional goals. Such motivations further limit their ability to seek information as well as their attention, memory, and cognition processing. However, cognitively stimulating social activity is hypothesized to benefit cognitive functions by providing resistance to mental diseases, such as dementia, and by reducing rates of cognitive decline (Hsu, 2007; Wang et al., 2002). The effects of different social activities on cognitive functions of the old warrant more exploration, especially for China where little research currently exists in part due to the lack of high-quality micro data.
A large volume of literature has investigated the relationship between cognition and social activities or social engagement among the elderly (Allaire and Marsiske, 1999; Wang et al., 2002; Zunzunegui et al., 2003). These studies confirm a positive relationship between the two. Among these studies, Zunzunegui et al. (2003), using data from a longitudinal survey of community-dwelling people over age 65, analyzed causal effects of social networks, social integration, and social engagement on cognitive decline of community-dwelling older Spanish adults with social variables measured at baseline, and cognitive change and decline measured after four years of follow-up. They were unable to determine whether the observed effect of social relations on cognitive function was the result of cumulative lifelong exposure to extensive social networks or a consequence of an abrupt change from an extensive network to a more limited one.
Similar studies on the relation between cognition and social activities in developing countries such as China are more fragmentary, primarily due to the lack of relevant data and a concentration on the young relative to health of the elderly. Asian populations are of particular interest because their elderly people are more likely to reside with their children and social activities may play different roles in their lives than in the western world. Glei et al. (2005) and Hsu (2007) are two exceptions that used longitudinal data from a survey of elderly in Taiwan and explored the effects of social participation on cognitive function. Hsu (2007) focused on regular social group participation and ignored leisure activity. He found that participating in any of these social groups has no significant correlation with cognitive function. Glei et al. (2005) used a broader definition of social interaction that includes more recreational activities and found that participating in these social activities may play an important role
on delaying cognitive decline. In our study, we employ a similar definition of social activity as in Glei et al. and investigate data from mainland China, which has the same tradition of living arrangements but is at a different stage of economic development under a different institutional background than Taiwan. In addition to what has been done in Hsu (2007) and Glei et al. (2005), we will try to seek a causal explanation through exploring the community-level facilities and organizations that enable more social interactions among Chinese elderly.
More specifically, this chapter attempts to address three questions. First, what is the relationship between social activity and different dimensions of cognitive function for Chinese elderly? Second, what are the differences among effects of alternative social activities on different dimensions of cognitive abilities? Instead of directly identifying the causal relationship, we test in an ordinary least squares (OLS) reduced form setting whether community facilities, which are strongly correlated with social activities, are correlated to cognitive function. To address these issues, we will use the recently collected data from the 2008 pilot survey of the China Health and Retirement Longitudinal Study (CHARLS). In addition to OLS estimates of association, we present OLS reduced form estimates that include some arguably exogenous determinants of individuals’ social activities.
The chapter is organized as follows. The next section presents a summary of CHARLS data, including a description of variables and summary statistics. The following section shows the principal relationships between cognitive functions and social activities emerging from the CHARLS data. We then present OLS reduced form estimations showing the relationship between cognitive functions and community facilities. The final section highlights our main conclusions.
DATA, VARIABLES, AND SUMMARY STATISTICS
Data and Variables
The 2008 CHARLS pilot was conducted in Zhejiang and Gansu provinces. Zhejiang, located in the developed coastal region, is a dynamic province with fast economic growth, a private sector, small-scale industrialization, and an export orientation. In contrast, Gansu, located in the less developed western region, is one of the poorest, most rural provinces in China. These two provinces were selected in part due to their economic diversity. Among all provinces in 2008, Zhejiang had the highest rural and urban incomes per capita after Shanghai and Beijing, while Gansu had the second lowest rural per capita income and fourth lowest urban per capita income. The target population of CHARLS is individuals aged 45 and older and their spouses/partners irrespective of age.
The sampling design of the 2008 wave of CHARLS aimed to be representative of residents aged 45 and older in these two provinces. Within each province, CHARLS randomly selected 13 county-level units by PPS (Probability Proportional to Size), stratified by regions and urban/rural. Within each county-level unit, CHARLS randomly selected three village-level units (villages in rural areas and urban communities in urban areas) by PPS as primary sampling units (PSUs). Within each PSU, CHARLS randomly selected 25 dwellings in rural and 36 in urban areas from a complete list of dwelling units generated from a mapping/listing operation. In situations where more than one age-eligible household lived in a dwelling unit, CHARLS randomly selected one. Within each household, one person aged 45 and older was randomly chosen as the main respondent, and the spouse was automatically included. Based on this sampling procedure, one or two individuals in each household were interviewed depending on marital status of the main respondent. The total sample size was 2,685 individuals in 1,570 households. The CHARLS pilot experience was very positive. Overall response rate was 85%: 79% in urban areas and 90% in rural areas. Response rates were about the same in the two provinces, 83.9% in Zhejiang and 85.8% in Gansu. The high response rates reflected detailed procedures put in place to ensure a high response to the survey.2
In the CHARLS sample, people for the most part do not choose the community in which they live, but instead they mostly live where they were born. CHARLS respondents who are by design aged 45 and older are relatively immobile and did not participate in the great Chinese migration patterns. About 9 in 10 CHARLS respondents are living in the same county in which he or she was born and less than 1 in every 20 is living in a different province in which he or she was born (Smith et al., 2012).
Following protocols of the Health and Retirement Studies (HRS) international surveys, the 2008 CHARLS main questionnaire consists of seven modules: (1) demographic background, (2) family, (3) health status and functioning, (4) healthcare and insurance, (5) work, retirement and pension, (6) income, expenditure and assets, and (7) interviewer observation (Zhao et al., 2009). All data were collected in face-to-face, computer-aided personal interviews (CAPI).
Rich information makes CHARLS well suited for research on cognitive abilities and social activities. Our study sample includes respondents
____________
2 Letters to respondents were delivered (often by the village leader) to households to inform them of the significance of the study, contents of questionnaires, provision of a free physical examination, and compensation, as well as the expected date of arrival of the interviewers. On the day of the interview, interviewers were often introduced to the households by community leaders to confirm the authenticity of their identity. When refused, multiple attempts were made to persuade respondents to participate and the team leader was required to go and make a final attempt before declaring the household a refusal.
45 years and older, representing Zhejiang and Gansu provinces. After discarding 109 individuals younger than 45 years old (spouses of the main respondents), 1 with missing age, and 282 with missing cognition due to proxy,3 we are left with a sample of 2,293 observations, among which 1,131 are men and 1,162 are women, 850 (37.1%) are younger than 50 years old, 768 (33.5%) are 50-60 years old, 461 (20.1%) are 60-70 years old, and 214 (9.3%) are aged 70 and older.
Social Activity (SA)
In CHARLS, questions on social activities are in the “health status and function” module, where interviewees are asked whether they have taken part in 10 specifically listed activities in the past month. The 10 activities are (1) volunteer or charity work; (2) caring for a sick or disabled adult who does not live with the respondent and who does not pay for the help; (3) providing help to family, friends, or neighbors who do not live with the respondent and who do not pay for the help; (4) attending an educational or training course; (5) interacting with friends; (6) playing Mahjong, chess, or cards, or going to a community club; (7) attending a sporting event or other kind of club; (8) taking part in a community-related organization; (9) investing in stocks; and (10) surfing the Internet. Seven out of these 10 are considered social activities, while the remaining three activities—3, 9, and 10—are not.4
Table 12-1 depicts participation rates in each of these social activities. Interacting with friends and playing table games such as Mahjong have much higher participation rates than other activities (34.5% interacted with friends and 17.1% played Mahjong, chess, or card games), so we put each of them into a distinct group and grouped the rest into a category called “other social activities.” We define a variable called “any activity” to indicate if a respondent was involved in at least one social activity. Forty-six percent participated in at least one activity.
Table games, especially the traditional Chinese game of Mahjong, play an important role in many Chinese seniors’ lives. When relatives live far away, Mahjong helps form a sense of belonging by providing a chance to interact with those with whom one shares interests and personalities. The effort to win games—remembering rules, learning skills, and observing and reacting to others’ behavior—forces the brain to work and is hypothesized to enhance people’s cognitive functioning through such
____________
3 Missing values of the control variables are imputed by multiple imputation method.
4 Options 9 and 10 are obviously not social activities. We do not consider option 3 as a social activity, as the wording is very likely to be understood as providing economic help to family and friends, which seems different from social activities in the Chinese context.
TABLE 12-1 Description of Social Activities and Cognitive Function
| Gender | |||
| Social Activity and Other Activity Variables | All | Male | Female |
| Interacted with friends | 0.345 | 0.317 | 0.371 |
| Played Mahjong, chess, or cards | 0.171 | 0.236 | 0.108 |
| Other social activities | 0.086 | 0.076 | 0.095 |
| Done voluntary or charity work | 0.012 | 0.016 | 0.009 |
| Cared for sick or disabled as volunteer | 0.040 | 0.039 | 0.040 |
| Attended education or training course | 0.006 | 0.007 | 0.005 |
| Gone to sport, social, or other club | 0.027 | 0.014 | 0.039 |
| Taken part in community-related organization | 0.016 | 0.016 | 0.016 |
| Attended any activity above | 0.457 | 0.470 | 0.444 |
| Number of activities attended | 0.616 | 0.645 | 0.588 |
| Number of observations | 2,293 | 1,131 | 1,162 |
| Cognitive function | |||
| Mental intactness (0-11) | 8.621 | 9.046 | 8.167 |
| [2.14] | [1.89] | [2.30] | |
| Number of observations | 1,873 | 968 | 905 |
| Episodic memory | 2.986 | 3.103 | 2.862 |
| [2.02] | [1.99] | [2.05] | |
| Number of observations | 1,901 | 979 | 922 |
NOTE: For cognitive function, standard errors are below coefficients in brackets.
SOURCE: Data from CHARLS 2008 Pilot.
activities. Provided that sufficient infrastructure and services in the community exist, playing Mahjong or chess at home or in the neighborhood is a common way for older Chinese to spend leisure time by interacting with friends and neighbors.
Cognitive Ability (CA)
Cognitive function of respondents is also measured in the “health status and function” module in the CHARLS questionnaire, which tests orientation, calculation, word recall, and other cognitive dimensions. Cognitive ability can be generally categorized into fluid cognitive ability (FCA) and crystallized cognitive ability (CCA). The former concerns learning
| Region | Province | Age Group | ||||||
| Urban | Rural | Zhejiang | Gansu | < 50 | 50-60 | 60-70 | > 70 | |
| 0.385 | 0.313 | 0.405 | 0.271 | 0.400 | 0.311 | 0.323 | 0.290 | |
| 0.229 | 0.125 | 0.230 | 0.101 | 0.195 | 0.175 | 0.141 | 0.131 | |
| 0.129 | 0.051 | 0.104 | 0.064 | 0.118 | 0.073 | 0.067 | 0.042 | |
| 0.020 | 0.006 | 0.011 | 0.014 | 0.019 | 0.009 | 0.004 | 0.014 | |
| 0.047 | 0.034 | 0.041 | 0.039 | 0.059 | 0.038 | 0.024 | 0.005 | |
| 0.011 | 0.002 | 0.007 | 0.005 | 0.011 | 0.004 | 0.002 | 0.005 | |
| 0.056 | 0.003 | 0.039 | 0.012 | 0.037 | 0.023 | 0.020 | 0.014 | |
| 0.020 | 0.013 | 0.022 | 0.008 | 0.022 | 0.009 | 0.017 | 0.009 | |
| 0.535 | 0.394 | 0.556 | 0.338 | 0.514 | 0.419 | 0.451 | 0.374 | |
| 0.767 | 0.496 | 0.756 | 0.448 | 0.742 | 0.569 | 0.532 | 0.467 | |
| 1,017 | 1,276 | 1,253 | 1,040 | 850 | 768 | 461 | 214 | |
| 9.153 | 8.140 | 9.144 | 7.979 | 9.032 | 8.593 | 8.156 | 7.687 | |
| [1.93] | [2.21] | [1.92] | [2.23] | [1.95] | [2.13] | [2.31] | [2.26] | |
| 889 | 984 | 1032 | 841 | 741 | 648 | 353 | 131 | |
| 3.411 | 2.608 | 3.083 | 2.869 | 3.498 | 3.022 | 2.388 | 1.544 | |
| [1.97] | [1.99] | [2.07] | [1.96] | [2.03] | [1.97] | [1.82] | [1.63] | |
| 895 | 1,006 | 1,041 | 860 | 750 | 661 | 354 | 136 | |
performance and processing of new material, which tends to decline substantially in adulthood (Schaie, 1994; Verhaegen and Salthouse, 1997). The latter includes knowledge and skills accumulated in the past, which are not as easily lost.
In this research, for simplicity, we classify cognitive abilities into two categories: mental intactness (MI) and episodic memory (EM). As shown in Table 12-2, three items are used to measure mental intactness: a serial-7 number subtraction question, time orientation, and picture drawing. The scores range from 0-5, 0-5, and 0-1, respectively. Orientation in time consists of three questions about the interview date (day, month, year), day of the week, and season, which were coded as dummies to indicate whether answers are correct. To measure episodic memory, we use imme-
TABLE 12-2 Definition of Cognitive Abilities
| Types | Items | Survey Questions | Score |
| Mental intactness (0-11) | Numerical ability | What does 100 minus 7 equal? And 7 from that?.. | 0~5 |
| Time orientation | Please tell me today's date (year, month, day). Please tell me the day of the week. What is the current season (among Spring, Summer, Fall, or Winter)? |
0~3 0~1 0~1 |
|
| Picture drawing | Do you see this picture? Please draw that picture on this paper. | 0~1 | |
| Episodic memory (0-10) | Immediate word recall | Try to remember the words I just read to you. I’ll ask you to recall them later. |
0~10 |
| Delayed word recall | A little while ago, I read you a list of words and you repeated the ones you could remember. Please tell me any of the words that you remember now. |
0~10 | |
NOTES: Scores have been adjusted so that higher values indicate better cognitive function Episodic memory is the mean of scores of immediate and delayed word recalls.
SOURCE: Data from CHARLS 2008 Pilot.
diate and delayed word recall. In the recall test, respondents are read a list of 10 simple nouns, then immediately asked to repeat as many of those words as possible in any order. After 20 questions concerning CESD, they are again asked to recall as many of the original words as possible. The item is coded as 1 if recalled by the interviewee, and as 0 if not. Scores for immediate and delayed recall both vary from 0 to 10. We follow the approach by McArdle, Smith, and Willis (2011), using the mean of scores in immediate and delayed word recall as the measure of episodic memory. Figure 12-1 depicts the different downward trends of mental intactness and episodic memory, where original average scores have been smoothed. Clearly both cognitive measures steadily decline with age, with the age pattern becoming more erratic as sample sizes in CHARLS 2008 become thinner at older ages. One caution in reading this graph is that the number of observations over aged 80 in the CHARLS data is relatively small (only 69 in total), so that the patterns start to become erratic at these ages.
Episodic memory is a very general measure of an important aspect of fluid intelligence since access to memory is basic to any type of cognitive ability. Most of the variation in this measure is picking out the low end—people with bad memory so social activities of the sort analyzed here may have noticeable impacts. Intact mental status, however, contains elements of both fluid and crystallized intelligence, needed for many cognitive tasks but not specific to any particular domain (see McArdle et al., 2011).
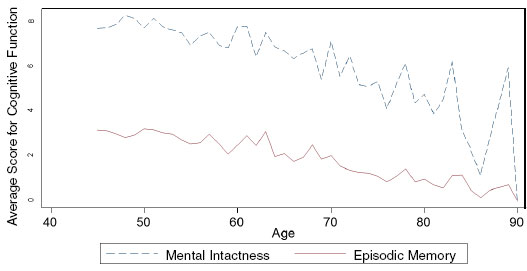
FIGURE 12-1 Cognition trend with age.
SOURCE: Data from CHARLS 2008 Pilot.
Other Variables
Other control variables are mainly concerned with demographics, socioeconomic status, and community-level variables. Demographics include a quadratic in age to capture any nonlinear effect of age, sex (female = 1), marital status of the respondent (married = 1), location of household (urban or rural [urban = 1]), province of residence (Zhejiang or Gansu), number of children, and number of siblings. Number of children, including both biological and non-biological daughters and sons, serves as one measure for family support.
Socioeconomic status has two dimensions: education and log household expenditure per capita (log PCE). Education is classified into five discrete educational groups: illiterate, able to write or read, finished primary school, finished junior high school, finished senior high school or above. In the second category, “able to write or read” includes those not finishing primary school but capable of reading or writing, or those reported to have been in Sishu.5 The category of “high school or above” includes those completing a senior high school, vocational school, college, or graduate level education. We also control log PCE to capture effects of financial resources. In rural developing economies, consumption expenditures represent the best measure of the economic resources available to the family (Strauss and Thomas, 2008).
____________
5 Sishu is an old-style private Chinese education that mainly taught young children Chinese classics before the 20th century.
Lastly, we include community demographics and socioeconomic status, since we believe that cognition may be affected by one’s surrounding environment (Engelhardt et al., 2010; Hauser, 2009). Three aspects of the community are considered: demographics, public services, and a general community evaluation. For demographics, we include the sex ratio (the percentage female) and the number of big surnames (a surname shared by large numbers of people in the village). The latter is included since the possibility exists that some unobserved genetic factors systematically affect people’s cognitive functions, and the number of big surnames may indicate relatives in the community with whom the respondent may interact so it may serve as a measure of social connectedness.
Community-level variables generated from the CHARLS community survey are used to capture public services. These community-level variables are derived from a separate survey of community leaders that describes current facilities and histories of the community. For example, the number of libraries and the distance from the community/village office to the most commonly used library are both used. Similarly, number and distance are asked for kindergartens, primary schools, middle schools, senior high schools, theatres, nursing homes, bus lines, and train station. We include a variable measuring percentage of people with one or more telephones and percentage with one or more mobile phones in the community. Accessibility and availability of public services is a reflection of social and economic capital in a society that is effective in improving people’s health (Yip et al., 2007). For evaluation of community, we have three measures: (1) log public expenditure during the past year, (2) community log per capita expenditures, and (3) interviewer rating of whether community medical service is poor. Community log PCE is an average of individual respondents’ log PCEs in each community.
Summary Statistics
Table 12-1 presents summary statistics for participation in social activities by sex, region, province, and age group. Fewer than half of respondents engaged in any kind of social activities, with 44% of women and 47% of men taking part. Interacting with friends is the most popular activity, with a participation rate of 34.5%, followed by Mahjong, chess, cards, or a club (17.1%), and only 8.6% participating in “other social activities.”6 Men are more active in playing Mahjong, chess, cards, or going to a club, doing voluntary or charity work, or attending an educational or training course, while women are more inclined to interact with friends.
Regional disparity is more pronounced than gender differences. Liv-
____________
6 There is some overlap among the various social activities.
ing in an urban area or in Zhejiang province has a great advantage in participation in social activities: 53.5% of urban people took part in social activities, compared with only 39.4% for those in rural areas. In Zhejiang, 55.6% of residents are involved in social activities, compared to only 33.8% of Gansu residents. Urban residents have a 7.4% higher participation rate in interacting with friends, and a 10.4% higher rate in playing Mahjong, chess, or cards. This rural-urban difference may be due partly to the urban elderly having more leisure time than rural elderly who are busy trying to make a living. One factor that likely impacts participation is accessibility and availability of activating facilities in the village/community, as discussed below.
The last four columns in Table 12-1 list social activity participation across four age groups. People become less engaged as they age, which may be partly due to declining health with age.7 However, there are two exceptions: participation rates for interacting with friends drop sharply between ages 50-60 (from 40 to 31.1%). But then it bounces back up in the 60-70 age group (32.3%), indicating that while retirement may reduce interactions with work-related social networks, after a period of adjustment, people are able to socialize with friends outside of their former jobs. Taking part in a community-related organization demonstrates a similar pattern. This may be explained by the possibility that retirement detaches people from occupational positions in community-related organizations, but they once again become involved in such organizations as participants rather than staff.
Table 12-3 summarizes the distribution of test scores on the MI and EM of respondents, where large differences exist across sex, region, and age. The mean score for MI is 8.62 and for EM is 2.99. The description illustrates that women are on average much more cognitively impaired. Rural Gansu elderly are also more disadvantaged in both aspects of cognitive abilities. Comparing people of different age groups, the older group is associated with lower cognitive ability, which is consistent with cognition declining with aging.
Table 12-4 provides a summary of demographic and SES attributes across sex, region, province, and age groups. Our analytical sample has a mean age of 59.4, is about half female, 44.4% urban residents, and 54.6% Zhejiang residents. Age, sex, and location of residence do not significantly differ among these groups. Respondents have an average of 2.74 children and 3.21 siblings. Female, rural, and Gansu elderly have more
____________
7 These age patterns may reflect cohort effects as well, and cohort effects are plausible given the large changes in China over time. With only cross-sectional data, we cannot distinguish between age and cohort effects. The use of 10-year age groups centered on ages 50 and 60 reflects the fact that the official retirement age for urban women is 50 and for urban men is 60
TABLE 12-3 Social Activity and Cognition
| Interacting with Friends | ||||||
| Yes | No | |||||
| All | Female | Male | All | Female | Male | |
| Intactness score | 8.9 | 8.47 | 9.37 | 8.47 | 7.971 | 8.88 |
| [1.994] | [2.162] | [1.668] | [2.210] | [2.370] | [1.973] | |
| Memory score | 3.33 | 3.17 | 3.51 | 2.79 | 2.666 | 2.9 |
| [2.001] | [2.021] | [1.965] | [2.01] | [2.053] | [1.967] | |
| Other Activities | ||||||
| Yes | No | |||||
| All | Female | Male | All | Female | Male | |
| Intactness score | 9.59 | 9.382 | 9.83 | 8.53 | 8.034 | 8.98 |
| [1.694] | [1.808] | [1.522] | [2.160] | [2.312] | [1.905] | |
| Memory score | 3.89 | 4.044 | 3.71 | 2.9 | 2.733 | 3.05 |
| [1.934] | [1.815] | [2.065] | [2.009] | [2.038] | [1.971] | |
NOTE: Standard errors in brackets.
SOURCE: Data from CHARLS 2008 Pilot.
TABLE 12-4 Description of Other Characteristics:
Demographics and SES
| Sex | Region | ||||
| Attributes | All | Male | Female | Urban | Rural |
| Demographics | |||||
| Age (45+) | 59.44 | 60.10 | 58.80 | 59.32 | 59.53 |
| Female | 0.507 | 0 | 1 | 0.533 | 0.486 |
| Urban | 0.444 | 0.420 | 0.466 | 1.000 | 0.000 |
| Zhejiang | 0.546 | 0.544 | 0.549 | 0.666 | 0.451 |
| No. of children | 2.74 | 2.60 | 2.87 | 2.59 | 2.85 |
| No. of siblings | 3.21 | 3.05 | 3.37 | 3.24 | 3.19 |
| SES | |||||
| Education | |||||
| Illiterate | 0.425 | 0.247 | 0.598 | 0.332 | 0.498 |
| Sishu/home school and below | 0.189 | 0.233 | 0.145 | 0.187 | 0.190 |
| Elementary school | 0.171 | 0.231 | 0.112 | 0.190 | 0.155 |
| Middle school | 0.127 | 0.168 | 0.088 | 0.156 | 0.104 |
| High school and above | 0.088 | 0.119 | 0.057 | 0.133 | 0.052 |
| Log PCE | 8.408 | 8.429 | 8.388 | 8.689 | 8.185 |
| Number of observations | 2,293 | 1,131 | 1,162 | 1,017 | 1,276 |
SOURCE: Data from CHARLS 2008 Pilot.
| Playing Mahjong, Chess, or Cards | ||||||
| Yes | No | |||||
| All | Female | Male | All | Female | Male | |
| 9.43 | 9.25 | 9.51 | 8.43 | 8.008 | 8.89 | |
| [1.587] | [1.739] | [1.506] | [2.214] | [2.333] | [1.980] | |
| 3.84 | 4.044 | 3.75 | 2.79 | 2.697 | 2.89 | |
| [1.923] | [1.882] | [1.938] | [1.994] | [2.024] | [1.957] | |
| Any Activities | ||||||
| Yes | No | |||||
| All | Female | Male | All | Female | Male | |
| 9.02 | 8.596 | 9.41 | 8.25 | 7.785 | 8.7 | |
| [1.916] | [2.136] | [1.599] | [2.273] | [2.376] | [2.075] | |
| 3.39 | 3.282 | 3.49 | 2.62 | 2.496 | 2.74 | |
| [1.965] | [1.996] | [1.933] | [2.003] | [2.035] | [1.967] | |
| Province | Age Group | |||||
| Zhejiang | Gansu | <50 | 50~60 | 60~70 | >70 | |
| 59.88 | 58.912 | 49.55 | 59.12 | 69.09 | 79.05 | |
| 0.509 | 0.504 | 0.546 | 0.500 | 0.449 | 0.500 | |
| 0.540 | 0.327 | 0.466 | 0.419 | 0.423 | 0.486 | |
| 1 | 0 | 0.540 | 0.543 | 0.508 | 0.668 | |
| 2.55 | 2.96 | 2.02 | 2.62 | 3.54 | 4.25 | |
| 3.15 | 3.28 | 3.81 | 3.45 | 2.44 | 1.62 | |
| 0.372 | 0.489 | 0.326 | 0.412 | 0.523 | 0.654 | |
| 0.250 | 0.115 | 0.139 | 0.244 | 0.197 | 0.173 | |
| 0.194 | 0.142 | 0.171 | 0.207 | 0.139 | 0.108 | |
| 0.110 | 0.148 | 0.206 | 0.087 | 0.091 | 0.037 | |
| 0.074 | 0.104 | 0.159 | 0.051 | 0.048 | 0.023 | |
| 8.695 | 8.064 | 8.651 | 8.341 | 8.230 | 8.070 | |
| 1,253 | 1,040 | 850 | 768 | 461 | 214 | |
children and siblings than their male, urban, and Zhejiang counterparts. People of older ages have more children, but have fewer siblings.
The highest attained education level for these older Chinese respondents is generally low, and its distribution is skewed with more than 60% having failed to finish primary school, 42.5% are illiterate, and 18.9% can read or write. Only a small portion (11.9% of men and 5.7% of women) have reached a senior high school level education or above. A large sex discrepancy exists: 59.8% of women are illiterate, approximately twice the rate among men. Among men, 11.9% have attained a high school education or above, while only 5.7% of women have done the same.8 Residents of Zhejiang and urban areas have a greater advantage in educational resources, leading to higher education levels for those residents. Not surprisingly given the rapid secular increase in education in China, education levels decline with age with people over 70 the most disadvantaged: as many as 65% are illiterate.
Disparities in log PCE are large between these two Chinese provinces, selected in part for their economic diversity. On average, log PCE is 8.69 for urban people, 8.19 for those living in rural areas, 8.70 for Zhejiang province, and 8.06 for Gansu province. Table 12-5 tabulates community characteristics by region and province. As shown, urban areas have a larger percentage of women, while the difference between Zhejiang and Gansu is much smaller. In addition, the table implies that urban regions and Zhejiang have better public services. Schools, libraries, theatres, and other places are more accessible (shorter distances indicate they are closer together). They also enjoy better economic status, with larger fractions of the population having telephones and mobile phones, and more expenditure and income per capita.
The Association of Social Activities and Cognitive Function
Table 12-3 displays the two-way association between participation in social activities and our two cognitive function measures—MI and EM. Those who participate in social activities uniformly have higher scores in mental intactness and episodic memory for both men and women, particularly sharp for episodic memory.
To go beyond a simple two-way association, we estimated OLS association regressions that control for other confounding factors in Tables 12-6 (for mental intactness) and 12-7 (for episodic memory). In each table, Models (1) and (2) display the results from two models with different
____________
8 In Lei et al. (2011), we found that Chinese women were less cognitively able than Chinese men with most but not all of that difference being explained by the lower education level of Chinese women in these generations.
TABLE 12-5 Description of Other Characteristics: Community
| Region | Province | ||||
| Community-Level Variables | Overall | Urban | Rural | Zhejiang | Gansu |
| % of female | 0.501 | 0.533 | 0.486 | 0.501 | 0.504 |
| # of big surnames | 1.615 | 1.476 | 1.679 | 1.428 | 1.831 |
| # of kindergartens | 1.098 | 1.479 | 0.719 | 1.168 | 0.979 |
| distance from kindergarten | 2.551 | 0.893 | 0.675 | 1.932 | 3.436 |
| # of primary school | 0.651 | 0.444 | 0.815 | 0.358 | 1.003 |
| distance from primary school | 0.772 | 1.991 | 4.150 | 2.998 | 0.129 |
| # of middle schools | 0.188 | 0.291 | 0.106 | 0.191 | 0.185 |
| distance from middle school | 3.190 | 1.993 | 3.106 | 1.305 | 3.590 |
| # of senior high schools | 0.045 | 0.101 | 0.000 | 0.066 | 0.019 |
| distance from senior high school | 11.461 | 5.848 | 15.789 | 8.129 | 15.588 |
| # of post offices | 0.181 | 0.313 | 0.076 | 0.163 | 0.203 |
| distance from post office | 4.224 | 2.057 | 6.000 | 2.809 | 5.989 |
| # of libraries | 0.438 | 0.657 | 0.264 | 0.629 | 0.209 |
| distance from the library | 8.726 | 3.363 | 12.765 | 2.552 | 16.255 |
| # of theatres | 0.085 | 0.170 | 0.017 | 0.073 | 0.099 |
| distance from the theatre | 13.367 | 5.469 | 19.875 | 7.347 | 21.004 |
| # of nursing homes | 0.081 | 0.128 | 0.043 | 0.095 | 0.064 |
| distance from nursing home | 9.491 | 6.668 | 11.619 | 3.848 | 18.530 |
| # of bus lines | 2.123 | 3.306 | 1.194 | 2.880 | 1.197 |
| distance from bus line | 2.253 | 0.886 | 3.313 | 0.434 | 4.502 |
| distance from train station | 81.811 | 81.665 | 81.915 | 84.846 | 78.399 |
| % of people having telephones | 64.714 | 73.178 | 60.800 | 74.218 | 53.716 |
| % of people having cellphones | 77.013 | 88.549 | 71.679 | 88.815 | 63.355 |
| Whether the medical care is poor | 0.017 | 0.023 | 0.013 | 0.000 | 0.036 |
| Log public expenditure during the past year | 8.514 | 10.469 | 7.621 | 11.936 | 4.560 |
| Log per capita income | 8.124 | 8.584 | 7.791 | 8.905 | 7.253 |
| Observations | 2,293 | 1,017 | 1,276 | 1,253 | 1,040 |
SOURCE: Data from CHARLS 2008 Pilot.
measures for social activities. In the first model, three separate social activities “interacting with friends,” “playing Mahjong, chess, or attending a club,” and “taking part in other social activities” are included together as the key explanatory variables; in the second model, we use instead the variable “taking part in any of the social activities.” In addition to these cognitive measures, both models include standard demographic controls (a quadratic in age, female, urban, Zhejiang residence, and the number of children and number of siblings), economic controls (education and log PCE), as well as detailed measures of the community in which the respondent lived. These variables are described in detail above.
Table 12-6 reports OLS association estimates on MI. When each type of social activity is included in the model together, all coefficients on social activities are positively related to MI but are statistically insignificant. MI is positively associated but only at the 10% level with “any social activity.” Some of the lack of statistical significance on these individual measures of social activity may well be due to the relatively small sample size in the CHARLS pilot compared to other HRS surveys. While our main interest lies in the associations between cognition and social activity, we briefly discuss estimated relationships with the other variables in the model. For demographics, an older age and female are associated with a worse mental status. Both associations are statistically significant. Regional disparities already presented in the descriptive summary are confirmed in this table, but urban residence is no longer statistically significant when other variables are included. Similarly, number of relatives (children or siblings) is not associated with MI score when other variables are included. We have assumed that more relatives lead to more social interactions. The Chinese fertility rate has been lower in the more economically developed areas, resulting in fewer children and siblings in urban areas, but our results suggest no strong effect on elderly cognition will follow.
MI is highly influenced by all SES factors. Compared with those who are illiterate, people with some education have a better mental status, which is consistent with the hypothesis that education is a determinant factor of the heterogeneity in cognitive functions in old age (Leibovici et al., 1996). The results also imply that higher education is related to higher MI scores, as the size of coefficients become increasingly larger moving from lower levels to higher ones. As expected, household expenditure is positively associated with MI.
With a few exceptions community-level variables are not statistically significant. Among the few that are significant, better mental intactness is associated with shorter distance between community center and the most-commonly used middle school and/or a library and a higher number of bus lines. The share of female population exhibits a positive sign, even though the female dummy is negatively associated with cognition. We
TABLE 12-6 OLS Analysis of Effects of SA on MI
| Dependent Variable: Mental Intactness (0-11) | ||||
| Independent Variables | (1) | (2) | ||
| Social Activities (no participation omitted) | ||||
| Interacting with friends | 0.093 | (0.086) | ||
| Playing Mahjong, chess, or cards | 0.032 | (0.107) | ||
| Other social activities | 0.153 | (0.144) | ||
| Any of the above activities | 0.175** | (0.082) | ||
| Demographics | ||||
| Age (45+) | 0.129*** | (0.048) | 0.128*** | (0.047) |
| Age squared/100 | -0.135*** | (0.039) | -0.135*** | (0.038) |
| Female | -0.508*** | (0.089) | -0.499*** | (0.087) |
| Urban | 0.110 | (0.115) | 0.107 | (0.115) |
| Zhejiang | 0.732*** | (0.145) | 0.723*** | (0.145) |
| No. of children | 0.058* | (0.034) | 0.059* | (0.034) |
| No. of siblings | -0.012 | (0.021) | -0.012 | (0.021) |
| SES Education (illiterate omitted) |
||||
| Sishu/home school and below | 1.293*** | (0.115) | 1.297*** | (0.115) |
| Elementary school | 1.497*** | (0.120) | 1.498*** | (0.120) |
| Middle school | 1.808*** | (0.137) | 1.812*** | (0.136) |
| High school and above | 2.262*** | (0.160) | 2.273*** | (0.158) |
| Log PCE | 0.130** | (0.052) | 0.128** | (0.051) |
| Community | ||||
| % of female | 0.021*** | (0.007) | 0.021*** | (0.007) |
| # of big surnames | -0.036 | (0.038) | -0.036 | (0.038) |
| # of kindergartens | 0.069* | (0.038) | 0.068* | (0.038) |
| Distance from kindergarten | 0.004 | (0.007) | 0.004 | (0.007) |
| # of primary schools | 0.057 | (0.121) | 0.056 | (0.121) |
| Distance from primary school | 0.112* | (0.058) | 0.112* | (0.058) |
| # of middle schools | -0.005 | (0.137) | -0.000 | (0.137) |
| Distance from middle school | -0.061*** | (0.018) | -0.061*** | (0.018) |
| # of senior high schools | -0.132 | (0.249) | -0.131 | (0.249) |
| Distance from senior high school | -0.001 | (0.005) | -0.001 | (0.005) |
| # of post offices | 0.020 | (0.153) | 0.020 | (0.152) |
| Distance from post office | 0.002 | (0.013) | 0.003 | (0.013) |
| # of libraries | 0.095 | (0.078) | 0.093 | (0.078) |
| Distance from the library | -0.012** | (0.005) | -0.012** | (0.005) |
| # of theatres | -0.179 | (0.186) | -0.164 | (0.186) |
| Distance from the theatre | -0.005 | (0.004) | -0.004 | (0.004) |
| # of nursing homes | 0.046 | (0.171) | 0.037 | (0.171) |
| Distance from nursing home | 0.006* | (0.003) | 0.007* | (0.003) |
| # of bus lines | 0.023* | (0.012) | 0.024** | (0.012) |
| Distance from bus line | 0.009 | (0.010) | 0.009 | (0.010) |
| Distance from train station | 0.000 | (0.001) | 0.001 | (0.001) |
| % of people having telephones | 0.001 | (0.002) | 0.001 | (0.002) |
| % of people having cellphones | 0.000 | (0.002) | 0.000 | (0.002) |
| Log public expenditure during the past year | -0.000 | (0.009) | -0.000 | (0.009) |
| Log per capita income | -0.015 | (0.060) | -0.015 | (0.060) |
| Whether the medical care is poor | -0.528 | (0.346) | -0.527 | (0.346) |
| Observations | 1,873 | 1,873 | ||
| R-squared | 0.397 | 0.397 | ||
NOTE: Standard errors in parentheses.* denotes p < 0.1; ** p < 0.05; *** p < 0.01.
SOURCE: Data from CHARLS 2008 Pilot.
think that the female population share represents the level of economic and social conditions in local areas. As shown in Table 12-5, although the share of female population is normal overall (50.1%), the maximum share reaches 53.3% and the lowest 48.6%. The unbalanced gender ratio is due to two reasons. First, in areas of longer life expectancy, women outlive men to create a higher ratio of females in the population. Second, in less developed areas where sons are valued more than daughters, sex-selective abortion produced highly skewed gender ratio among the younger population (Ebenstein, 2010). In both cases, a higher ratios of females is associated with better life conditions, which may be positively correlated with community cognition levels. Other community-level variables may not be able to fully capture these regional disparities. With prefecture fixed effects (not shown), the significance of percentage female disappears, supporting the hypotheses here.9
Table 12-7 illustrates a parallel OLS association estimation in which EM is regressed on variables representing social activities and the same set of other control variables included in the MI model.10 Both any social activity participation collectively and interacting with friends or playing card games are strongly statistically associated with EM. In addition, in the second model that includes the single measure of participation in any social activity it is strongly related to our measure of episodic memory.
Looking next at the control variables, once again memory increases with age at a decreasing rate. Memory level reaches its peak at 47 ( = (0.134 * 100)/(2 * 0.142)) years of age, after which it starts declining. Unlike the disparity between men and women for mental intactness, there is generally no sex difference for EM and no statistically significant relationship with the number of relatives. All regional measures—urban and province—are also not significant, suggesting that the other covariates (mostly likely education and income) pick up the regional disparities displayed in the descriptive tables. Once again, education and log PCE are strongly related to our cognitive measure—in this case, episodic memory.
From the bottom panel, most community-level variables are statistically insignificant. Similar to the prior table, distance between community center and most-commonly used middle school is negatively correlated with episodic memory. Episodic memory is positively associated with the number of kindergartens in the community. These results indicate that availability and access to education resources may play important roles in improving people’s mental health. Taking account of unobserved
____________
9 A prefecture is an administrative district that is between province and county or county-level city.
10 As the two dependent variables have different missing values, observations of these two regressions are slightly different.
TABLE 12-7 OLS Analysis of Effects of SA on EM
| Dependent Variable: Episodic Memory (0-10) | ||||
| Independent Variables | (1) | (2) | ||
| Social Activities (no participation omitted) | ||||
| Interacting with friends | 0.222** | (0.088) | ||
| Playing Mahjong, chess, or cards | 0.459*** | (0.110) | ||
| Other social activities | 0.186 | (0.149) | ||
| Any of the above activities | 0.404*** | (0.084) | ||
| Demographics | ||||
| Age (45+) | 0.133*** | (0.049) | 0.134*** | (0.049) |
| Age squared/100 | -0.140*** | (0.040) | -0.142*** | (0.040) |
| Female | 0.036 | (0.091) | 0.004 | (0.090) |
| Urban | 0.157 | (0.118) | 0.155 | (0.118) |
| Zhejiang | -0.191 | (0.147) | -0.196 | (0.147) |
| No. of children | -0.028 | (0.035) | -0.026 | (0.035) |
| No. of siblings SES |
0.000 | (0.022) | -0.002 | (0.022) |
| Education (illiterate omitted) | ||||
| Sishu/home school and below | 0.610*** | (0.118) | 0.632*** | (0.118) |
| Elementary school | 0.866*** | (0.123) | 0.877*** | (0.123) |
| Middle school | 1.541*** | (0.141) | 1.562*** | (0.140) |
| High school and above | 1.508*** | (0.165) | 1.564*** | (0.163) |
| Log PCE | 0.160*** | (0.053) | 0.169*** | (0.052) |
| Community | ||||
| % of female | 0.012 | (0.007) | 0.013* | (0.007) |
| # of big surnames | 0.085** | (0.039) | 0.089** | (0.039) |
| # of kindergartens | 0.067* | (0.039) | 0.068* | (0.039) |
| Distance from kindergarten | -0.006 | (0.007) | -0.006 | (0.007) |
| # of primary schools | -0.008 | (0.124) | -0.006 | (0.124) |
| Distance from primary school | 0.051 | (0.060) | 0.047 | (0.060) |
| # of middle schools | -0.069 | (0.142) | -0.035 | (0.142) |
| Distance from middle school | -0.041** | (0.018) | -0.040** | (0.018) |
| # of senior high schools | -0.002 | (0.260) | -0.021 | (0.261) |
| Distance from senior high school | 0.002 | (0.005) | 0.002 | (0.005) |
| # of post offices | 0.224 | (0.155) | 0.203 | (0.155) |
| Distance from post office | -0.006 | (0.013) | -0.007 | (0.013) |
| # of libraries | 0.146* | (0.081) | 0.153* | (0.081) |
| Distance from the library | 0.005 | (0.006) | 0.005 | (0.006) |
| # of theatres | -0.126 | (0.190) | -0.112 | (0.190) |
| Distance from the theatre | -0.005 | (0.005) | -0.006 | (0.005) |
| # of nursing homes | -0.228 | (0.176) | -0.248 | (0.177) |
| Distance from nursing home | 0.001 | (0.004) | 0.002 | (0.004) |
| # of bus lines | 0.004 | (0.013) | 0.004 | (0.013) |
| Distance from bus line | 0.006 | (0.010) | 0.006 | (0.010) |
| Distance from train station | 0.000 | (0.001) | 0.001 | (0.001) |
| % of people having telephones | 0.003 | (0.002) | 0.003 | (0.002) |
| % of people having cellphones | -0.001 | (0.002) | -0.001 | (0.002) |
| Log public expenditure during the past year | -0.019** | (0.009) | -0.018** | (0.009) |
| Log per capita income | 0.136** | (0.061) | 0.142** | (0.061) |
| Whether the medical care is poor | 0.041 | (0.356) | 0.041 | (0.356) |
| Observations | 1,901 | 1,901 | ||
| R-squared | 0.279 | 0.276 | ||
NOTE: Standard errors in parentheses.* denotes p < 0.1; **
SOURCE: Data from CHARLS 2008 Pilot.
prefecture level variations in culture, climate, and geographic factors that may affect cognition, we also estimated prefecture fixed effects models. The results (not shown) are remarkably similar to those contained in Tables 12-6 and 12-7. The significance and magnitudes of coefficients on SA do not change much.
Summarizing our results, OLS association regressions with multiple SA measures provide evidence of a positive correlation between cognitive functioning and participation in social activities. Despite the salient association, closer scrutiny is needed because OLS regressions may be biased due to the endogeneity of people’s participation decisions, an issue presented in the next section.
THE ASSOCIATION OF COMMUNITY FACILITIES AND COGNITIVE FUNCTION
OLS estimates of the association between social activities and cognitive functions do not have a causal interpretation as unobserved heterogeneity may introduce a correlation between social activities and cognitive function. Sources of this unobserved heterogeneity may include aspects of the environment, people’s preferences, and personalities. While the natural environment is controllable to some extent by including community-level variables in the models, the other sources of individual heterogeneity are not easy to control. Although we include a rich set of individual and spatial variables in our model, they cannot be perfectly controlled for. Another possible source of bias is reverse causality—taking part in social activities requires some minimum cognitive skills or people with cognitive impairment deliberately seek social activities as therapy for slowing down the decline.
One option to get around this problem is to find instrumental variables. We have a set of instruments in mind, i.e., the availability of community facilities that accommodate social gatherings. For example, in 1995, the Chinese government started the Universal Exercise Plan (1995-2010) encouraging Chinese people to participate in physical activities. In the past decade, especially during pre-Olympic years, enforcement of the plan was strengthened. Accompanying this was a larger governmental investment in community recreational facilities/organizations and advocacy for participating in exercises. This development is different across community/village because of variation in the capacity for building facilities and the strength of local leaders. Because there is no evidence that this difference is directly related to cognition function, these variables can serve as candidates for IVs for social activities. However, probably because the number of communities in our sample is relatively small, these variables do not pass weak instrument tests. Thus, instead of
directly tackling the causal relationship, we opt to estimate OLS reduced form equations to test whether these variables are associated with cognitive function.
The CHARLS community survey contains information on whether a village/community has certain facilities/organizations shown on a list. There are 15 items on the list: (1) a basketball court, (2) a swimming pool, (3) outside exercising facilities, (4) outdoor sports facilities, (5) rooms for card games and chess games, (6) rooms for playing ping-pong, (7) calligraphy and painting associations, (8) other entertainment facilities, (9) dancing teams or other exercise organizations, (10) organizations for helping the elderly and the frail, (11) employment services, (12) healthcare organizations, (13) activity centers for elderly, (14) elderly associations, and (15) nursing homes.
The first variable of community facility, “outdoor facilities,” takes value 1 if the community has outdoor recreational facilities (1-4 on the list). Having outdoor facilities provide people with place(s) to gather. The second variable, “whether there are activity centers for the elderly” (item 13) is necessary for people to play Mahjong, chess, or cards, or participate in a club. The third variable is the dummy indicating whether the community has organizations that help the elderly and the handicapped (item 10). We also create a variable indicating whether the community has any of the three types of facilities. The items in the survey question not utilized include employment service, healthcare organizations, elderly associations, and nursing homes. Though important facilities and organizations, these items are omitted due to their possible direct impact on people’s cognitive health (for instance, employment services teach people job skills and knowledge that improves cognition, and healthcare organizations enhance mental intactness and cure cognitive diseases such as dementia). As the purpose of examining the facilities is to explore the effect of social activities on cognition, we only keep those that are likely to affect cognition through affecting social activities. The detailed distributions of these facility variables by residency and province are reported in Appendix Table 12-A1.
Table 12-3 depicts the relationship between facility variables and their corresponding SAs, showing that the facility variables are highly associated with SA participation among the elderly, consistent with the mechanisms discussed above. Tables 12-8 and 12-9 give the OLS reduced form estimates of the associations of community facilities and the two types of cognitive functions, MI and EM, respectively. Similarly as before, we employ two models in each table. Model 1 includes the three types of facilities separately, while Model 2 only the aggregate facility measure “any of the above facilities.” From Table 12-8, the facility measures do not significantly affect mental intactness, which is consistent with the
results in the OLS association estimation in Table 12-6, where almost all social activity measures lack significance on the correlation with mental intactness.
Table 12-9 replaces MI as the dependent variable with EM. As seen from the first model, having activity centers for the elderly is significantly (at 1% level) associated with better episodic memory, while the other two types of facilities are not. These results are also consistent with the OLS association estimates in Table 12-6 where we see significant (at 1% level) correlation between playing Mahjong, chess, or cards. The likely explanation is that having activity centers for the elderly allowing for more involvement in playing Mahjong, chess, or cards, which further promotes episodic memory. Accordingly, from the second model, we see significant correlation between any of the facilities and episodic memory, which is most likely driven by the effect of having activity centers for the elderly.
In sum, we interpret our results as providing some support for the hypothesis that taking part in social activities could help slow down the cognitive decline of the elderly. The results are consistent with findings from Glei et al. (2005) that employed a similar definition and was based on data from Taiwan, where the tradition of living arrangement is most similar. This indicates that social participation plays an important role even in a society where family members are more likely to live together, regardless of level of economic development. Our results also imply that providing more activity facilities in the community could be helpful to the cognitive health of the elderly as facilities involve more people in social activities. We are cautious in our interpretation since we do not directly estimate the causal effects especially in light of the relatively small sizes in the CHARLS pilot, which was fielded in only two provinces. Most sample sizes in the HRS network of surveys exceed 10,000 households, and China is a very heterogeneous country, which makes larger samples even more important. The availability of the full CHARLS survey, especially its panel, in a few years with much higher samples will help provide additional tests of our hypothesis.
CONCLUSIONS
With data from the 2008 CHARLS pilot, this chapter explores the relation between SA and cognitive outcomes for Chinese elderly aged 45 and older, where cognition is composed of two dimensions—MI and EM. There are several key limitations to our analysis. Most important, we are only able to examine two Chinese provinces with moderate sample sizes and must rely for now on cross-sectional analysis. A larger sample size spanning the entire country would not only address the issue of representativeness, but also provide greater variation across communities—the
TABLE 12-8 OLS Reduced Form Analysis of Community Facilities on MI
| Dependent Variable: Mental Intactness (0-11) | ||||
| Independent Variables | (1) | (2) | ||
|
Community Facilities |
||||
|
Outdoor facilities |
0.042 | (0.166) | ||
|
Activity centers for the elderly |
0.028 | (0.125) | ||
|
Organizations for helping the elderly and the handicapped |
-0.069 | (0.128) | ||
|
Any of the above |
-0.046 | (0.128) | ||
|
Demographics |
||||
|
Age (45+) |
0.128*** | (0.048) | 0.129*** | (0.048) |
|
Age squared/100 |
-0.135*** | (0.039) | -0.135*** | (0.039) |
|
Female |
-0.499*** | (0.087) | -0.499*** | (0.087) |
|
Urban |
0.121 | (0.117) | 0.117 | (0.115) |
|
Zhejiang |
0.736*** | (0.166) | 0.760*** | (0.146) |
|
No. of children |
0.056 | (0.035) | 0.056 | (0.035) |
|
No. of siblings |
-0.011 | (0.021) | -0.011 | (0.021) |
|
Education (illiterate omitted) |
||||
|
Sishu/home school and below |
1.294*** | (0.115) | 1.296*** | (0.115) |
|
Elementary school |
1.504*** | (0.120) | 1.506*** | (0.120) |
|
Middle school |
1.827*** | (0.137) | 1.826*** | (0.137) |
|
High school and above |
2.313*** | (0.158) | 2.311*** | (0.158) |
|
Log PCE |
0.135*** | (0.052) | 0.139*** | (0.051) |
|
Community |
||||
|
% of female |
0.022*** | (0.007) | 0.022*** | (0.007) |
|
# of big surnames |
-0.039 | (0.039) | -0.038 | (0.038) |
|
# of kindergartens |
0.075* | (0.041) | 0.069* | (0.038) |
|
Distance from kindergarten |
0.004 | (0.007) | 0.004 | (0.007) |
|
# of primary schools |
0.053 | (0.123) | 0.056 | (0.121) |
|
Distance from primary school |
0.101* | (0.060) | 0.113* | (0.060) |
|
# of middle schools |
0.016 | (0.141) | 0.001 | (0.137) |
|
Distance from middle school |
-0.062*** | (0.018) | -0.062*** | (0.018) |
|
# of senior high schools |
-0.189 | (0.277) | -0.133 | (0.250) |
|
Distance from senior high school |
-0.001 | (0.005) | -0.001 | (0.005) |
|
# of post offices |
0.012 | (0.160) | 0.037 | (0.155) |
|
Distance from post office |
0.003 | (0.013) | 0.002 | (0.013) |
|
# of libraries |
0.092 | (0.079) | 0.089 | (0.079) |
|
Distance from the library |
-0.012** | (0.006) | -0.012** | (0.005) |
|
# of theatres |
-0.165 | (0.187) | -0.173 |
(0.186) |
|
Distance from the theatre |
-0.004 | (0.004) | -0.005 | (0.004) |
|
# of nursing homes |
0.032 | (0.176) | 0.049 | (0.173) |
|
Distance from nursing home |
0.007* | (0.004) | 0.007* | (0.003) |
|
# of bus lines |
0.025* | (0.013) | 0.022* | (0.012) |
|
Distance from bus line |
0.007 | (0.010) | 0.008 | (0.010) |
|
Distance from train station |
0.000 | (0.001) | 0.000 | (0.001) |
|
% of people having telephones |
0.001 | (0.002) | 0.001 | (0.002) |
|
% of people having cellphones |
0.000 | (0.002) | 0.000 | (0.002) |
|
Log public expenditure during the past year |
0.000 | (0.009) | -0.000 | (0.009) |
|
Log per capita income |
-0.012 | (0.067) | -0.010 | (0.061) |
|
Whether the medical care is poor |
-0.552 | (0.353) | -0.519 | (0.346) |
|
Observations |
1,873 | 1,873 | ||
|
R-squared |
0.396 | 0.396 | ||
NOTE: Standard errors in parentheses.* denotes p < 0.1; ** p < 0.05; *** p < 0.01.
SOURCE: Data from CHARLS 2008 Pilot.
TABLE 12-9 OLS Reduced Form Analysis of Effects of Community Facilities on EM
| Dependent Variable: Episodic Memory (0-10) | ||||
| Independent Variables | (1) | (2) | ||
|
Community Facilities |
||||
|
Outdoor facilities |
0.266 | (0.171) | ||
|
Activity centers for the elderly |
0.408*** | (0.128) | ||
|
Organizations for helping the elderly and the handicapped |
-0.022 | (0.132) | ||
|
Any of the above |
0.540*** | (0.131) | ||
|
Demographics |
||||
|
Age (45+) |
0.129*** | (0.049) | 0.130*** | (0.049) |
|
Age squared/100 |
-0.139*** | (0.040) | -0.141*** | (0.040) |
|
Female |
-0.010 | (0.090) | -0.014 | (0.090) |
|
Urban |
0.142 | (0.120) | 0.133 | (0.119) |
|
Zhejiang |
-0.239 | (0.168) | -0.231 | (0.149) |
|
No. of children |
-0.019 | (0.036) | -0.018 | (0.036) |
| No. of siblings SES |
0.001 | (0.022) | 0.002 | (0.022) |
|
Education (illiterate omitted) |
||||
|
Sishu/home school and below |
0.615*** | (0.119) | 0.614*** | (0.119) |
|
Elementary school |
0.887*** | (0.123) | 0.878*** | (0.123) |
|
Middle school |
1.570*** | (0.141) | 1.544*** | (0.141) |
|
High school and above |
1.635*** | (0.163) | 1.631*** | (0.162) |
|
Log PCE |
0.183*** | (0.053) | 0.184*** | (0.052) |
|
Community |
||||
|
% of female |
0.010 | (0.007) | 0.009 | (0.007) |
|
# of big surnames |
0.068* | (0.040) | 0.076* | (0.039) |
|
# of kindergartens |
0.091** | (0.042) | 0.046 | (0.039) |
|
Distance from kindergarten |
-0.005 | (0.008) | -0.005 | (0.008) |
|
# of primary schools |
0.037 | (0.126) | 0.028 | (0.124) |
|
Distance from primary school |
0.017 | (0.061) | -0.021 | (0.062) |
|
# of middle schools |
0.045 | (0.146) | -0.034 | (0.142) |
|
Distance from middle school |
-0.037** | (0.019) | -0.033* | (0.019) |
|
# of senior high schools |
-0.359 | (0.289) | -0.131 | (0.262) |
|
Distance from senior high school |
0.002 | (0.005) | 0.006 | (0.005) |
|
# of post offices |
0.051 | (0.163) | 0.088 | (0.158) |
|
Distance from post office |
-0.002 | (0.013) | -0.002 | (0.013) |
|
# of libraries |
0.171** | (0.081) | 0.191** | (0.082) |
|
Distance from the library |
0.005 | (0.006) | 0.006 | (0.006) |
|
# of theatres |
-0.111 | (0.192) | -0.178 | (0.190) |
|
Distance from the theatre |
-0.006 | (0.005) | -0.008* | (0.005) |
|
# of nursing homes |
-0.390** | (0.182) | -0.336* | (0.178) |
|
Distance from nursing home |
0.001 | (0.004) | 0.002 | (0.004) |
|
# of bus line |
0.003 | (0.013) | 0.006 | (0.013) |
|
Distance from bus line |
0.001 | (0.010) | 0.003 | (0.010) |
|
Distance from train station |
0.001 | (0.001) | 0.001 | (0.001) |
|
% of people having telephones |
0.002 | (0.002) | 0.002 | (0.002) |
|
% of people having cellphones |
0.000 | (0.002) | 0.001 | (0.002) |
|
Log public expenditure during the past year |
-0.017* | (0.009) | -0.016* | (0.009) |
|
Log per capita income |
0.099 | (0.068) | 0.101 | (0.062) |
|
Whether the medical care is poor |
-0.071 | (0.364) | -0.003 | (0.357) |
|
Observations |
1,901 | 1,901 | ||
|
R-squared |
0.272 | 0.274 | ||
NOTE: Standard errors in parentheses.* denotes p < 0.1; ** p < 0.05; *** p < 0.01.
SOURCE: Data from CHARLS 2008 Pilot.
analytical center of our analysis. Panel samples will aid in identification of causal pathways.
Our major findings are roughly half of Chinese aged 45 and older take part in social activities. Second, participation in social activities is highly dependent on respondents’ socioeconomic status and community environment. Third, OLS association results show that playing Mahjong, chess, or card games and interacting with friends are significantly related to episodic memory, both individually and taken as a whole (any of the three activities); individually, they are not related to mental intactness, while taken as a whole they are. Fourth, having an activity center in the community is significantly related to higher episodic memory but has no relation to mental intactness. These results point to a possible causal relationship between social activities and cognitive function, especially in strengthening short-term memory. Our research suggests that an effective way to maintain cognitive abilities at advanced ages may be to improve community facilities, such as by providing Mahjong rooms or other entertainment facilities.
APPENDIX TABLE 12-A1 Distribution of Community Facilities
| Region | Province | |||||
| Instrumental Variables | All | Urban | Rural | Zhejiang | Gansu | |
| Outdoor facilities | 0.101 | 0.161 | 0.053 | 0.080 | 0.126 | |
| (.301) | (.368) | (.223) | (.271) | (.332) | ||
| Activity centers for the elderly | 0.496 | 0.698 | 0.335 | 0.753 | 0.187 | |
| (.500) | (.459) | (.472) | (.431) | (.390) | ||
| Organizations for helping the | 0.307 | 0.528 | 0.130 | 0.335 | 0.272 | |
| elderly and the handicapped | (.461) | (.500) | (.337) | (.472) | (.445) | |
| For any SA: Any of the facilities | 0.591 | 0.824 | 0.405 | 0.814 | 0.322 | |
| above | (.492) | (.381) | (.491) | (.389) | (.468) | |
| Number of facilities | 0.904 | 1.387 | 0.518 | 1.168 | 0.585 | |
| (.901) | (.901) | (.690) | (.770) | (.943) | ||
| Observations | 2,293 | 1,017 | 1,276 | 1,253 | 1,040 | |
NOTE: Standard errors in parentheses.* denotes p < 0.1; ** p < 0.05; *** p < 0.01.
SOURCE: Data from CHARLS 2008 Pilot.
REFERENCES
Allaire, J.C., and M. Marsiske. (1999). Everyday cognition: Age and intellectual ability correlates. Psychology and Aging 14(4):627-644. Available: http://www.ncbi.nlm.nih.gov/pmc/articles/PMC2904910/.
China Center for Economic Research, Peking University. (2008). China Health and Retirement Longitudinal Survey. Available: http://charls.ccer.edu.cn/charls/data.asp.
Ebenstein, A. (2010). The “missing girls” of China and the unintended consequences of the one child policy. Journal of Human Resources 45:87-115.
Engelhardt, H., I. Buber, V. Skirbekk, and A. Prskawetz. (2010). Social involvement, behavioural risks and cognitive functioning among the aged. Ageing and Society 30. doi: 10.1017/S0144686X09990626. Available: http://www.share-austria.at/fileadmin/user_upload/articles/2010_Cognitivefunctioning.pdf.
Glei, D.A., D.A. Landau, N. Goldman, Y-L. Chuang, G. Rodríguez, and M. Weinstein. (2005). Participating in social activities helps preserve cognitive function. International Journal of Epidemiology 34(4):864-871. Available: http://www.ncbi.nlm.nih.gov/pubmed/15764689.
Hauser, R.M. (2009). Causes and consequences of cognitive functioning across the life course. Educational Researcher 39(2):95-109.
Hsu, H.C. (2007). Does social participation by the elderly reduce mortality and cognitive impairment? Aging & Mental Health 11(6):699-707.
Lei, X., Y. Hu, J.J. McArdle, J.P. Smith, and Y. Zhao. (2011). Gender Differences in Cognition Among Older Adults in China. Working Paper #WR-881. Available: http://www.rand.org/content/dam/rand/pubs/working_papers/2011/RAND_WR881.pdf.
Leibovici, D., K. Ritchie, B. Ledesert, and D. Touchon. (1996). Does education level determine the course of cognitive decline? Age and Ageing 25:392-397.
Levy, R. (1994). Aging-associated cognitive decline. International Psychogeriatrics 663-668. Available: http://journals.cambridge.org/action/displayAbstract?fromPage=online&aid=272198.
Löckenhoff, C.E., and L.L. Carstensen. (2004). Socio-emotional selectivity theory, aging, and health: The increasingly delicate balance between regulating emotions and making tough choices. Journal of Personality 72(6):1,395-1,424. Available: http://www.ncbi.nlm.nih.gov/pubmed/15509287.
McArdle, J.J., J.P. Smith, and R. Willis. (2011). Cognition and economic outcomes in the Health and Retirement Survey. Pp. 209-236 in Explorations in the Economics of Aging, D. Wise (Ed.). Chicago: University of Chicago Press.
Schaie, K.W. (1994). The course of adult intellectual development. American Psychologist 49:304-313.
Smith, J.P., Y. Shen, J. Strauss, Z. Yang, and Y. Zhao. (2012). The effects of childhood health on adult health and SES in China. Economic Development and Cultural Change.
Strauss, J., and D. Thomas, D. (2008). Health over the life course. In Handbook of Development Economics, Volume 4, T.P. Schultz and J. Strauss (Eds.). Amsterdam: North Holland Press.
Tilvis, R.S., M.H. Kähönen-Väre, J. Jolkkonen, J. Valvanne, K.H. Pitkala, and T.E. Strandberg. (2004). Predictors of cognitive decline and mortality of aged people over a 10-year period. The Journals of Gerontology. Series A, Biological Sciences and Medical Sciences 59(3): 268-274. Available: http://www.ncbi.nlm.nih.gov/pubmed/15031312.
Verhaegen, P., and T.A. Salthouse. (1997). Meta-analyses of age-cognition relations in adulthood. Estimates of linear and nonlinear age effects and structural models. Psychological Bulletin 122(3):231-249.
Wang, H.X., A. Karp, B. Winblad, and L. Fratiglioni. (2002). Decreased risk of dementia: A longitudinal study from the Kungsholmen Project. American Journal of Epidemiology 155(12):1,081-1,087.
Yip, W., S.V. Subramanian, A.D. Mitchell, T.S.L. Dominic, J. Wang, and I. Kawachi. (2007). Does social capital enhance health and well-being? Evidence from rural China. Social Science & Medicine 64:35-49.
Zhao, Y., J. Strauss, A. Park, Y. Shen, and Y. Sun. (2009). Chinese Health and Retirement Longitudinal Study, Pilot, User’s Guide. Peking: Peking University, National School of Development.
Zunzunegui, M-V., B.E. Alvarado, T. Del Ser, and A. Otero. (2003). Social networks, social integration, and social engagement determine cognitive decline in community-dwelling Spanish older adults. The Journals of Gerontology. Series B, Psychological Sciences and Social Sciences 58(2):S93-S100. Available: http://www.ncbi.nlm.nih.gov/pubmed/12646598.
This page is intentionally left blank.


