
Healthcare and Insurance Among the Elderly in China: Evidence from the CHARLS Pilot1
John Strauss, Hao Hong, Xiaoyan Lei, Lin Li, Albert Park, Li Yang, and Yaohui Zhao
We are concerned in this chapter with measuring health insurance in China: who has it, which types, what are the key parameters of the insurance, and who uses inpatient and outpatient facilities, by using new data from the China Health and Retirement Longitudinal Study (CHARLS) pilot. These are important issues in China now, with many changes instituted recently related to the programs’ availability and generosity.
In very recent years, there has been a large set of reforms begun regarding health insurance and healthcare, and a growing literature has analyzed these reforms (see, for instance, a recent issue of Health Economics devoted to this topic, Wagstaff et al., 2009). The older rural system, the Rural Cooperative Medical System, collapsed with the advent of the newer Household Responsibility System (Brown and Theoharides, 2009; Wagstaff et al., 2009). Because of this massive change, health insurance was virtually nonexistent in rural areas after the economic reforms and before 2003.
In general, urban health insurance coverage was directly tied to
____________
1 Comments from two referees, the editors, Gordon Liu, Richard Suzman, and David Weir are greatly appreciated. An earlier version was presented at the 2nd International Conference on Health and Retirement in China, July 2009, Beijing. The research was supported by the National Institute on Aging (Grant Number R21AG031372), Natural Science Foundation of China (Grant Numbers 70773002 and 70910107022), the World Bank (Contract 7145915), and the Fogarty International Center (Grant Number R03TW008358). The content is solely the responsibility of the authors and does not necessarily represent the official views of any of the funders.
formal employment status, with coverage of other family members not provided. Previous government and state-owned enterprise insurance programs have been subsumed by the Basic Medical Insurance program in urban areas, which is funded by employer and employee contributions (6-10% and 2% of wages, respectively) split between individual medical savings accounts and socially pooled accounts. Growing informalization of the urban labor market caused by the closing of many State Owned Enterprises starting in the late 1980s led to falling health insurance coverage rates in urban areas. In 2005, only 47% of those living in cities and 33% of those living in towns were covered by health insurance (World Bank, 2009). The problem of low health insurance coverage was exacerbated by rising healthcare costs (which were then not covered) caused in part because doctors had a strong incentive to overprescribe treatments and medicines to generate income (World Bank, 2009).
Recent reforms have aimed to increase health insurance coverage of the population. In urban areas, coverage has been extended to the non-employed (e.g., students, children, elderly, those unemployed or out of the labor force) by a new voluntary Urban Resident Basic Medical Insurance Scheme, which was introduced in September 2007 in 79 cities. It enrolled 43 million people by year-end 2007, with plans to expand to 229 cities in 2008 (Lin, Liu, and Chen, 2009; World Bank, 2009).
The New Cooperative Medical Scheme (NCMS), a new rural health insurance program, was established on a pilot basis in 2003 and expanded nationally over time. When the program began, the health insurance coverage rate in rural China was about 20%, but by the end of 2007, the NCMS had grown to reach 2,451 counties (86% of all counties nationwide) (World Bank, 2009). The program is underwritten by both the central and provincial governments, but the county-unit governments have the responsibility for setting parameters of the program, such as user fees and premiums and reimbursement rates. Many counties have fixed the fees at 10 Yuan per person per year, supplemented with a local government contribution of at least 20 Yuan per person, plus a central government contribution also typically of 20 Yuan per person (Brown and Theoharides, 2009).2 However, a number of concerns have also been
____________
2 For the premiums, the central government contributes a certain amount and also has a minimum requirement of how much the local government should pay. The amount has increased over time: From 2003-2004, the central government paid 10 Yuan/person/year and required the local government to pay at least 10; in 2005-2007, these numbers were 20; in 2008-2009, they were raised to 40, and in 2010, to 60. The actual contributions of the local governments differ depending on their economic capability, but they must satisfy the minimum requirement. The minimum individual contribution was 10 Yuan in 2003-2007; it was raised to 20 in 2008, and then to 30, in 2010. It was waived for very poor households such as those receiving Wubao, a welfare program.
raised about the new program, including large differences across counties in coverage (which hospitals permit coverage and for what) and percentage of reimbursement. Discussion has ensued about low and unreliable reimbursement procedures and lack of coverage of outpatient expenses (Brown and Theoharides, 2009; World Bank, 2009; Yi et al., 2009). Yi et al. (2009) found lower reimbursement rates for higher medical costs in the five provinces their study covers, which means that major medical bills are not well covered. In April 2009, the Chinese government announced a plan to spend 850 billion Yuan over the next three years to improve the healthcare system, with a goal of covering 90% of the population with basic health insurance by 2011.
Regional variations in the implementation and timing of pension, health insurance, and social assistance programs provide opportunities to study the impact of policies and programs. China is in a critical phase of designing and reforming its social insurance programs, and CHARLS will be able to track whether programs are reaching the elderly and evaluate how such programs are affecting the behavior and welfare of the elderly. In this chapter we take a first look at the CHARLS pilot data from Zhejiang and Gansu provinces, fielded in the summer of 2008.
We find that the overwhelming majority of our respondents over age 45 report having health insurance of some kind, particularly the new rural insurance scheme. Premiums that are paid by individuals are low in rural areas and higher in urban areas, which reflect the higher degree of government subsidization in rural areas. Most importantly, the schemes as they have been instituted so far cover mostly inpatient use, not outpatient. Reimbursement rates for inpatient services range from 30-40% in rural and urban areas, respectively. These new schemes are not covering catastrophic illnesses, at least not on average, and have no major medical insurance component. Incomes are very highly correlated with inpatient service use, and having insurance is also positively correlated with inpatient use for men.
In the rest of this chapter, we briefly discuss some data issues and the results, starting with the insurance results and then utilization. Finally, we offer some conclusions.
DATA
We use the CHARLS pilot data, which is described in Zhao et al. (2009). CHARLS was designed after the Health and Retirement Study in the United States as a broad-purposed social science and health survey of the elderly in Zhejiang and Gansu provinces. These provinces were chosen because they represented the extremes of living standards in China at the time: Zhejiang being among the richest and fastest-growing
provinces and Gansu being the poorest. The pilot survey was conducted in July-September 2008. The CHARLS pilot sample is representative of people aged 45 and older, and their spouses, living in households in Gansu and Zhejiang provinces.
The CHARLS pilot sample was drawn in four stages. In each province, all county-level units were stratified by whether they were urban districts (qu) or rural counties (xian), and by region within each classification. Both urban districts and rural counties can contain both urban and rural communities, but the concentration of urban and rural populations is quite different in the two. With a goal of sampling 16 county-level units per province, the number of counties to be sampled in each stratum was determined based on population size. Before the pilot survey, the Beijing CHARLS office first obtained a list of county units and their populations in each of the provinces from official statistics. Counties were randomly selected within each stratum with probabilities proportionate to size as measured by population.
After the county units were chosen, the National Bureau of Statistics helped us to sample villages and communities within county units using recently updated village-level population data. As primary sampling units (PSUs), our sample used administrative villages (cun) in rural areas and neighborhoods (shequ), which comprise one or more former resident committees (juweihui), in urban areas. We selected three PSUs within each county-level unit, using PPS (probabilities proportional to size) sampling. As noted above, rural counties contain both rural villages and urban neighborhoods, and it is also possible for urban districts to contain rural administrative villages.
In each PSU, we selected a sample of dwellings from our frame, which was constructed based on maps prepared by advance teams with the support of local informants. For rural villages, in many cases the lead persons on the advance teams were able to use maps drafted for the agricultural census in 2006 as a starting point, which they updated in consultation with local leaders. For urban communities, existing building maps were frequently used as the basis for the frame. All buildings in each PSU were numbered, and dwellings within each building were listed and coded using standardized methods. The advanced team verified that all buildings in the PSU had been properly identified and that dwelling units within multidwelling buildings had been correctly coded before choosing the sample of households.
Once the sampling frame for a PSU was completed and entered into the lead person’s computer, the team used CAPI (computer-assisted personal interviewing) to sample the households automatically. The number of households sampled was greater than the targeted sample size of 16 households per PSU in anticipation of nonresponse and sampled
households not having any members aged 45 and older. The number of households sampled was 36 in urban PSUs and 30 in rural PSUs. We interviewed all age-eligible sample households in each PSU that were willing to participate in the survey, ultimately interviewing 1,570 households containing 2,685 respondents aged 45 and older and their spouses.
We use data on all respondents aged 45 and older.3 Tables and figures are weighted using individual sample weights.4 All figures are non-parametric and drawn using LOWESS. Regressions are run unweighted since the sample selection is independent of our dependent variables. All analyses are disaggregated by gender. Health outcomes have long been known to differ by gender, and they do for the elderly in China (see, for instance, Strauss et al., 2010). Hence, it is natural to explore whether health insurance coverage and healthcare utilization also differ by gender.
RESULTS
Insurance Coverage
In the five years before 2008, a major change began in terms of the availability of health insurance to the Chinese population. We can see this in Table 14-1, which shows the fraction of the men and women separately who claim they have some health insurance (public or private). Overall, 91% of our sample over 45 has some insurance. By age, the fraction with insurance stays fairly constant, with a slight drop among those over 75 years. There are no major differences between men and women. Among those who do not have insurance, a small percentage, 15% of men and 13% of women, lost their insurance recently,5 but most never had any after the collapse of the old system. Five years prior to 2008, very few people would have had insurance coverage, especially in rural areas.
We examine the different types of publicly provided insurance separately in Table 14-2, for men and women respectively. Three new public insurance programs had come into existence in the five years prior to 2008.6 The NCMS is designed for rural areas and is the most prevalent of the three. Two insurance schemes dominate urban areas: the Urban Employee Medical Insurance and the Urban Resident Basic Medical
____________
3 Spouses who are under 45 years old are dropped from this analysis.
4 Here we use the sample weights allowing for household nonresponse; see Zhao et al. (2009) for details.
5 In the CHARLS pilot, we asked respondents who did not have health insurance if they had lost any coverage.
6 Although there are other types of insurance in China, such as government medical insurance and private health insurance, these three types of insurance are the most common, so we only focused on them.
TABLE 14-1 Insurance Coverage, by Age and Gender
| Men | Women | All | ||||
| % | N | % | N | % | N | |
| 45-54 | 90.3 | 447 | 92.0 | 493 | 91.1 | 940 |
| (2.5) | (1.9) | (1.9) | ||||
| 55-64 | 94.3 | 423 | 93.4 | 404 | 93.8 | 827 |
| (1.6) | (1.9) | (1.6) | ||||
| 65-74 | 90.9 | 279 | 90.1 | 229 | 90.5 | 508 |
| (2.5) | (2.1) | (1.7) | ||||
| 75+ | 86.1 | 119 | 81.3 | 112 | 83.5 | 231 |
| (4.2) | (4.8) | (3.3) | ||||
| Total (45+) | 91.1 | 1,268 | 90.5 | 1,238 | 90.8 | 2,506 |
| (1.5) | (1.5) | (1.3) | ||||
NOTE: Standard errors in parentheses.
SOURCE: Authors’ calculations using CHARLS pilot data.
Insurance, with the former being more prevalent in our sample. The employee insurance is given mainly through employers, while the resident insurance is a public program provided through the community. As seen in Table 14-2, the rural insurance scheme is targeted to people with a rural hukou,7 not necessarily those living only in rural areas.8 While in rural areas there is little spillover from the rural to the urban insurance schemes, in urban areas many residents have the rural insurance because they are farmers and still have rural hukou. For example, Table 14-2 Panel B shows that 48.7% of men in urban areas have NCMS insurance, while only 7.4% have it for those with an urban hukou. Almost no difference exists for men in having some insurance by rural or urban area, or by rural or urban hukou. For women, Table 14-2 Panel C shows that having a rural hukou makes it a little more likely that they will have some coverage. Women with an urban hukou are much more likely to have the Urban Resident Basic Medical Insurance, and men almost only have the Urban Employee Medical Insurance.
If we define a migrant as a person whose hukou is in a different county than where he or she currently resides, migrants are severely
____________
7 Hukou is a form of registration, attached to an area and agricultural or nonagricultural. People may live in urban areas with an agricultural, or rural, hukou, because many formerly rural areas have become urban. Migrants typically have their hukou in their place of origin. Not having a hukou for one’s place of residence results in some loss of public benefits.
8 The rural definition we use in this chapter is the State Bureau of Statistics (SBS) definition. Some of the SBS urban communities are in fact rural in nature, and many of their populations are farmers with rural hukou.
TABLE 14-2 Coverage of Different Insurance Types
| PANEL A Both Men and Women | ||||||
| Urban Employee Medical Insurance | Urban Resident Basic Medical Insurance | New Cooperative Scheme Medical Insurance | Other Insurances | Without Insurance | N | |
| Urban Hukou | 53.7 | 16.2 | 9.9 | 18.1 | 10.3 | 497 |
| (5.9) | (3.0) | (2.8) | (4.8) | (2.3) | ||
| Rural Hukou | 0.9 | 0.3 | 88.6 | 2.7 | 8.9 | 2,010 |
| (0.3) | (0.2) | (1.5) | (0.7) | (1.4) | ||
| Urban Area | 24.7 | 7.7 | 51.6 | 10.8 | 10.3 | 1,106 |
| (5.1) | (1.5) | (6.3) | (2.8) | (2.2) | ||
| Rural Area | 1.4 | 0.2 | 89.3 | 1.8 | 8.2 | 1,401 |
| (0.3) | (0.2) | (1.6) | (0.5) | (1.5) | ||
| Total | 12.4 | 3.7 | 71.5 | 6.1 | 9.2 | 2,507 |
| (2.8) | (0.8) | (3.6) | (1.5) | (1.3) | ||
| PANEL B Men | ||||||
| Urban Employee Medical Insurance | Urban Resident Basic Medical Insurance | New Cooperative Scheme Medical Insurance | Other Insurances | Without Insurance | N | |
| Urban Hukou | 63.0 | 11.4 | 7.4 | 18.3 | 7.9 | 268 |
| (5.8) | (2.6) | (2.3) | (3.5) | (2.2) | ||
| Rural Hukou | 1.1 | 0.4 | 87.4 | 3.5 | 9.2 | 1,001 |
| (0.4) | (0.3) | (1.8) | (1.2) | (1.6) | ||
| Urban Area | 30.2 | 5.7 | 48.7 | 11.6 | 9.2 | 541 |
| (6.1) | (1.4) | (6.1) | (2.4) | (2.5) | ||
| Rural Area | 2.2 | 0.4 | 87.0 | 2.8 | 8.8 | 728 |
| (0.6) | (0.4) | (1.9) | (0.8) | (1.7) | ||
| Total | 14.9 | 2.8 | 69.7 | 6.8 | 8.9 | 1,269 |
| (3.1) | (0.7) | (3.5) | (1.3) | (1.5) | ||
| PANEL C Women | ||||||
| Urban Employee Medical Insurance | Urban Resident Basic Medical Insurance | New Cooperative Scheme Medical Insurance | Other Insurances | Without Insurance | N | |
| Urban Hukou | 43.5 | 21.5 | 12.6 | 18.0 | 12.9 | 229 |
| (7.2) | (5.0) | (4.3) | (7.3) | (3.3) | ||
| Rural Hukou | 0.6 | 0.1 | 89.9 | 1.9 | 8.5 | 1,009 |
| (0.3) | (0.1) | (1.7) | (0.6) | (1.6) | ||
| Urban Area | 19.4 | 9.5 | 54.4 | 10.1 | 11.3 | 565 |
| (4.8) | (2.3) | (7.0) | (4.1) | (2.5) | ||
| Rural Area | 0.4 | 0.0 | 91.9 | 0.8 | 7.6 | 673 |
| (0.2) | (0.0) | (1.8) | (0.5) | (1.9) | ||
| Total | 9.8 | 4.7 | 73.4 | 5.4 | 9.5 | 1,238 |
| (2.7) | (1.2) | (4.2) | (2.2) | (1.5) | ||
NOTE: Standard errors in parentheses.
SOURCE: Authors’ calculations using CHARLS pilot data.
disadvantaged. One-third of migrants, both male and female, have no insurance whatever, up from the 9% in the general population.9 Clearly, migrants are a vulnerable population in this regard. If a migrant has insurance, it is most likely the rural NCMS insurance. This makes sense because their hukou are in most cases rural places, even though they may live in an urban area.10
It is of some interest to examine whether the insured are in better or worse health than the non-insured. No causality can be attached to these correlations in this chapter. We have many available measures of health to use; here, we use a self-reported measure of general health on a scale of excellent, very good, good, fair, or poor. While self-reported general health measures have biases (see Strauss and Thomas, 1998, for example), they also have signal, since they predict future mortality well (Banks et al., 2009). As shown in Table 14-3, there are no significant differences in insurance coverage among those in poor health versus those not in poor health. This is of interest for several reasons, among which it appears that adverse selection is not a major problem in our sample, at least not for all programs taken together. Lin et al. (2009), however, do find adverse selection in their analysis of the Urban Resident Basic Medical Insurance, but they do not focus exclusively on the older population.
Table 14-4 provides regression results for having any insurance for men and women, respectively. We start in column 1 with a model that includes major socioeconomic status (SES) variables: a set of dummy variables for age group (under 55 years the left-out group), for education levels completed (no schooling the left out group), and a linear spline in log of per capita expenditure (pce).11 Pce is preferred to income because income is measured with much more error than pce (see Lee, 2009, for instance) and because pce is a better measure of long-run resources because it is smoothed in the face of annual income shocks. The knot point for the spline is at the median of log pce. We also include dummies for province interacted with rural area of residence. In column 2, we add a set of variables that are arguably endogenous: a dummy for migrant status (not a migrant being left out), and dummies for being widowed and being divorced or never married (the two are both very small in number and cannot be statistically distinguished in our data). Column 3 replaces
____________
9 Note that the cell sizes are extremely small, especially for women.
10 Note that if we define migrant as having a rural hukou but living in an urban area, the insurance coverage of this population is nearly identical to nonmigrants. In part, this is a function of these people not really being migrants but just being farmers and living in urban areas that are arguably rural.
11 A linear spline allows different slopes to the left and right of the knot point with the two lines being joined at the knot point. The first coefficient reported is the slope to the left of the knot point, and the second coefficient is the change in the slope from the left-hand portion.
TABLE 14-3 Coverage of Insurance for Men and Women, by Self-reported Health
| Men | Women | |||||||
| With insurance (%) | Without insurance (%) | N | P-value | With insurance (%) | Without insurance (%) | N | P-value | |
| Poor health | 89.7 (3.1) |
10.3 (3.1) |
241 | 92.5 (1.8) |
7.5 (1.8) |
341 | ||
| Nonpoor health | 91.1 (1.7) |
8.9 (1.7) |
872 | 90.2 (1.7) |
9.8 (1.7) |
781 | ||
| All | 90.9 (1.6) |
9.1 (1.6) |
1,113 | 0.658 | 90.8 (1.5) |
9.2 (1.5) |
1,122 | 0.221 |
NOTE: Standard errors in parentheses. P-values are from tests of equality of insurance coverage between people having poor health and nonpoor health, separately for men and women.
SOURCE: Authors’ calculations using CHARLS pilot data.
TABLE 14-4 Regression for Having Any Insurance, Men and Women
| Men | Women | |||||
| (1) | (2) | (3) | (1) | (2) | (3) | |
| Aged 55-64 | 0.031* | 0.027 | 0.017 | 0.019 | 0.019 | 0.016 |
| (0.018) | (0.019) | (0.016) | (0.022) | (0.024) | (0.021) | |
| Aged 65-74 | 0.037 | 0.044* | 0.025 | -0.018 | -0.013 | -0.016 |
| (0.023) | (0.026) | (0.026) | (0.024) | (0.025) | (0.024) | |
| Aged 75 and older | -0.002 | -0.006 | -0.008 | -0.124*** | -0.081* | -0.113** |
| (0.035) | (0.043) | (0.042) | (0.047) | (0.047) | (0.049) | |
| Can read and write | 0.026 | 0.032 | 0.032 | 0.057** | 0.058** | 0.047** |
| (0.022) | (0.022) | (0.021) | (0.025) | (0.027) | (0.021) | |
| Finished primary | 0.021 | 0.032 | 0.033 | 0.025 | 0.023 | 0.002 |
| (0.024) | (0.025) | (0.022) | (0.032) | (0.033) | (0.031) | |
| Junior high and above | 0.034 | 0.044* | 0.030 | 0.087*** | 0.096*** | 0.067** |
| (0.022) | (0.024) | (0.023) | (0.030) | (0.031) | (0.026) | |
| logPCE (< median) | 0.034* | 0.021 | 0.010 | 0.001 | 0.003 | 0.002 |
| (0.017) | (0.017) | (0.013) | (0.012) | (0.012) | (0.013) | |
| logPCE (> median, marginal) | 0.001 | 0.019 | 0.012 | 0.013 | 0.014 | 0.008 |
| (0.027) | (0.027) | (0.022) | (0.030) | (0.035) | (0.029) | |
| Migrant | -0.262*** | -0.197** | -0.302** | -0.188 | ||
| (0.076) | (0.079) | (0.118) | (0.144) | |||
| Widowed | -0.105*** | -0.128*** | -0.053 | -0.044 | ||
| (0.038) | (0.037) | (0.032) | (0.033) | |||
| Divorced or never married | 0.088*** | 0.081*** | -0.075 | -0.140 | ||
| (0.019) | (0.016) | (0.141) | (0.147) | |||
| Having poor health | 0.011 | 0.017 | 0.022 | 0.026* | ||
| (0.020) | (0.022) | (0.016) | (0.015) | |||
| Rural Zhejiang | 0.007 | 0.005 | 0.043 | 0.045 | ||
| (0.032) | (0.033) | (0.039) | (0.041) | |||
| Urban Gansu | -0.021 | -0.021 | -0.093 | -0.091 | ||
| (0.047) | (0.051) | (0.057) | (0.055) | |||
| Rural Gansu | 0.079*** | 0.076** | 0.070* | 0.072 | ||
| (0.026) | (0.030) | (0.042) | (0.046) | |||
| Community FE | NO | NO | YES | NO | NO | YES |
| F-test for all age dummies | 2.02 | 1.66 | 0.66 | 3.06** | 1.82 | 2.70** |
| (p-value) | (0.117) | (0.181) | (0.576) | (0.032) | (0.149) | (0.050) |
| F-test for all education dummies | 0.88 | 1.19 | 1.04 | 3.56** | 3.98** | 3.30** |
| (p-value) | (0.453) | (0.320) | (0.379) | (0.017) | (0.010) | (0.024) |
| F-test for all logPCE splines | 5.17*** | 2.91* | 1.61 | 0.16 | 0.27 | 0.15 |
| (p-value) | (0.007) | (0.060) | (0.206) | (0.855) | (0.761) | (0.857) |
| F-test for all marital status dummies | 17.73*** | 19.60*** | 1.53 | 1.33 | ||
| (p-value) | (0.000) | (0.000) | (0.223) | (0.268) | ||
| F-test for all location dummies | 4.23*** | 3.44** | 1.98*** | 3.23** | 3.57** | 1.84*** |
| (p-value) | (0.008) | (0.020) | (0.000) | (0.026) | (0.017) | (0.001) |
| Observations | 1,262 | 1,107 | 1,107 | 1,233 | 1,118 | 1,118 |
NOTE: Robust standard errors in parentheses, all clustered at community level. * denotes p < .1; ** p <. 05; *** p < .01. logPCE (> median, marginal) represents the change in the slope from the interval for logPCE below the median.
SOURCE: Authors’ calculations using CHARLS pilot data.
province-rural dummies with community fixed effects.12 The idea here is that each community has factors that will affect insurance and healthcare utilization that are not captured by the provincial dummies interacted with rural or urban. These factors will include healthcare prices, inherent healthiness of the area, public health infrastructure, and other factors. F-tests for all combinations of dummy variables are reported as well.
Regressions are all ordinary least squares (OLS). For binary dependent variables, this represents linear probability (LP) models. LP models consistently estimate average treatment effects, which is what we are interested in. Furthermore, all of our standard errors are calculated for robustness to heteroskedasticity and allow clustering at the community level. The robustness makes our standard error estimates consistent when we are estimating LP models (Wooldridge, 2002).
For men, age dummies are weakly significant (at the 10% level), except when we add community fixed effects, and show that men aged 55-64 are about 3% more likely to have insurance than younger men. For women, the age dummies are highly significant (at the .001 level), and older women over 75 years are 10-14% less likely to be insured, a large impact.
For men, education does not seem to have significant effects on possessing any insurance, but for women, it raises the likelihood of having insurance. On the other hand, for men, higher pce is associated with a higher probability of having some insurance, but not for women.
Reporting poor general health is not correlated with having insurance for men. It is weakly (at the 10% level) positively correlated for women, with some evidence of adverse selection for women.
Being a migrant male is associated with a 22% decline in the likelihood of being insured, a very large difference; the difference for women is similar in magnitude and significance. The NCMS generally does not reimburse migrants for their medical expenses incurred in urban areas where the migrants are working, so the incentive for them to participate in the NCMS is low. The two major urban insurance schemes also do not cover migrants. In May 2006, a separate medical insurance pooling fund was set up to cover expenses for migrants, but the effectiveness of this program has not been evaluated to date.
Being widowed also is associated with a large (10%) decline in the odds of being insured for men, though a much less large difference for women and not significant in most cases.
Men and women who live in rural Gansu have a somewhat higher chance of having health insurance, once individual and household SES
____________
12 Since the binary dependent variables cannot be all 1 or 0 for a given community, some communities had to be aggregated.
factors are controlled. This is interesting, and one might have expected the reverse. However, even the unconditional probabilities of having insurance are a bit higher in rural areas of Zhejiang and Gansu. When we add the community dummies in column 3, they are jointly significant at the .001 level for both men and women.13 Now the migrant dummy loses magnitude and significance for women and its magnitude drops by 30% for men. Apparently, important, unmeasured factors exist at the community level that affect access to insurance for those who do not get it.
In results not shown, we repeat the regressions for respondents who have a rural hukou and are thus eligible in principle to join the NCMS.14 Most of the results for the rural insurance are similar to the main results: Older women, migrants, and male widowers are substantially less likely to be insured with this scheme. However, the associations of education and pce with belonging to the NCMS are generally not significant, except for women for being able to read and write, but not for those with more schooling.
Healthcare Utilization
About 16.5% of men and 21% of women aged 45 and older said they used outpatient services at least once over the past month (see Table 14-5).15 Most of those who went used a hospital or a village or private clinic. Township hospitals and healthcare posts were also important destinations, especially in rural areas. Table 14-5 shows that inpatient use over the past year was less frequent, 6.7% for men and 6% for women. Virtually all of the inpatient use was at hospitals, general hospitals being the most important destination by far, followed equally by specialized hospitals, Chinese medicine hospitals, and township hospitals.
Regressions for outpatient utilization (see Table 14-6) show that for men, being older and more educated have positive associations with use,
____________
13 With community fixed effects, testing the joint significance of the community dummies is not straightforward. Because there are in our case few observations per cluster, we cannot cluster the standard errors after estimation using community fixed effects and use an F-test to test for the joint significance of clusters (Wooldridge, personal communication). To test the community dummies, we re-estimate the model with community dummies and just robust standard errors, without clustering, and do the F-test.
14 We consider sample sizes for people with urban hukou and thus eligible for the urban insurance schemes too small to analyze with regressions. Lin et al. (2009) find that income has a U-shaped association with having the Urban Resident Basic Medical Insurance, with low- and high-income persons more likely to have it.
15 While these outpatient rates may seem high, they correspond closely to other populations. In the Indonesia Family Life Survey, wave 4, for instance, 15% of men and 21% of women over 45 years used an outpatient service over the same one-month period. The inpatient usage rates in Indonesia are lower, only 4.7% of men and 3.5% of women aged 45 and older.
TABLE 14-5 Percentage of People Who Used Medical Service in the Past Month, by Age and Gender
| Outpatient | Inpatient | |||||||||||
| Men | Women | All | Men | Women | All | |||||||
| % | N | % | N | % | N | % | N | % | N | % | N | |
| 45-54 | 11.7 | 395 | 20.0 | 459 | 15.6 | 854 | 2.9 | 395 | 4.5 | 459 | 3.7 | 854 |
| (2.0) | (2.4) | (1.4) | (0.8) | (1.0) | (0.7) | |||||||
| 55-64 | 23.6 | 374 | 23.6 | 367 | 23.6 | 741 | 9.3 | 374 | 5.1 | 367 | 7.1 | 741 |
| (4.0) | (3.8) | (3.1) | (1.9) | (1.4) | (1.2) | |||||||
| 65-74 | 15.4 | 249 | 16.7 | 204 | 16.0 | 453 | 10.3 | 249 | 7.3 | 204 | 8.9 | 453 |
| (2.5) | (2.6) | (1.9) | (2.6) | (2.6) | (1.9) | |||||||
| 75+ | 17.4 | 92 | 25.6 | 94 | 22.1 | 186 | 6.5 | 92 | 9.5 | 94 | 8.2 | 186 |
| (4.9) | (6.5) | (4.3) | (2.8) | (4.1) | (2.7) | |||||||
| Total (45+) | 16.5 1.7 |
1,110 | 21.2 (2.1) |
1,124 | 18.9 (1.5) |
2,234 | 6.7 (0.9) |
1,110 | 5.9 (0.9) |
1,124 | 6.3 (0.7) |
2,234 |
NOTE: Standard errors in parentheses.
SOURCE: Authors’ calculations using CHARLS pilot data.
TABLE 14-6 Regression for Using Medical Service for Outpatients
| Men | Women | ||||
| (1) | (2) | (1) | (2) | ||
| Aged 55-64 | 0.082*** | 0.073** | 0.009 | -0.009 | |
| (0.030) | (0.030) | (0.029) | (0.030) | ||
| Aged 65-74 | 0.072** | 0.060 | 0.010 | -0.014 | |
| (0.033) | (0.037) | (0.036) | (0.037) | ||
| Aged 75 and older | 0.084* | 0.097** | 0.111* | 0.099 | |
| (0.044) | (0.047) | (0.058) | (0.060) | ||
| Can read and write | 0.078** | 0.081** | -0.017 | -0.025 | |
| (0.030) | (0.034) | (0.034) | (0.038) | ||
| Finished primary | 0.036 | 0.035 | 0.026 | -0.001 | |
| (0.033) | (0.038) | (0.047) | (0.055) | ||
| Junior high and above | 0.067* | 0.073* | 0.012 | -0.023 | |
| (0.036) | (0.038) | (0.045) | (0.045) | ||
| logPCE (< median) | 0.016 | 0.022 | 0.022* | 0.019 | |
| (0.014) | (0.014) | (0.013) | (0.012) | ||
| logPCE (> median, marginal) | 0.024 | 0.005 | 0.058* | 0.047 | |
| (0.027) | (0.029) | (0.035) | (0.034) | ||
| Having any insurance | 0.040 | 0.021 | 0.004 | -0.004 | |
| (0.035) | (0.037) | (0.043) | (0.051) | ||
| Rural Zhejiang | 0.001 | 0.010 | |||
| (0.030) | (0.034) | ||||
| Urban Gansu | 0.019 | 0.078 | |||
| (0.033) | (0.048) | ||||
| Rural Gansu | 0.061 | 0.119*** | |||
| (0.037) | (0.041) | ||||
| Community FE | NO | YES | NO | YES | |
| F-test for all age dummies | 3.00** | 2.46* | 1.23 | 1.15 | |
| (p-value) | (0.035) | (0.068) | (0.304) | (0.334) | |
| F-test for all education dummies | 2.37* | 2.30* | 0.25 | 0.20 | |
| (p-value) | (0.076) | (0.083) | (0.861) | (0.893) | |
| F-test for all logPCE splines | 2.09 | 1.59 | 6.65*** | 4.50** | |
| (p-value) | (0.129) | (0.210) | (0.002) | (0.014) | |
| F-test for all location dummies | 1.08 | 1.12 | 3.58** | 1.84*** | |
| (p-value) | (0.360) | (0.231) | (0.017) | (0.000) | |
| Observations | 1,104 | 1,104 | 1,118 | 1,118 | |
NOTE: Robust standard errors in parentheses, all clustered at community level. * denotes p < .1; ** p < .05; *** p < .01. logPCE (> median, marginal) represents the change in the slope from the interval for logPCE below the median.
SOURCE: Authors’ calculations using CHARLS pilot data.
while for women, having higher pce is positively related to outpatient service use, as is living in rural Gansu, controlling for SES. The community dummies are highly significant for women, though not for men. Again, unmeasured factors at the community level are important for women seeking outpatient care.
For inpatient care (see Table 14-7), income (pce) is highly significant and positively related to care for both men and women. Other factors being equal, being in Gansu, rural or urban, is associated with more inpatient care use for women and living in urban Gansu for men. It is, of course, of prime interest to examine how having insurance is associated with outpatient and inpatient care. The problem is that having insurance is endogenous, and there is no good way with these data to identify a structural relationship. Still, looking at the correlations is of interest. Insurance is positively and significantly correlated with inpatient use by men, though it is not significant for women and it is not significantly related to outpatient use. A man with insurance is 4.5% more likely to seek inpatient care than a man without any insurance. These results are consistent with the results of Gao, Raven, and Tang (2007) and Wagstaff and Lindelow (2008), who also found a positive correlation of insurance with inpatient use.
Health Insurance Parameters and Reimbursement
Having health insurance does not tell anything about the nature of that insurance. The CHARLS pilot collected data about some of the characteristics of the insurance, in particular about the premiums paid, as well as, for those who had insurance and who went for inpatient or outpatient services, what fraction of their total costs they anticipated would be reimbursed. For the Urban Resident Basic Medical Insurance, not enough respondents reported their premiums so our sample is too small to report. For the Urban Employee Medical Insurance and the NCMS insurance, we report mean premiums in Table 14-8.
The mean reported premium for the NCMS is about 20 RMB per year. The mean premium is lower in rural Gansu, only 13 RMB, and higher in rural Zhejiang, about 28 RMB. These are remarkably low premiums even compared to low rural incomes in Gansu of 5,000 RMB pce. Even in Zhejiang, both rural and urban, about 20% say they did not pay any premiums for their NCMS insurance. For the Urban Employee Medical Insurance scheme, premiums are much higher, around 300 RMB per year in urban Gansu, about the same for women in urban Zhejiang, but much higher, 600 RMB per year, for men in urban Zhejiang. Even these levels, however, are not large relative to annual pce of between 7,500 RMB and 10,000 RMB per year in Gansu and Zhejiang. We have to be a bit careful because our
TABLE 14-7 Regression for Using Inpatient Medical Service
| Men | Women | ||||
| (1) | (2) | (1) | (2) | ||
| Aged 55-64 | 0.051*** | 0.058*** | 0.001 | 0.005 | |
| (0.018) | (0.018) | (0.019) | (0.019) | ||
| Aged 65-74 | 0.078*** | 0.087*** | 0.013 | 0.013 | |
| (0.028) | (0.029) | (0.020) | (0.020) | ||
| Aged 75 and older | 0.043 | 0.053 | 0.054 | 0.057* | |
| (0.030) | (0.033) | (0.034) | (0.034) | ||
| Can read and write | 0.019 | 0.019 | -0.023 | -0.024 | |
| (0.023) | (0.024) | (0.016) | (0.017) | ||
| Finished primary | -0.020 | -0.021 | 0.007 | 0.009 | |
| (0.020) | (0.021) | (0.024) | (0.025) | ||
| Junior high and above | -0.017 | -0.013 | -0.026 | -0.025 | |
| (0.022) | (0.022) | (0.024) | (0.023) | ||
| logPCE (< median) | 0.014* | 0.016** | 0.004 | 0.007 | |
| (0.008) | (0.008) | (0.005) | (0.006) | ||
| logPCE (> median, marginal) | 0.038 | 0.032 | 0.062*** | 0.060** | |
| (0.025) | (0.024) | (0.021) | (0.023) | ||
| Having any insurance | 0.046** | 0.053* | 0.024 | 0.020 | |
| (0.021) | (0.028) | (0.023) | (0.024) | ||
| Rural Zhejiang | 0.012 | 0.007 | |||
| (0.021) | (0.016) | ||||
| Urban Gansu | 0.098*** | 0.049** | |||
| (0.036) | (0.020) | ||||
| Rural Gansu | 0.019 | 0.046** | |||
| (0.018) | (0.022) | ||||
| Community FE | NO | YES | NO | YES | |
| F-test for all age dummies | 3.68** | 4.62*** | 0.98 | 0.99 | |
| (p-value) | (0.015) | (0.005) | (0.407) | (0.400) | |
| F-test for all education dummies | 1.20 | 1.17 | 0.99 | 1.10 | |
| (p-value) | (0.313) | (0.325) | (0.403) | (0.353) | |
| F-test for all logPCE splines | 5.21*** | 5.78*** | 6.06*** | 5.88*** | |
| (p-value) | (0.007) | (0.004) | (0.003) | (0.004) | |
| F-test for all location dummies | 2.46* | 1.09 | 2.72** | 0.71 | |
| (p-value) | (0.068) | (0.337) | (0.049) | (0.890) | |
| Observations | 1,104 | 1,104 | 1,118 | 1,118 | |
NOTE: Robust standard errors in parentheses, all clustered at community level. * denotes p < .1; ** p < .05; *** p < .01. logPCE (> median, marginal) represents the change in the slope from the interval for logPCE below the median.
SOURCE: Authors’ calculations using CHARLS pilot data.
TABLE 14-8 Mean of Premium of Different Medical Insurances
| Urban Employee Medical Insurance | New Cooperative Medical Scheme Insurance | ||||
| Men | Women | Men | Women | ||
| Gansu Urban | Mean | 289.0 | 337.4 | 18.1 | 18.7 |
| (116.4) | (114.6) | (6.0) | (6.5) | ||
| = 0 | 6% | 0% | 1% | 0% | |
| N | 41 | 20 | 67 | 86 | |
| Gansu Rural | Mean | 13.0 | 12.9 | ||
| (0.7) | (0.7) | ||||
| = 0 | 0% | 0% | |||
| N | 368 | 340 | |||
| Zhejiang Urban | Mean | 608.1 | 324.3 | 18.2 | 24.1 |
| (173.3) | (158.9) | (3.6) | (6.2) | ||
| = 0 | 12% | 11% | 18% | 17% | |
| N | 70 | 52 | 211 | 220 | |
| Zhejiang Rural | Mean | 28.2 | 26.8 | ||
| (4.7) | (4.6) | ||||
| = 0 | 20% | 22% | |||
| N | 267 | 273 | |||
| Total | Mean | 495.4 | 318.3 | 20.3 | 21.8 |
| (127.4) | (123.4) | (2.1) | (2.6) | ||
| = 0 | 5% | 3% | 10% | 10% | |
| N | 122 | 76 | 913 | 919 | |
NOTE: Standard errors in parentheses. “= 0” represents the number of people whose premium is zero.
SOURCE: Authors’ calculations using CHARLS pilot data.
cell sizes are not large, but it is quite interesting that for this insurance plan, unlike the rural plan, premiums are lower for women, particularly in urban Zhejiang. We do not know why as yet. The other point to note from Table 14-8 is that in urban Zhejiang, a little more than 10% get their Urban Employee Medical Insurance without any premium.
Another important parameter of the new insurance schemes is the reimbursement rate. Reimbursements depend on the plan and on the parameters, which are set at the county or district level.16 They vary greatly across county-units and depend on many factors, such as total medical expenditures, which type of facility the respondent went to and whether that type of facility is covered by the particular insurance
____________
16 In the national baseline survey conducted in 2011, a special policy module was administered at the county or district level to collect detailed plan information. Since there are 150 county-units in the national baseline, these can be analyzed at the county-unit level. In the pilot survey data we use in this chapter, that is not possibl.
policy, and the specific treatment received. The NCMS has four models to reimburse patients for in- and outpatient services (Lei and Lin, 2009). The most frequent model, used in two-thirds of the rural counties, uses a medical savings account. Each household has its own medical savings account, with household members depositing their contributions into this account and then spending money from it. Only household members are entitled to the funds in the account, which is used mainly for outpatient services. There is a deductible and a reimbursement cap for using a medical savings account.
Traditionally, the reimbursements for the NCMS have put more emphasis on inpatient than outpatient services. However, a more recent, general trend includes outpatient services and physical check-ups in patient reimbursements (Du and Zhang, 2007). In addition, some counties provide insurance coverage for an annual physical examination. Overall, there has been an increasing trend in the amount of coverage per capita and an increase in the range of services offered (Du and Zhang, 2007).
We calculated individual reimbursement rates by first asking the respondent if they went for outpatient service in the past month or inpatient service in the past year. If the answer was yes, then we got details about the last visit, including the total costs of the service, including medicines. We then asked how much he or she expected to pay, not just what he or she had paid to date.17 One could reasonably worry how well respondents can answer these cost questions, but they were thoroughly pretested, and it is our judgment that these answers are reliable. For the cost repayment estimates, we aggregated men and women to maximize our cell sizes, which are small. We also used only those respondents who reported that they have insurance, as otherwise this question does not make sense.18
The reimbursement rates for inpatient service are 40% and 30% in urban and rural areas, respectively (not, however, significantly different at standard levels), similar between Gansu and Zhejiang (see Table 14-9). By hukou status, the reimbursement rates are 58% for urban hukou holders and 28% for rural hukou holders (these are significantly different at the .01 level). By hukou, there were some important differences across provinces; the rates for rural hukou holders were higher in Gansu (35% versus
____________
17 Respondents who reported a visit were asked about their last visit “What was the total cost of medical treatment?” and “How much will you eventually pay out of pocket for the total costs of the visit?” This was followed by equivalent questions about medications from this visit.
18 The number of respondents who reported going for inpatient care and who do not have insurance is too small to separately and reliably report their expenditures. For outpatient care, sample size for those without insurance is very small, just 34, but in general their total costs are somewhat lower than for those with insurance.
TABLE 14-9 Inpatient Cost for People with Insurance
| PANEL A by Urban/Rural and Province | |||||||||
| Urban | Rural | ||||||||
| Total cost mean | Share of out-of-pocket cost (%) | Reimbursement rate (%) | N | Total cost mean | Share of out-of-pocket cost (%) | Reimbursement rate (%) | N | P-value | |
| Gansu | 3,329.3 | 57.6 | 42.4 | 33 | 3,631.6 | 67.9 | 32.1 | 37 | 0.210 |
| (658.5) | (5.9) | (5.9) | (732.4) | (5.7) | (5.7) | ||||
| Zhejiang | 14,591.7 | 61.2 | 38.8 | 34 | 9,449.0 | 70.2 | 29.8 | 25 | 0.431 |
| (4,844.3) | (9.7) | (9.7) | (1,316.4) | (6.0) | (6.0) | ||||
| Total | 10,562.9 | 59.9 | 40.1 | 67 | 6,981.1 | 69.3 | 30.7 | 62 | 0.226 |
| (3,223.4) | (6.5) | (6.5) | (995.8) | (4.2) | (4.2) | ||||
| PANEL B by Hukou and Province | |||||||||
| Urban Hukou | Rural Hukou | ||||||||
| Total cost mean | Share of out-of-pocket cost (%) | Reimbursement rate (%) | N | Total cost mean | Share of out-of-pocket cost (%) | Reimbursement rate (%) | N | P-value | |
| Gansu | 4,080.7 | 54.4 | 45.6 | 17 | 3,284.6 | 65.2 | 34.8 | 53 | 0.211 |
| (974.1) | (7.3) | (7.3) | (592.2) | (4.8) | (4.8) | ||||
| Zhejiang | 18,165.4 | 35.6 | 64.4 | 14 | 10,086.0 | 76.9 | 23.1 | 45 | 0.003 |
| (9,372.0) | (12.4) | (12.4) | (1,430.0) | (3.9) | (3.9) | ||||
| Total | 13,247.0 | 42.1 | 57.9 | 31 | 7,351.6 | 72.4 | 27.6 | 98 | 0.002 |
| (6,131.9) | (8.9) | (8.9) | (1,012.1) | (3.2) | (3.2) | ||||
NOTE: Standard errors in parentheses. P-values are from tests of equality of reimbursement rates between rural and urban residents or rural and urban Hukou, separately or jointly for Gansu and Zhejiang provinces.
SOURCE: Authors’ calculations using CHARLS pilot data.
23%), while the rates among urban hukou holders were much higher in Zhejiang (64% compared to 46%). Furthermore, the standard error of the reimbursement rate was much higher for urban hukou in Zhejiang than for Gansu (12.4 versus 7.3).19 This is important because the county-level units are allowed to set the parameters for the health insurance, and apparently there is a wider variance of experience related to reimbursement rates in urban Zhejiang than in urban Gansu. Also since Zhejiang is far richer than Gansu, there is more scope for higher reimbursement rates should the county-unit choose.
We checked the variation in reimbursement rates between and within counties, using an analysis of variance (ANOVA), and find that counties account for 24% of the variation for inpatient rates in Gansu and 56% for Zhejiang. Our finding that more variation exists between counties in Zhejiang than in Gansu makes sense given that there seems to be more experimentation in insurance policy parameters among counties in Zhejiang than in Gansu, in part perhaps because of its greater wealth.20 When we disaggregate plans and run an ANOVA for inpatient respondents with the NCMS, we find 41% of the variation in Zhejiang is between counties versus 30% in Gansu. We do find important variation between counties, which we expect since counties have control over setting parameters of the programs, but even more variation within counties. Reasons for this variation include not only that we are aggregating over different insurance schemes (because of sample size consideration), but also because even for a given program, reimbursement depends on factors such as the particular reason (illness) for going to a health facility, the type of facility visited, and the total cost. These factors vary by individual and are apparently important.21
Yi et al. (2009) report that in the five provinces in which they did their study (which did not include either Gansu or Zhejiang), as total costs of inpatient treatment increased, reimbursement rates fell for the NCMS, often to quite low levels, around 10%. If total costs are taken as a proxy of severity of the health problem, then this strongly suggests that the major new rural health insurance scheme is not covering catastrophic illnesses well and is certainly not adequately covering catastrophic health expenditures.
The CHARLS pilot data show a very interesting, and somewhat different, story. We start in Figure 14-1 by nonparametrically plotting reimbursement rates for inpatient services against total inpatient costs,
____________
19 This is not due to outliers; even the interquartile range is much larger in Zhejiang.
20 If there is little systematic variation between counties in Gansu in reimbursement rates, that will result in a lower R2 when regressing reimbursement rates on county dummies.
21 Of course, measurement error will also contribute to within-county variation.
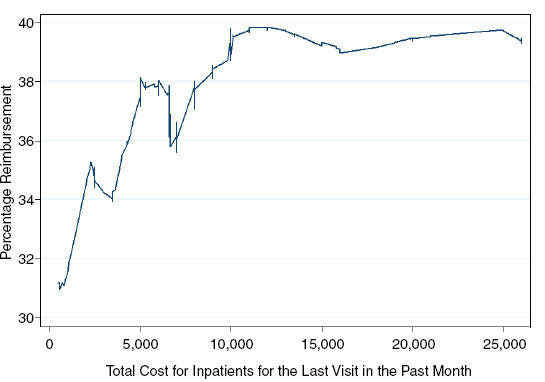
FIGURE 14-1 Reimbursement rates for inpatients with any insurance for the last visit in the past month, by total cost.
SOURCE: CHARLS pilot data.
using data on respondents with any insurance who reported inpatient utilization over the past year.22 It is clear that reimbursement rates rise, not fall, as total costs rise. Reimbursement rates rise from 31% to a plateau of 40% at a total cost of 10,000 Yuan, which is right at the 75th percentile for the total cost distribution. Mean pce for our households is approximately 8,000 Yuan, and the median is 5,800, so an expense of 10,000 is quite large compared to mean pce. For costs above 10,000 Yuan, though, reimbursement rates stay flat at 40%. If the system were effective in covering catastrophic health expenditures, then the reimbursement rates should continue to rise; they do not.
So the glass seems to be half full. There is nontrivial coverage for inpatient expenses that does rise some as total costs rise, at least up to a point. Furthermore, when this situation is compared to the period before
____________
22 Our sample size is only 129. These are respondents who went for inpatient service (and so we have cost data for them) and who have insurance (so we have reimbursement data). Some caution needs to be taken because of the limited sample size. When we plot the figure for those who have NCMS insurance, some 96 observations, the curve slopes gently upwards at high levels of total cost, but has a peak of more than 30%
2003, this represents a large improvement. Finally, we note that further reform and experimentation is ongoing, so this is not the final story.
For outpatient reimbursement, the story is quite different. The new health insurance schemes, particularly the rural scheme, were initially designed to help with inpatient service, so many county-units are apparently choosing not to reimburse for outpatient service (see Table 14-10 Panel A). The mean rural reimbursement rate is only 8.5%, being slightly higher in Zhejiang. The urban rates are considerably higher, a mean of 30%, but more than double in Zhejiang (36%) than in Gansu (14%). The urban reimbursement rates are significantly higher than the rural ones in Zhejiang and aggregating both provinces. Again, the standard error is much higher in urban Zhejiang than in urban Gansu, suggesting more experimentation in urban Zhejiang.23
If we split the sample by rural and urban hukou, the differences in reimbursement rates become starker (see Table 14-10 Panel B). Now, urban hukou holders face 63% reimbursement in Zhejiang and 17% in Gansu, which is still double the reimbursement rates for rural hukou holders in Gansu. Urban-rural hukou differences are significantly different at .01.
If we look only at reimbursement rates for people holding rural insurance through the NCMS (results not shown), we see a similar pattern to the rural population. Rates of reimbursement are about 10% for urban residents and 8% for rural, and the provincial differences are quite small. Clearly, this insurance scheme was not designed to cover outpatient service, just inpatient. However, it remains to be seen in the future whether these same patterns hold. It may be that over time, reimbursement rates may rise for outpatient service, as they have for the urban plans in Zhejiang.
Table 14-11 reports regressions on the cost share paid, separately by men and women, for outpatient service.24 The sample is those persons who used outpatient services in the last one month and who have insurance that could be used to get reimbursement. The SES variables, education, and pce are insignificant in all cases. Age is important for men, but not women. Older men have lower out-of-pocket costs as a percentage of the total. The regional dummies are significant, with lower repayment rates in urban Zhejiang, as we saw in the previous tables. The community dummies are also significant.25 This is interesting because, as discussed
____________
23 Some 35% of the variation in outpatient reimbursement rates in Zhejiang is between counties, but only 7% for Gansu. A high fraction of rural outpatients in Gansu have a zero reimbursement rate, which partly accounts for the low between-county variation.
24 We considered the sample sizes for inpatient service too small to get meaningful results.
25 The significance of the community dummies does not come from differences across provinces. Even using data from only Zhejiang or only Gansu, the community dummies are jointly significant.
TABLE 14-10 Outpatient Cost for People with Insurance
| PANEL A Outpatient Cost for People with Insurance, by Urban/Rural and Province | |||||||||
| Urban | Rural | ||||||||
| Total cost mean | Share of out-of-pocket cost (%) | Reimbursement rate (%) | N | Total cost mean | Share of out-of-pocket cost (%) | Reimbursement rate (%) | N | P-value | |
| Gansu | 229.4 | 85.6 | 14.4 | 58 | 180.8 | 92.5 | 7.5 | 131 | 0.186 |
| (73.1) | (4.7) | (4.7) | (36.9) | (2.3) | (2.3) | ||||
| Zhejiang | 318.0 | 63.6 | 36.4 | 96 | 614.6 | 90.5 | 9.5 | 76 | 0.009 |
| (59.1) | (9.8) | (9.8) | (178.1) | (1.7) | (1.7) | ||||
| Total | 293.4 | 70.1 | 29.9 | 154 | 413.0 | 91.5 | 8.5 | 207 | 0.006 |
| (46.0) | (7.5) | (7.5) | (99.6) | (1.5) | (1.5) | ||||
| PANEL B Outpatient Cost for People with Insurance, by Hukou and Province | |||||||||
| Urban Hukou | Rural Hukou | ||||||||
| Total cost mean | Share of out-of-pocket cost (%) | Reimbursement rate (%) | N | Total cost mean | Share of out-of-pocket cost (%) | Reimbursement rate (%) | N | P-value | |
| Gansu | 192.0 | 82.6 | 17.4 | 41 | 201.6 | 92.3 | 7.7 | 148 | 0.301 |
| (28.1) | (8.6) | (8.6) | (44.9) | (2.4) | (2.4) | ||||
| Zhejiang | 250.6 | 37.3 | 62.7 | 41 | 526.5 | 89.6 | 10.4 | 131 | 0.000 |
| (67.0) | (9.7) | (9.7) | (114.5) | (1.9) | (1.9) | ||||
| Total | 231.4 (46.3) |
53.6 (10.1) |
46.4 (10.1) |
82 | 400.5 (73.7) |
90.7 (1.5) |
9.3 (1.5) |
279 | 0.000 |
NOTE: Standard errors in parentheses. P-values are from tests of equality of reimbursement rates between rural and urban residents or rural and urban Hukou, separately or jointly for Gansu and Zhejiang provinces.
SOURCE: Authors’ calculations using CHARLS pilot data.
TABLE 14-11 Regression for the Share of Out-of-Pocket Cost in the Total Cost of the Past Visit for Outpatient Medical Service in the Past Month
| Men | Women | |||||
| (1) | (2) | (3) | (1) | (2) | (3) | |
| Aged 55-64 | -0.083 | -0.085* | -0.047 | -0.039 | -0.031 | -0.027 |
| (0.050) | (0.050) | (0.053) | (0.046) | (0.047) | (0.040) | |
| Aged 65-74 | -0.225*** | -0.232*** | -0.206*** | -0.109* | -0.102* | -0.131** |
| (0.071) | (0.070) | (0.068) | (0.061) | (0.059) | (0.065) | |
| Aged 75 and older | -0.362*** | -0.380*** | -0.298** | -0.053 | -0.025 | -0.040 |
| (0.112) | (0.111) | (0.119) | (0.084) | (0.090) | (0.084) | |
| Can read and write | -0.042 | -0.039 | -0.045 | 0.055 | 0.061 | 0.048 |
| (0.083) | (0.084) | (0.085) | (0.045) | (0.046) | (0.053) | |
| Finished primary | -0.066 | -0.055 | -0.040 | -0.099 | -0.094 | -0.091 |
| (0.088) | (0.086) | (0.089) | (0.091) | (0.092) | (0.081) | |
| Junior high and above | -0.116 | -0.108 | -0.048 | -0.092 | -0.087 | -0.082 |
| (0.084) | (0.084) | (0.085) | (0.073) | (0.074) | (0.075) | |
| logPCE (< median) | -0.018 | -0.014 | -0.017 | 0.007 | 0.008 | 0.005 |
| (0.044) | (0.047) | (0.043) | (0.018) | (0.018) | (0.018) | |
| logPCE (> median, marginal) | 0.037 | 0.030 | 0.036 | -0.057 | -0.056 | -0.051 |
| (0.096) | (0.097) | (0.098) | (0.063) | (0.064) | (0.063) | |
| Widowed | 0.064 | 0.063 | -0.026 | -0.018 | ||
| (0.077) | (0.080) | (0.053) | (0.062) | |||
| Divorced or never married | 0.018 | -0.014 | 0.206*** | 0.040 | ||
| (0.105) | (0.096) | (0.069) | (0.088) | |||
| Men | Women | |||||
| (1) | (2) | (3) | (1) | (2) | (3) | |
| Rural Zhejiang | 0.232** | 0.233** | 0.137** | 0.143** | ||
| (0.091) | (0.090) | (0.064) | (0.066) | |||
| Urban Gansu | 0.320*** | 0.316*** | 0.166** | 0.172** | ||
| (0.102) | (0.102) | (0.081) | (0.083) | |||
| Rural Gansu | 0.237** | 0.230** | 0.123* | 0.133* | ||
| (0.093) | (0.091) | (0.069) | (0.073) | |||
| Community FE | NO | NO | YES | NO | NO | YES |
| F-test for all age dummies | 4.99*** | 5.39*** | 4.00** | 1.07 | 1.01 | 1.37 |
| (p-value) | (0.003) | (0.002) | (0.011) | (0.368) | (0.395) | (0.257) |
| F-test for all education dummies | 0.71 | 0.65 | 0.12 | 1.13 | 1.15 | 0.86 |
| (p-value) | (0.548) | (0.588) | (0.949) | (0.342) | (0.334) | (0.467) |
| F-test for ail logPCE splines | 0.09 | 0.05 | 0.08 | 0.41 | 0.38 | 0.33 |
| (p-value) | (0.918) | (0.952) | (0.923) | (0.667) | (0.688) | (0.722) |
| F-test for ail marital status dummies | 0.34 | 0.34 | 4.55** | 0.18 | ||
| (p-value) | (0.713) | (0.714) | (0.014) | (0.834) | ||
| F-test for ail location dummies | 3.23** | 3.25** | 5.09*** | 1.59 | 1.62 | 2.79*** |
| (p-value) | (0.027) | (0.027) | (0.000) | (0.198) | (0.191) | (0.003) |
| Observations | 162 | 162 | 162 | 226 | 226 | 226 |
NOTE: Robust standard errors in parentheses, all clustered at community level. * denotes p < .1; ** p < .05; *** p < .01. logPCE (> median, marginal) represents the change in the slope from the interval for logPCE below the median.
SOURCE: Authors’ calculations using CHARLS pilot data.
in Brown and Theoharides (2009), most of the choice regarding insurance parameters is set at the county-level. Thus, there is great scope for experimentation, which is evidently ongoing.
CONCLUSIONS
There was a major spread of health insurance in both urban and especially rural areas of China in the five years prior to the CHARLS pilot in 2008. In the CHARLS pilot data, some 90% of our sample report having some type of insurance, with the NCMS insurance the most prevalent. Reported premiums actually paid are low in rural areas, averaging 20 Yuan per year per person, though a good deal higher in urban areas. Thus, the degree of public subsidy is high. At the moment, in Zhejiang and Gansu, these schemes cover mainly inpatient care, and the reimbursement rates top out at 64% for respondents in Zhejiang having an urban hukou. For those with rural hukou, reimbursement rates are much lower, ranging from 23 to 35% in Zhejiang and Gansu. Reimbursement rates rise with total visit costs for all plans in the aggregate, and for the NCMS in particular. The rise in reimbursement rates with total costs stops when rates reach 40% at 10,000 Yuan in total costs, aggregating over all insurance types. For the NCMS, reimbursement rates top out at just over 30% for costs of 20,000 Yuan. In either case, people with high medical costs are still having to pay a large part of costs and are thus at risk of losing significant assets or not being able to pay. Outpatient service is just beginning to be covered by insurance in Zhejiang province, especially in urban areas and among those holding urban hukou, but not much yet in Gansu province.
Simple descriptive regressions show that respondents with lower incomes as measured by per capita expenditure (pce) have a lower chance of being insured, as do migrants, older women, and male widowers. Education has little significant correlation with being insured. There is a lot of variation across communities in coverage and reimbursement rates, as reported in earlier studies.
For inpatient use, having higher pce matters positively for both men and women, and it is also positively correlated with utilization for outpatient services for women. On the other hand, education is not correlated with utilization, conditional on pce. Unobserved community effects also are strongly correlated with utilization. Finally, although we cannot call it a causal relationship, having health insurance is positively correlated with inpatient use for men.
REFERENCES
Banks, J., A. Muriel, and J.P. Smith. (2009). Disease Prevalence, Incidence and Determinants of Mortality in the United States and England. Department of Economics, University College, London.
Brown, P., and C. Theoharides. (2009). Health seeking behavior and hospital choice in China’s New Cooperative Medical System. Health Economics 18(0):S47-S64.
China Health and Retirement Longitudinal Survey. (2008). China Center for Economic Research, Peking University. Available: http://charls.ccer.edu.cn/charls/data.asp.
Du, L., and W. Zhang (2007). The Development on China’s Health, No. 3. Beijing: Social Science Academic Press.
Gao, J., J. Raven, and S. Tang. (2007). Hospitalization among the elderly in urban China. Health Policy 84(2-3):210-219.
Lee, N. (2009). Measurement Error and Its Impact on Estimates of Income and Consumption Dynamics, mimeo, Department of Economics, Chinese University of Hong Kong.
Lei, X., and W. Lin. (2009). The New Cooperative Medical Scheme in rural China: Does more coverage mean more service and better health? Health Economics 18:S25-S46.
Lin, W., G. Liu, and G. Chen. (2009). The Urban Resident Basic Medical Insurance: A landmark reform toward universal coverage in China. Health Economics 18(0):S83-S96.
Strauss, J., and D. Thomas. (1998). Health, nutrition and economic development. Journal of Economic Literature 36(3):766-817.
Strauss, J., X. Lei, A. Park, Y. Shen, J.P. Smith, Z. Yang, and Y. Zhao. (2010). Health outcomes and socio-economic status among the elderly in China: Evidence from the China Health and Retirement Longitudinal Study, Pilot. Journal of Population Ageing 3(3):111-142.
Wagstaff, A., and M. Lindelow. (2008). Can insurance increase financial risk?: The curious case of health insurance in China. Journal of Health Economics 27(4):990-1,005.
Wagstaff, A., W. Yip, M. Lindelow, and W. Hsiao. (2009). China’s health system and its reform: A review of recent studies. Health Economics 18(0):S7-S23.
Wooldridge, J. (2002). Econometric Analysis of Cross Section and Panel Data. Cambridge, MA: MIT Press.
World Bank. (2009). From Poor Areas to Poor People: China’s Evolving Poverty Reduction Agenda. Washington, DC: World Bank.
Yi, H., L. Zhang, K. Singer, S. Rozelle, and S. Atlas. (2009). Health insurance and catastrophic illness: A report on the New Cooperative Medical Scheme in rural China. Health Economics 18(0):S119-S127.
Zhao, Y., J. Strauss, A. Park, Y. Shen, and Y. Sun. (2009). China Health and Retirement Longitudinal Study Pilot User’s Guide. China Center for Economic Research, Peking University.


