
4
Social Trends and Child
Maltreatment Trends
Key Points Raised by Individual Speakers
• American families have been undergoing major changes in demographic structure, economic status, and health care coverage, all of which can influence child maltreatment.
• Many sources of data point to a substantial reduction in the incidence of child physical and sexual abuse, but not neglect, over the past two decades.
• The causal factors behind changes in child maltreatment rates are difficult to untangle, but an increased emphasis on prevention may be responsible for the reduction in physical and sexual abuse.
• Despite some positive trends, pockets of severe unmet need continue to exist throughout the United States.
Multiple sources of data on child maltreatment are available, each with strengths and weaknesses. Four speakers at the workshop explored these various sources of data, thereby providing a valuable context for the other workshop presentations. Data on child maltreatment also can be compared with data on broad social trends to probe the causes and consequences of child abuse and neglect. This chapter examines the broad relationships between social trends and child maltreatment trends, while the next chapter looks at more specific causes and consequences.
SOCIAL TRENDS AND THEIR IMPLICATIONS
FOR UNDERSTANDING RATES OF CHILD
MALTREATMENT
Broad social and economic factors can influence trends in child maltreatment. The connection between the two is difficult to ascertain because of the uncertainties in the data and the complex causal relationship factors that contribute to maltreatment. Nevertheless, it is important to monitor and probe social trends to explore their possible effects on child maltreatment, said Christina Paxson, dean of the Woodrow Wilson School of International and Public Affairs and the Hughes Rogers Professor of Economics and Public Affairs at Princeton University. Understanding these trends can indicate what might happen in the future as social and economic influences continue to change and can shape the research agenda to anticipate these changes.
Demographic Structure of American Families
American families look much different today than they have in the past. In the 1950s, only about 5 percent of U.S. births were to unmarried women. After a steady increase over the past five decades, that number is today approximately 40 percent (Ventura, 2009). This does not mean that children are living in households without men, said Paxson. Slightly more than 50 percent of children who are born to unmarried women live with parents who are cohabiting, and these relationships are often stable. Nevertheless, the increase in unmarried births has focused the attention of researchers on what happens in these families. For example, children who are born to unmarried women, whether cohabiting or not, experience a greater frequency of transitions in living arrangements within their households. They are more likely to live with nonbiological fathers, and they are more likely to have step-siblings in a household. “How do these different family structures influence children?” asked Paxson.
Longitudinal data are needed to understand how family structure is related to maltreatment, said Paxson. Such data can reveal the family transitions that have happened over time, how such transitions affect the attachment of parents to children, and the types of risks to which children are exposed. “This is an important area for research and one that is necessitated by the continuing trends that we see in the structure of American families,” Paxson said.
Another notable change has been in the birth rate for teenagers in the United States, which has dropped by approximately 50 percent for all
U.S. women ages 15-19 since 1970, reducing such births from a high of about 600,000 in 1970 to about 400,000 today (Ventura and Hamilton, 2011). Research has suggested that children born to teenage parents are at higher risk of maltreatment, and in that respect the decline in teen births is a “good news story,” said Paxson. The reasons for this drop are contentious because they involve such issues as the provision of birth control and sex education for teens. But the drop provides an opportunity for research to examine how changes in U.S. fertility patterns may have influenced rates of child maltreatment.
Economic Status of American Families
The poverty rate among children is higher than for any other age group in the United States. This rate has varied between about 25 and 15 percent over the past half-century, with a movement upward over the past few years to about 22 percent in 2010 (DeNavas-Walt et al., 2011). The percentage of children with unemployed parents has also gone up in recent years, to about 9 percent in 2011. Increases in caseloads under the Supplemental Nutrition Assistance Program grew from 9 percent of Americans in 2007 to 14 percent in 2011, though growth of caseloads under the Temporary Assistance for Needy Families program has been slower (Isaacs, 2011).
Poverty is an important factor in child maltreatment, said Paxson, and poverty has been worsening. One way to learn more about the effects of poverty on child maltreatment would be to look at the uneven effects of the recession on different parts of the United States. “This will be a good opportunity to look at how economic factors influence maltreatment.”
Health and Health Care
The fraction of poor children without health insurance has been dropping in recent years—from 23 percent of children below 200 percent of the poverty line in 1997 to 12 percent in 2009—even as the percentage of children without health insurance above this income level has remained fairly stable (at about 5 percent) (HHS, 2011). This decrease, made possible largely through Medicaid and state children’s health insurance programs, has been another success story, said Paxson.
The Affordable Care Act will further change access to health care by providing more adults with health insurance. This change may provide an opportunity to deal with some of the physical and mental health problems among adults that can contribute to child maltreatment, though
many of these adults will be covered by state Medicaid programs that may have limited resources to deal with such issues as substance abuse and mental health.
In particular, substance abuse is an important factor in child maltreatment. Recent trends have seen a slight increase in marijuana use, while cocaine use is down slightly (SAMHSA, 2011). “A continuing focus on substance abuse in adults who are parents or could become parents is important,” said Paxson.
Fiscal Capacity of Governments
Projections of the fiscal capacity of governments to support children and families point to “a really difficult time,” according to Paxson. Over the past 20 years, funding to support at-risk families has shifted from state and local budgets to federal budgets (CBO, 2011). This may provide insulation from the budgetary ups and down of state and local budgets, but over the next few decades, federal expenditures could be severely constrained. Support for children and families, as well as for research on children and families, is very likely to be squeezed.
A major factor in the fiscal constraints at the federal level is the projected increase in healthcare spending. This is ironic, said Paxson, because in essence the federal government will be putting more resources into health care and less into programs to support the health and wellbeing of American families. Paxson suggested thinking hard about how to use Medicaid as a vehicle for the prevention and treatment of child maltreatment. The constrained fiscal outlook also calls for the development of cost-effective primary prevention models, sophisticated tools to assess the risk for secondary maltreatment (maltreatment in addition to another kind of trauma identified as the primary descriptor for the situation, e.g., domestic violence), and better methods for tracking and monitoring high-risk families.
Child maltreatment imposes large costs on society in terms of prevention, treatment, legal fees, foster care, and other expenditures, Paxson stated, in addition to the costs to children. “Adding in these other costs is important because it helps make the case that this is an issue that we need to pay attention to.”
DATA SOURCES FOR UNDERSTANDING CHILD
MALTREATMENT
Andrea Sedlak, a vice president of Westat, described the major data sources used to assess national levels of child maltreatment and trends over time.
National Child Abuse and Neglect Data System
The National Child Abuse and Neglect Data System (NCANDS) is a data system created in response to the requirements of the Child Abuse Prevention and Treatment Act (CAPTA). NCANDS centralizes the annual collection, tracking, and analysis of child maltreatment information as reported to CPS agencies in each of the 50 states, the District of Columbia, and the Commonwealth of Puerto Rico. In the early 1990s, states submitted NCANDS data as aggregated counts. Since the mid-to late 1990s, NCANDS has been converting to a case-level data submission system, which now encompasses 51 of the 52 jurisdictions.
NCANDS seeks to obtain a full census annually. States use their own definitions and codes to classify cases and then map their state codes into the NCANDS codes by agreed-upon rules. The original codings come from workers in local agencies who use their state’s system, and these codings are eventually reflected in the NCANDS data.
NCANDS data provide rich information, Sedlak observed. They provide the numbers of screened-in versus screened-out referrals, report dispositions, the sources of reports to CPS agencies, response times, and CPS workforce and caseload levels. They classify child victims by maltreatment type, sex, age, race, ethnicity, disability status of the child, caregiver domestic violence, and caregiver alcohol or drug abuse. They report on fatalities, perpetrators of maltreatment, and services the cases have received.
NCANDS classifies maltreatment into six categories: physical abuse, sexual abuse, neglect, medical neglect, psychological maltreatment, and other. NCANDS also provides indicators of compliance with federal mandates on the absence of maltreatment recurrence, the absence of maltreatment in foster care, and first-time victims.
National Incidence Study
The NIS, which is also mandated by CAPTA, is conducted approximately once every decade under a contract from the Administration for
Children and Families. It seeks to estimate broadly the national incidence of maltreatment through both investigated and noninvestigated cases of child abuse and neglect. The NIS collects and categorizes data according to standardized definitions for types of child maltreatment, the severity of maltreatment, and key demographic characteristics of maltreated children and their families.
The NIS began with definitions for the Harm Standard in 1979-1980 and modified definitions for the Endangerment Standard in NIS-2 in 1986. The Harm Standard definitions are stringent in requiring that a child already have experienced demonstrable harm from abuse or neglect before they could be counted in NIS estimates. The Endangerment Standard includes children who were endangered by the events of abuse or neglect that they experienced.
Unlike NCANDS, which is a census-based approach, the NIS uses a representative sampling of counties. The latest cycle (NIS-4) collected data from a nationally representative sample of 122 counties in 2005 and 2006. Information gathered in each county includes CPS data, but it also includes cases seen by individual sentinels, or community representatives, in public schools, public health departments, public housing, juvenile probation, law enforcement, hospitals, day care centers, shelters, and other institutions.
Also unlike NCANDS, which relies on the states’ definitions of abuse and neglect, the NIS applies standardized definitions to case details. Its reports include the numbers and rates of maltreated children by maltreatment type; child victims by sex, age, race/ethnicity, disability, and school enrollment; family characteristics by employment, socioeconomic status, family structure and living arrangement, grandparent caregivers, family size, and metropolitan status of residence area; perpetrators’ characteristics; and maltreated children by the sources recognizing their maltreatment.
“We obtain narrative descriptions of what happened to this child,” Sedlak explained. “Who did it? What have you seen in terms of injuries? What were the actions or omissions going on? What else was going on?” These reports are then evaluated in the terms of the standardized definitions that the NIS applies to classify maltreatment events, injuries, and circumstances.
The maltreatment classification has eight overarching categories: physical abuse, sexual abuse, emotional abuse, physical neglect, educational neglect, emotional neglect, other maltreatment, and maltreatment
that is not countable in the NIS. These eight categories encompass 60 separate codes that describe the nature of the maltreatment.
In addition, the NIS provides detailed information about CPS investigation rates by maltreatment type and recognition source, CPS agency structure and practices related to investigation rates, CPS screening policies related to uninvestigated children, and sentinel training and reporting of maltreatment.
Other Data Sources
The Adoption and Foster Care Analysis and Reporting System (AFCARS) is a database of all case-level information on foster children under the care of state child welfare agencies, including information on foster and adoptive parents. States are required to submit AFCARS data on a semi-annual basis to the ACF, which uses the data to inform a variety of initiatives.
AFCARS does not focus on abuse or neglect, but it includes the reason for a child’s removal into foster care, such as physical abuse, sexual abuse, neglect, and other potential reasons. Many states can now link their NCANDS case-level data with AFCARS data to provide indicators of maltreatment recidivism in foster care. Unfortunately, said Sedlak, this system does not support tracking individual children across years.
Finally, Statewide Automated Child Welfare Information Systems (SACWISs) are in place in 36 states, with 3 in development and the other states using non-SACWIS models. SACWISs are comprehensive automated case management tools. States use their SACWIS data to provide NCANDS and AFCARS reports.
From Data to Knowledge
Both the NIS and NCANDS reveal national trends. NCANDS provides annual trends, including trends in report sources, dispositions, response times, and overall victimization rates. The NIS shows long-range trends over 7-to 12-year periods in overall maltreatment and in major maltreatment categories. It also provides significant changes in victimization rates (overall and by category) for subgroups (by child and family characteristics).
However, NCANDS does not provide trends by maltreatment type, although this information can be extracted from the raw data. Sedlak urged that these important trends be part of the national analysis and distribution of the data, rather than having individual researchers extract the
trends from the data. The NIS does not report trends in specific subforms of maltreatment, though again more information can be extracted from the data.
In NCANDS, states’ varied definitions of maltreatment can affect trend statistics. By contrast, the NIS directly codes case-level descriptions of maltreatment through notes and narratives. NCANDS loses some maltreatment event information, whereas uninvestigated maltreatment is filtered through sentinels’ observations in the NIS. Changes in sentinels’ processes can affect trend statistics, so NIS-4 established baselines to calibrate these changes. An analysis done by Sedlak and her colleagues showed the NIS found more multiple-maltreated children than NCANDS sees from its CPS sources. “When you are using something for case management, you suffice in terms of your coding,” she said. “But we are losing stuff because of that, or we are not seeing it. It is buried.”
Future Opportunities to Enhance Use of Data Sources
Important uncertainties surround the meaning of findings from NCANDS and NIS, said Sedlak. NCANDS makes little effort to understand the findings in relation to agency policy or administrative practice. Administrative changes in a few states that drive an overall trend are buried in appendixes or brief summary notes, with no analysis of trends. In contrast, NIS has improved on this. The NIS-4 had included supplementary studies of CPS agencies’ organization, practices, and policies and analyses to relate those results to the overall NIS results on investigation rates and uninvestigated children. For example, analyses have found lower rates of investigation in places that relied on referrals being filtered through hotlines. “Things like that that are important to know about how your practice [and] your policy may be affecting what you are seeing … and how successful you are in reaching maltreated children,” said Sedlak.
A major problem is that the findings from these data sources are not being well disseminated, Sedlak stated. States hardly use, publicize, or even know about their own NCANDS data trends. Many states do not use or know how to use their SACWIS data to examine patterns in caseloads, to compare to other systems’ data, to make sense of policy changes, or to make other improvements. Federal clearance processes introduce extensive delays in releasing reports on important findings, not just in HHS, but in other departments as well.
National systems provide data on maltreated children, but they do not regularly collect data on representative samples of both maltreated
and nonmaltreated children to see how the risk of maltreatment varies across settings and time periods. Nor are maltreatment data in other systems being used or improved. For example, the National Crime Victimization Survey interviews individuals ages 12 and older about their criminal victimization experiences every 6 months, repeating these interviews for 3 years. Adding proxy interviews on victimization of younger children could provide victimization data for all ages. Surveys with children as young as 9 have been comprehensive, and tools exist for measuring self-reports of neglect in very young children using picture methodologies on computer-assisted systems.
Another missed opportunity is the National Incident-Based Reporting System, which provides detailed information about crimes known to police, including injuries, offenders, and victims. Codes that show whether law enforcement referred to CPS or vice versa and designating offenders as caretakers or noncaretakers when victims are children would provide a rich database on maltreatment.
Finally, Sedlak observed, no one knows how many children in the United States are sexually abused or assaulted. Law enforcement data cannot now be compared with NCANDS, NIS, or other data sources to arrive at this number. “Given that this is such an important policy issue, it is alarming to realize that we don’t know and we have no plans for getting” this information. In addition, the other victimization experiences children undergo, such as abduction by family and nonfamily members, peer victimization, and dating violence, are largely undetected. Many children are traumatized in multiple ways that do not come under the jurisdiction of CPS agencies. “Without understanding that, we really can’t understand what we need to do to intervene,” Sedlak concluded.
Discussion
During the discussion session, Bernard Guyer from Johns Hopkins University raised several issues about the underlying theory of measurement in the field of child maltreatment. Distinguishing incidence and prevalence could make a big difference in looking at trends. Similarly, is maltreatment an acute disease or a chronic disease? Once children have been maltreated, are they maltreated for life? How are children seen in multiple places for maltreatment tallied? Finally, he asked whether changes in birth cohorts could account for the decline in abuse seen in national data.
Sedlak responded that the NIS gives just period prevalence rates, while NCANDS also gives the period rate and numbers for the children
investigated over the course of the year. She also said that NCANDS and NIS make efforts to deduplicate cases through data matching and modeling, and that considerable work has been devoted to improving the reliability of individual data sources.
Richard Barth, University of Maryland, pointed to the use of vital statistics such as birth records as a source of population information. By linking birth records with other administrative data, important information could be uncovered more quickly than in planned longitudinal studies.
CHANGES IN RATES OF REPORTED CHILD
ABUSE AND NEGLECT
Lisa Jones, a research associate professor of psychology at the University of New Hampshire’s Crimes Against Children Research Center, described one of the more notable—and contentious—data points discussed at the workshop.
Evidence for a Decline in Physical and Sexual Abuse
NCANDS data indicate a steady decline in physical abuse and sexual abuse over the past two decades (Figure 3). According to these data, sexual abuse has declined by 62 percent since 1990, while physical abuse has declined by 56 percent. Neglect also has declined, but by much less—just 10 percent since 1992. These data embody “one of the most interesting and important events that have occurred in the epidemiology of child maltreatment,” said Jones.
NCANDS data come from CPS agencies across the country and represent substantiated cases of maltreatment. Jones noted that the declines are seen across the entire country, not just in a few states.
Some have expressed concerns that state and local finances or worker caseloads might be affecting CPS agencies in such a way that fewer child maltreatment reports are being indicated or substantiated. However, Harvard School of Public Health researchers explored this possibility and found no evidence to support this (Almeida et al., 2008). Instead, they found evidence that supports “a true decline in incidence of substantiated child sexual abuse cases during the latter part of the 1990s” (p. 373). Furthermore, research by Jones and colleagues (2001) found no evidence that less severe abuse and neglect dropped more than severe types of maltreatment, which would be expected if CPS agencies were triaging cases.
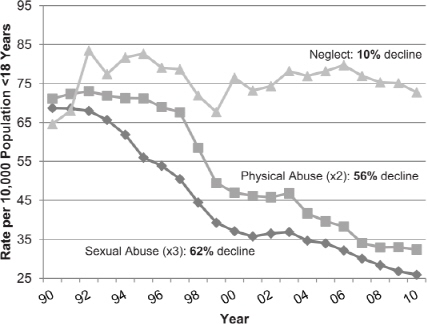
FIGURE 3 Substantiated cases of maltreatment compiled by NCANDS, 1990-2010.
SOURCE: Jones, 2012.
Other data sources such as the NIS support the trends seen in NCANDS data. Between NIS-3 in 1993 and NIS-4 in 2005, sexual abuse was down 44 percent and physical abuse was down 23 percent, even though the sentinel data in the NIS come from a different source than the NCANDS data.
Self-reported data from a school survey in Minnesota with 6th-, 9th, and 12th-graders show a decline of 28 percent in children reporting sexual abuse and 20 percent in children reporting physical abuse from 1992 to 2010. Similarly, the National Crime Victimization Survey shows declines in juvenile sex victimization of 52 percent between 1993 and 2005.
Many correlates of child maltreatment show remarkably similar trends. Teen birth rates underwent a 48 percent decline from 1994 to 2009, youth runaways rates were down 66 percent from 1994 to 2009, teen suicide declined 43 percent from 1994 to 2007, teen drug use was
down 27 percent between 1997 and 2007, and domestic violence fell 60 percent from 1993 to 2005. “What is remarkable and convincing about these trends is that we are not talking about just one data source, but extremely similar trend patterns coming from many different studies and sources,” said Jones.
Possible Explanations for the Decline
Jones suggested several possible explanations for the declines. One possible source could be economic fluctuations. The greatest declines occurred in the 1990s, when the United States was going through a relatively positive economic phase, with a slower decline in the past decade. However, throughout the past decade, and even in the recent recession, rates of physical abuse, sexual abuse, and neglect have continued to fall. “This suggests that we need to look for other explanations,” Jones said.
An “optimistic possibility” is that the tremendous amount of work done in the past several decades to prevent child maltreatment is having an effect. An observation supporting this idea is that sexual abuse declined first and then physical abuse. Sexual abuse received a lot of attention during the 1980s and early 1990s through, for example, prevention programs in schools and increased protection efforts in youth programs like the Boy Scouts. There is a possibility, said Jones, that these efforts had an effect on maltreatment.
Also starting in the late 1980s and increasing in the 1990s, the criminal justice system became more involved in child abuse and domestic violence. Consistent with the trend patterns, this involvement centered more on sexual abuse and physical abuse and less on neglect. “It may be that the increased incarceration and prosecution of offenders is having a direct effect,” Jones said. “It may also be having a preventive effect as it conveys the idea that these are serious crimes and that it is something that officials take seriously.”
Better mental health and trauma treatment may have reduced child maltreatment by reducing intergenerational transmission. In addition, access to psychopharmacological medication to treat depression and anxiety may have had an effect.
Finally, Jones pointed to something less measurable: cultural norms around caring for and protecting children. These may have improved as researchers learned more about what children need. “On a national level, some of that information [may have] gotten through to families in a way that decreases the amount of maltreatment that we have been seeing.”
Contrasting Indicators
Jones also cited two indicators from the child welfare data that do not track the declines in sexual and physical abuse—neglect and child fatalities. The much smaller decline in neglect may indicate that these cases are harder to prevent and treat. Alternatively, a decline in child neglect may not be showing up in the data because of changes in definitions and increased awareness of the problem. As support for this possibility, NIS data found reduced levels of physical and educational neglect from 1993 to 2005. But a category called emotional neglect underwent a dramatic increase. Researchers have found that this increase was explained partly by an increase in the reporting of situations where children were witnessing domestic violence and were in households exposed to drug use. Shifting standards for the sentinels reporting on neglect may explain these findings and mask what would otherwise be a decline in neglect in recent decades.
Child maltreatment fatalities have increased since 1993, according to NCANDS data. However, other child homicide data from the FBI and other sources show declines in child fatalities. The data seem to indicate, said Jones, that states are changing how they count child maltreatment fatalities and how they are delivering that information to NCANDS.
Future Opportunities to Use Data
Jones urged that the data available today be used more effectively. NCANDS and NIS data provide critical public health information on child maltreatment trends, but this information is being underused. The Children’s Bureau needs to publicize these data more effectively to help professionals, media, and the public learn about and understand trends.
Also, delays in the release of NIS data have been troublesome and have limited awareness about and impact of the findings that come from those data.
Finally, more funding and research focused on epidemiological approaches to child maltreatment can reveal what is working so that interventions have an even greater effect than they have had in the past.
Discussion
The reliability of the data sources demonstrating a reduction in maltreatment rates were discussed throughout the workshop. Putnam said he and his colleagues have seen dramatic increases in maltreatment in recent years that are not being counted by data systems. For example, in Ohio in
2010, just three of the seven children’s hospitals in the state reported 90 cases of inflicted head injury to CPS, yet the state’s SACWIS reported just 10 cases for the same period. He asked, “How do we do better public health surveillance? … How do we get a much better system that actually tracks what is happening not only at the state level, but at the community level where we can intervene with preventative interventions?”
Sharon Newburg-Rinn from the Children’s Bureau raised the issue of whether the increased use of differential response systems, which are described in Chapter 7, could account for part of the drop in victimization rates.
Leventhal pointed to data on hospitalizations of children that are collected by all hospitals and are available through the Kids’ Inpatient Database. Child abuse codes in that database are another way of examining the occurrence of serious injuries to children due to abuse. According to those data, he added, serious injuries of hospitalized children did not decline from 1997 to 2009, in contrast to the NCANDS data.
CHILD MALTREATMENT REPORTING
PRACTICES AND PATTERNS
Melissa Jonson-Reid, a professor of social work and director of the Brown Center for Violence and Injury Prevention at the George Warren Brown School of Social Work, Washington University, discussed some of the complications in the systems used to detect, report, measure, and respond to child maltreatment.
First, she observed, different criteria lead to very different estimates of the numbers of children subject to maltreatment. Using the more inclusive endangerment standard, NIS-4 arrives at a maltreatment incidence of about 1 in every 25 children. Using official report data collected by the states, NCANDS arrives at a figure of roughly 1 in 10 children as alleged victims of maltreatment. In contrast, considering only victims with substantiated reports brings the single-year count down to about 1 in 100 children.
However, Jonson-Reid took issue with the substantiation standard. “Using substantiation or the level of harm standard as an indicator that maltreatment has occurred or not in resource or policy is simply not a good idea,” she said. Many children in the unsubstantiated category are facing situations of equal risk. The substantiation standard was created as a decision-making point in child welfare. Substantiation or something
like it may be needed to guide decisions to refer to court, but in other situations meaningful measures should be used that can be mapped onto the need for services. In addition, Jonson-Reid said, the use of only substantiated cases in research can be misleading if unsubstantiated cases are included in the controls.
Changing Definitions
National data systems have made important advances since 1992, Jonson-Reid observed. However, state-level definitions of maltreatment, requirements for services, and designation of professions required to report undergo continual change can complicate these measures. For example, as national measures of child maltreatment were declining over the past decade, reports were increasing in the state of Oregon. National studies of child maltreatment reporting and response need to be large enough to control for state policy, researchers need to look at state-level changes, or uniform national standards need to be adopted. “We have a long way to go in coming to a consensus about what we mean by maltreatment from place to place and how best to measure it in relation to child well-being,” she said.
Prevalence Estimates
Jonson-Reid also looked more closely at several existing prevalence estimates. According to Finkelhor et al. (2005), about 1 in 7 children between the ages of 2 and 17 were victims of child maltreatment during a 1-year time frame. Estimates of prevalence among low-income populations were even higher. In the Cleveland area, life-table estimates indicated that 49 percent of African American children and 21 percent of white children would be subjects of reports of alleged child abuse or neglect by their tenth birthday (Sabol et al., 2004). In a California study, about one-third of African American children were reported by their fifth birthday compared to less than 15 percent for other ethnic groups. Children born to lower income families had a rate of referral over 2.5 times higher than others (Putnam-Hornstein et al., 2011)—as high as 1 in 2. Jonson-Reid also noted that mandated reporters do not receive standardized training and, as a result, the level of understanding of what is to be reported varies widely across districts.
Jonson-Reid and colleagues (2009) examined whether such results are influenced by reporting bias as opposed to reflecting significant need. Examination of different kinds of reports across groups indicates that the
effects of bias are limited and that “there are pockets of unmet need in our country, which in various respects should not be of particular surprise.” This finding in turn affects consideration of whether the reporting system should be limited or expanded. Families should not be overidentified based on biases unrelated to maltreatment. On the other hand, families that need services should not be underreported to avoid bias. Data from a variety of sources suggest that the majority of families reported to CPS have service needs, said Jonson-Reid. “I have difficulty with thinking about shrinking what we have as the surveillance system,” she concluded.
The reporting system could be expanded by increasing the pool of mandated reporters or by increasing the types of reports considered maltreatment. However, if people are categorized as needing services, those services should be available to them, Jonson-Reid argued. Today, roughly one-third of the children with screened-in reports in CPS get some kind of intervention, and most of those interventions consist only of assessments or low-intensity case management approaches, which typically depend on referrals to other sources. “My concern in expanding the system at this point is that we are already underresourced and if we move it to a broader level, we ought to be thinking about how we also expand those resources.”
Measurement Issues
Some types of maltreatment classifications are extremely useful, Jonson-Reid observed. Unmet medical needs or the occurrence of sexual abuse demand responses. But in moving from immediate needs to longerterm well-being, definitions of maltreatment become less clear. For example, research indicates that neglect can have consequences as dire as those associated with physical or sexual abuse. Furthermore, many children experience more than one type of maltreatment. Research continues to explore whether certain types or combination of types of maltreatment are useful in informing responses.
Severity and the need for services raise other measurement issues. For example, initial gatekeeping points are sometimes confused with assessment of severity. In Missouri, which uses a highly structured and computerized decision-making process, many more cases are screened in than in other states. As a result, the child welfare population may be very different in different places. Also, it is problematic to have recurrence be part of how severity is measured as this means that a first report of maltreatment must have much higher levels of other harm to be considered
severe than a second or third report of maltreatment. The resulting concern is that this tends to delay intervention until after several CPS contacts.
In general, most child welfare assessments are linked to safety and permanence and less so to well-being. Few child welfare systems have universal screening for other indicators of need such as a young child’s developmental status or the presence of a mental health disorder. “While much more attention has been paid to documenting outcomes, we are less clear about ways to triage,” said Jonson-Reid. “This means consideration of harm apart from safety in the context of developmental timing, family, and community resources.”
Communication Among Systems
Finally, many of the children and families who come to the attention of CPS are already engaged in multiple systems. For example, in research Jonson-Reid has done, 25 to 30 percent of children already had contacts in special education or mental health treatment prior to coming into the system. When these children are followed over time, they have high rates of emergency room use, juvenile delinquency, and so on.
The fact that these systems rarely “talk” to each other prevents researchers and service providers from better understanding these families, hinders cross-sector coordination and policy planning, and damages the ability to estimate costs. Jonson-Reid said that integrated data systems are needed to facilitate planning, contribute to cost estimates, and help measure system-relevant outcomes.
Discussion: Data Lags
Several speakers raised the issue of how to get data from national systems more quickly. “How do we get a system that is current for child maltreatment?” asked Putnam. “We wouldn’t accept a 2-year lag for flu cases or Salmonella.”
Jones agreed that the 2-year lag is “terrible” and should be improved. But she also observed that the data systems have gotten better—for example, by providing more disaggregated data. One need, as Jonson-Reid pointed out, is for data systems that can work together. Today, criminal justice data, CPS data, and medical data are not coordinated. Paxson added that a shortcoming of the NIS is that it is done periodically. “We wouldn’t monitor influenza every 5 years.” Computer technologies could do continuous tracking of sentinels, which would provide more continu-
ous data. In addition, household-level data are needed to go beyond the population data from NCANDS and NIS.
Sharon Newburg-Rinn from the Children’s Bureau described some of the difficulties in getting data processed and released quickly, such as delays in court process and in the substantiation of reports. However, recommendations from researchers to speed the process could have an effect, she said.


