
When chemists want to identify the molecules in an unknown sample—say, a rock from another planet—the first thing they do is measure its spectrum. That is, for instance, how space scientists detected water on the Moon and methane on Saturn’s moon, Titan.
It may seem surprising that mathematical scientists are interested in measuring spectra too, in a whole host of applications that seem to have little to do with the original meaning of the word. To detect the edges of a cancerous region in a mammogram, they can use an “image segmentation” program that computes a spectrum. Similarly, problems like designing a computer chip that runs efficiently, identifying communities within a social network, or creating a computer network that won’t shut down if some of the computers go offline, all involve analyzing the spectra of networks, or what mathematicians call “graphs.”
To understand what a molecular spectrum is, think of a molecule as a collection of balls bound together with the aid of springs. The springs are always vibrating, and there are certain modes of vibration that, if left alone, will keep on going indefinitely. Each mode of vibration corresponds to a specific energy. The molecule prefers to absorb and emit photons with exactly the right energy to excite one particular mode. Those photons can be detected by a spectrometer, and the characteristic frequencies of the photons allow you to identify the molecule.
A network, which is a type of graph (a mathematical structure used to represent relationships between objects), is a more general mathematical version of the balls-and-springs model of a molecule. The most obvious difference, perhaps, is that networks of transistors or people don’t vibrate and therefore don’t have an obvious energy function
associated with them. However, this difference is only superficial. In fact, mathematicians have derived a way of measuring energy on any network.
The way they do this is with something called a Laplacian, which has characteristic frequencies or eigenvalues, just like a vibrating molecule. Those frequencies collectively form a spectrum, and this spectrum is in many cases the best way to gain an overview of the network. For instance, it helps you find cliques (closely connected sets of nodes) and transportation bottlenecks.
But there is a problem of scale, because the networks of today are much larger than those in molecules. For example, the users of Facebook form a social network with nearly 1 billion active users. An Intel Xeon chip is a network with 800 million transistors. The Web is a network with 46 billion Web pages (and growing). Mathematical scientists have to design, in effect, a new kind of spectrometer to compute the spectra of such immense graphs.
Laplacians have a very long history—in fact, they predate both the concept of molecular spectra and the concept of graph theory. They were first defined in the 19th century to solve problems of heat flow and wave motion. The heat equation says that heat will flow toward any point that is colder than the average of its neighbors and away from any point that is warmer. The wave equation says that a point on a vibrating drumhead will accelerate in the direction of the average of its neighbors. In both cases, the operation “averaging the neighbors” is performed by a differential operator called the Laplacian (see Figure 17).
In the drum example, the eigenvalues of the Laplacian correspond to particularly simple modes of vibration, which we hear as the fundamental frequency and the overtones of the drum. In the heat equation, the eigenvalues have a slightly different interpretation. A cooling bar of metal has a relaxation time that governs how rapidly the bar cools off. This time is inversely related to the first (or smallest) eigenvalue of the Laplacian.
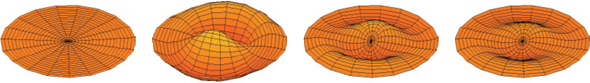
17 / Fundamental modes of vibration of a drum. Notice how certain frequencies of vibration isolate certain regions of the drum. Graph spectra are based on a similar idea, with the drumhead being replaced by a network of springs. /
In 1970, mathematician Jeff Cheeger proved that Laplacians are good at detecting bottlenecks in surfaces and higher dimensional objects called manifolds. The reason is especially apparent in the case of heat flow. If a metal bar is shaped like an hourglass, the constriction means that the first eigenvalue of the Laplacian will be small. In turn, this implies that the relaxation time will be longer than for a rectangular bar, and that is indeed what one measures.
The Laplacian on a network is defined analogously to the Laplacian on a surface. It is again computed by taking the difference between a function’s values at a point and the average of its values at the neighboring points. In 1985, it was shown that Cheeger’s result applied perfectly to this new setting. The first eigenvalue of the Laplacian, which is relatively easy to compute, is a good proxy for the width of the narrowest bottleneck, which is harder to determine.
A network has a bottleneck if it contains two (large) subgraphs with (relatively) few connections between them. (There are some subtleties connected with the words “large” and “relatively.”) A driveway isn’t a bottleneck, because if you cut it you take only one house out of the network. However, if two large cities are joined by only one bridge—such as the Ambassador Bridge between Detroit and Windsor, Canada—that bridge is definitely a bottleneck. Even if you include the Detroit-Windsor Tunnel, creating a second link between the cities, the ratio of the number of cuts required to disconnect the network (two) to the minimum number of people taken out of the network (216,000 on the Windsor side) is still very small (2/236,000, or 0.00001) (see Figure 18).
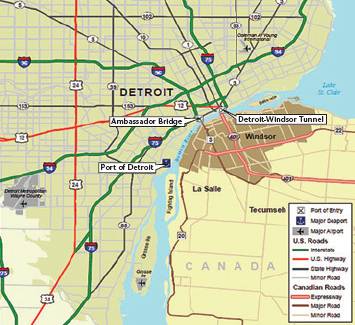
18 / The Ambassador Bridge connecting Detroit, Michigan, and Windsor, Ontario, is a very visible example of a “miminum cut.” /
In a map of a city it is easy to spot the links that, if cut, have the largest effects on connectivity, especially if there is a river flowing through it. Such a link is called a sparsest cut, and in a typical graph, it is much harder to spot. But there are many instances in which we want to make those cuts, such as when we wish to decompose a network into simpler subgraphs with minimal effect on connections. For instance, a Laplacian-based method has been used to extract features from images. The surface of an object can be approximated by a mesh. The spectrum of this mesh can be used by a computer to identify distinct regions of the image without any human input.
Cheeger’s work was important because it related something that was known to be very difficult to compute (sparsest cuts) to something that is much easier to compute (eigenvalues). It should be noted that Cheeger’s theorem is an estimate, not a precise equation. However, the connection has proved robust enough to make the spectrum of the Laplacian an important tool in graph partitioning.
Spectral methods—a class of techniques to numerically solve dynamical (or constantly evolving) systems—can be used to design new networks as well as to study existing ones. For example, networks with the largest possible eigenvalues, called “expander graphs,” have some remarkable properties. They convey information very rapidly, so it is easy to route messages from one point to another. They have no bottlenecks, so they cannot be disabled by the failure of a few nodes or links. Unfortunately, they are not so easy to design, so research in this area is currently a high priority.
Finally, although eigenvalues are easier to compute than sparsest cuts, even they get difficult when you are faced with monster networks consisting of millions or billions of nodes. Until recently, algorithms for finding the eigenvalues did not scale well and were not practical for such large networks. However, it now appears that this barrier has been breached.
Until recently, algorithms for finding the eigenvalues did not scale well and were not practical for such large networks. However, it now appears that this barrier has been breached.
In 2004, a method was devised for solving equations involving graph Laplacians that was significantly faster (in theory) than any previously known method. Like many great scientific advances, the strategy was wonderful, completely unexpected, and yet in retrospect completely natural. The idea is to replace the Laplacian of the graph with the Laplacian of a well-chosen subgraph. If this is done carefully, the spectrum is almost undisturbed yet the graph becomes much sparser. Imagine ripping out 95 percent of the streets in Manhattan and having everybody’s commute time remain almost the same! That is roughly what this method managed to do.
There is still plenty of room for practical improvement, and some substantial improvements have already been made. The long-standing dream of finding sparsest cuts in approximately linear time—in other words, being able to understand the structure of a network almost as quickly as one can read in the data—now appears much closer.


