
Assessment and Commentary on EPA’s Analysis
As indicated in Chapter 1, the intent of the U.S. Environmental Protection Agency’s (EPA) analysis was to assess the differential costs of nutrient load reduction under the numeric nutrient criteria (NNC) rule vs. Florida’s narrative rule. This chapter accepts the EPA definition of the incremental effect of the NNC rule and focuses on the way EPA estimated that effect and the costs for different sectors including municipal wastewater facilities, industrial facilities, agriculture lands, urban stormwater, and septic systems. The associated costs of governmental administration are also discussed. This chapter also includes some initial descriptions of the current regulatory requirements for each sector and how regulatory uncertainties can lead to different assumptions about the effect of the NNC rule on the level and timing of costs. Chapter 3 provides an expanded discussion of the incremental effect of the rule and how uncertainty about the rule change can affect incremental costs.
EPA COST ANALYSIS METHODS: OVERVIEW
The first part of EPA’s analysis was conducted for point sources, identifying the number of point sources that would have to improve treatment in response to the NNC rule, the likely technological upgrades that would be implemented, and the cost of upgrades based on unit costs multiplied by the actual flow rate of each point source. The next step in the EPA analysis was to determine the potential incrementally impaired waterbodies—that is, an estimate of those waters that may be expected to be in noncompliance with the numeric nutrient criteria, but that would not be impaired under the
narrative rule. Once this set of waters was defined, the analysis proceeded to estimate the location and amount of land area that would require load controls to meet the numeric nutrient criteria in the waterbody. For the stormwater and agricultural sources, EPA identified the corresponding acreage draining to the potential incrementally impaired waterbodies, reduced the acreage considered based on best management programs that were already in place, selected a set of BMPs that EPA staff deemed adequate and cost-effective, and then applied a unit cost to the resulting acreage to estimate the total cost for the two sectors. For septic systems EPA determined the number of systems within 500 feet of a waterbody in a potential incrementally impaired watershed and multiplied this number by unit cost to upgrade septic systems to reduce their nutrient loads.
Several key regulatory assumptions were made by EPA and are discussed in the subsequent sector analyses only if the Committee took issue with them. These assumptions include the following
• Impaired waterbodies where a total maximum daily load (TMDL) has already been developed based on the narrative criteria were not considered, assuming that the TMDLs would serve as the basis for site-specific alternative criteria (SSAC), if needed.
• Waters that are currently listed as impaired based on the narrative criteria were also not considered, because it was assumed that a TMDL for nitrogen (N) and/or phosphorus (P) would be developed and that this TMDL would serve as the basis for an SSAC determination.
• Municipal and industrial plants discharging at 3 mg/L for total nitrogen (TN) and 0.1 mg/L for total phosphorus (TP) were considered “in compliance.”
• The cost of actions to reduce pollutant loads associated with implementation of the statewide Stormwater Rule, the Urban Turf Fertilizer Rule, the Florida Department of Environmental Protection (FDEP) Dairy Rule, and Concentrated Animal Feeding Operation (CAFO) Requirements would not necessarily be accruable to the NNC rule, since these programs are already in place.
Three analytical assumptions of the EPA analysis were accepted for this chapter (and are returned to in Chapter 3):
• The definition of the incremental effect of the NNC rule was defined and limited to (1) waters that would be newly listed and determined to be stressed by nutrients and (2) National Pollutant Discharge Elimination System (NPDES) municipal and industrial sources that would receive certain concentration limits in their discharge permits.
• EPA assessed the incremental effect of the NNC rule at a single point in time, assuming no further changes would occur under the narrative process (which was the baseline), instead of comparing the future outcomes of both processes over time.
• The analysis assumed constant temporal conditions in such factors as population, land use, crop types, management practices, industrial activities, and climate, even though the analysis acknowledged that the effects would occur over time (for example, there was a 20-year horizon for amortizing capital costs).
Determination of Incrementally Impaired Waters
EPA defined one incremental effect of the NNC rule as the number of waterbodies that would be listed as impaired under the numeric nutrient criteria but not under the narrative criteria. Had monitoring data for N and P concentrations been available for all waterbodies, this would be a simple exercise. However, out of a total of 3,765 freshwater stream segments in Florida, a very large fraction (84 to 89 percent) lacks sufficient monitoring data on N and P concentrations to make an assessment, based on the application of Florida’s Impaired Waters Rule (IWR) (FDEP, 2011). For the 1,444 lake segments in Florida, 59 to 78 percent lack sufficient information to be assessed (FDEP, 2011), which covers a substantial area of the state, particularly in the north and northwest (see Figure 2-1). Thus, of the 5,209 freshwater WBIDs in Florida (see Chapter 1 for the definition of a WBID), approximately 77 to 86 percent cannot currently be assessed.1 Despite a long record of water quality monitoring in Florida, the vast majority of the waterbodies have insufficient information to determine whether action is needed.
Streams and Lakes2
Faced with this limitation, EPA opted for the following approach to estimate the number of incrementally impaired streams and lakes. Using the
![]()
1 The range in unassessed segments reflects the difference in the amount of information required to assess under the current narrative criteria (one year of data) compared to the NNC (three years), as well as differences in the quality of the data that EPA and FDEP considered necessary to determine whether a WBID can be assessed. Furthermore, the sentence is not implying that 77 to 86 percent of Florida waters have no monitoring data, just that there is not enough data to make a determination of impairment based on the requirements of the IWR.
2 In this section, WBID and waterbody are interchangeable. WBID is used when citing data on the number and status of impaired waterbodies from the EPA and FDEP documents. Also, TMDLs are developed for individual or groups of WBIDs, so this term is also used when discussing the TMDL process.
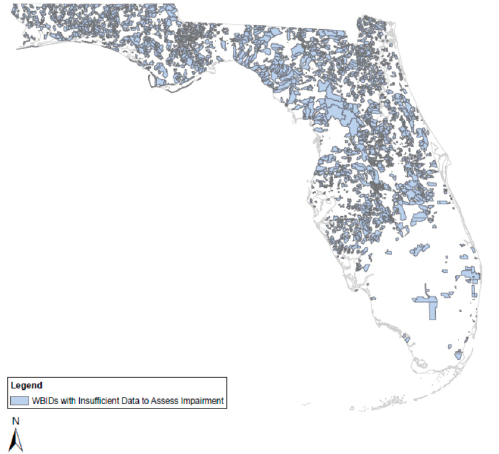
FIGURE 2-1 WBIDs with insufficient data to assess impairment.
SOURCE: EPA analysis for National Academy of Sciences.
FDEP database of WBIDs and monitoring data for the past five years from IWR Run 40 (a subset of Florida’s water quality data), EPA first identified potentially impaired waterbodies by comparing their monitoring data to the numeric nutrient criteria. WBIDs where a nutrient-related TMDL had already been established were excluded, based on the assumption that FDEP would seek SSACs for those WBIDs and/or that “controls to reduce nutrients already required in the absence of EPA’s rule would be sufficient.” In addition, EPA identified WBIDs adjacent to lakes to which downstream protective values could apply.3 Finally, all of the unassessed waters were excluded by EPA from consideration as potentially impaired due to the new
![]()
3 The NNC rule requires the application of a downstream protective value when choosing the criterion for a stream segment that enters directly into a lake. That is, if a stream directly enters a lake and the lake criterion is more stringent, then the lake criterion would apply to the stream.
rule by assuming that unassessed waterbodies are likely to be unimpaired, given Florida’s focus on monitoring the most polluted streams and lakes. In other words, EPA assumed that if a waterbody were likely to be impaired, Florida would have already known about it and monitored it under the existing program of narrative criteria. Using these assumptions, EPA determined that only 325 WBIDs potentially exceed the numeric nutrient criteria [see Exhibit ES-4 in EPA (2010a)]. Given EPA’s assumptions, the Committee considers the EPA estimate to be a lower bound on the number of incrementally impaired waters that would be listed due to the new rule.4
FDEP used a different approach for estimating the number of potentially impaired waters that would be listed due to the new rule and determined that there are between 424 and 546 incrementally impaired WBIDs under the NNC rule (FDEP, 2011). The FDEP approach was based on a statistical analysis, using the failure rate of assessed waterbodies under the current narrative criteria to predict the number of unassessed waterbodies that would fail under the numeric nutrient criteria. FDEP developed different statistics for the various “nutrient watershed regions” identified by EPA in the new rule (see Table 1-1). While using regionalized statistics acknowledges biogeographic and climate differences, no other consideration was given to the characteristics of a watershed that may result in impairment. It is unknown whether prior information from the currently listed WBIDs is a good predictor of the status of the unassessed WBIDs. The size and land use composition of WBIDs varies substantially, which can lead to a significant over- or underestimate of the impaired acreage. Thus, it is not possible to determine whether this approach represents an upper bound on the incremental number of potentially impaired waters due to the new rule.
A more defensible approach than either of the previous ones would take into consideration the characteristics of the various WBIDs to predict the likelihood that they would fail to meet the narrative criteria or the numeric nutrient criteria. For example, using the land use data and land use management statistics of the assessed WBIDs, one could establish a relationship between the likelihood of impairment and the level of urbanization, number of septic systems, loading from NPDES-permitted sources, agricultural production, the level of adoption of agricultural and stormwater BMPs in a given WBID, etc. The land use information for such an analysis is readily available in geographic information system (GIS) format. FDEP has a database of septic systems in each WBID. Land management information could be obtained from FDACS (for agricultural BMPs implemented) or from MS4 permittees (for stormwater BMP adoption). While this approach also entails a certain level of uncertainty, the uncertainty should be easier to estimate and report. In addition, since the potential incrementally impaired
![]()
4 Assuming EPA’s definition of incrementally impaired.
WBIDs can be identified, their specific acreage can be considered for the analysis, reducing this source of uncertainty.
Springs
EPA identified springs with any monthly geometric mean nitrate-nitrite concentration greater than the numeric nutrient criterion as impaired. As with streams and lakes, EPA removed from the resulting list of springs those that are currently on Florida’s 303(d) list of impaired waters. This analysis resulted in 24 incrementally impaired springs (see Exhibit ES-4 in EPA, 2010a). Waters with insufficient data to determine compliance were assumed to be unimpaired under the numeric nutrient criteria. Thus, the same issues that were discussed above for lakes and streams regarding unassessed waters also potentially hold for springs (in terms of the EPA number being a lower bound).
Acreage of Land Draining to Incrementally Impaired Watersheds
After estimating the incrementally impaired WBIDs, the next step was to determine the acreage of various land uses that contribute to the potential impairment. EPA used a relatively coarse “grid,” by considering the 10-digit hydrologic units code (HUC10) watersheds, as defined by the USGS. Because WBIDs may not fall within a single HUC10, to estimate the incremental acreage EPA considered all the HUC10 watersheds containing at least 10 percent of an incrementally impaired lake or stream, which may lead to a significant overestimate of the incremental acreage (EPA, 2010a). On the other hand, EPA excluded all of those HUC10 watersheds that contain at least 10 percent of a lake or stream that are currently impaired or under a TMDL. This could lead to an underestimate of the incremental acreage. The Committee’s evaluation of maps showing the incrementally impaired WBIDs and their associated HUC10s did not lead to an obvious conclusion that the HUC10 units are an over- or underestimate of the acreage.
The HUC10 watersheds are generally too coarse for TMDL analysis, which is typically done with a delineation closer to the USGS HUC12 subwatershed level. Figure 2-2 provides an example of the resolution of the WBIDs for the Santa Fe River in Central Florida. As can be seen, there are dozens of WBIDs within this single basin, of varying sizes. Figure 2-3 presents the HUC10s for this same region. There are only seven large HUC10s within this basin. Figure 2-4 presents the HUC12 delineation for the region. Although there is no direct correspondence between the HUC12s and Florida’s WBIDs, the size of the WBIDs is generally much closer to the HUC12s. Thus, a more precise estimate of the potential incrementally
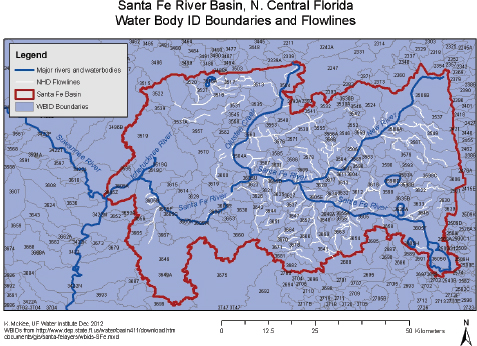
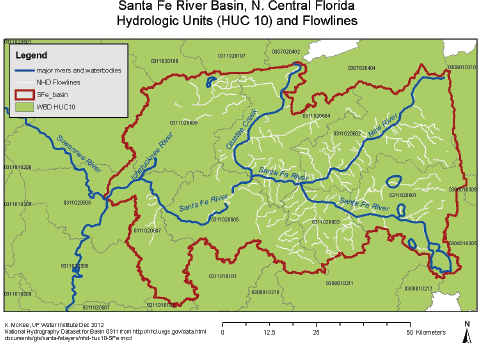
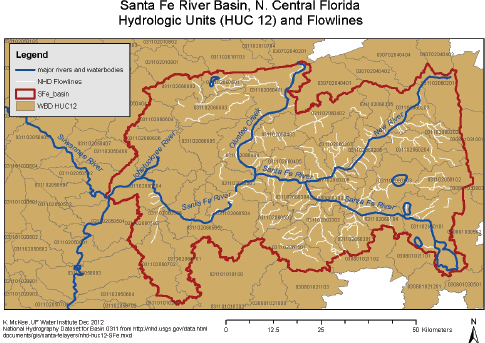
FIGURE 2-4 Comparable HUC 12 delineation for the Santa Fe River in Central Florida.
SOURCE: McKee (2011).
affected acreage due to the new rule could have been performed using the same assumptions but with the HUC12 delineation of the areas contributing to the various WBIDs. Alternatively, EPA could have used the area for each specific WBID for their analysis.
In addition to considering a relatively coarse grid for the analysis, EPA considered that every acre of agricultural and urban land in an HUC10 contributes equally to in-stream loading. While it is likely that the characteristics of Florida’s WBIDs in some regions, such as artificial drainage and highly transmissive soils, may lead to contributions from fields further away from the WBID than in other regions around the United States, the coarseness of the grid makes this assumption much less valid. While a robust analysis would require a full fate-and-transport calculation, an intermediate approach would have considered a distance/travel time weighting factor between the contributing croplands and the WBIDs. Using the more refined HUC12 delineation of subwatersheds would also reduce the error in these estimates of land areas that contribute to water quality degradation.
To estimate the urban areas, agricultural land, and septic systems that may need controls to attain the numeric nutrient criteria for springs, EPA obtained GIS data on land areas where groundwater aquifers supply water to springs (spring recharge areas or springsheds) from FDEP’s Florida
Geological Survey. EPA identified incrementally impaired spring recharge areas as those vulnerable to surface sources of contamination by the Florida Geological Survey Florida Aquifer Vulnerability Assessment (Arthur et al., 2007). The Committee has no concerns with this approach.
Determination of Incrementally Affected NPDES-Permitted Municipal and Industrial Sources
EPA made the conservative assumption that municipal and industrial wastewater point sources would be potentially affected by the NNC rule regardless of the impairment status of the WBID in which they are located. To determine the incremental effect of the NNC rule on these sources, EPA assumed that wastewater treatment plants (WWTPs) would be considered to be in compliance with the NNC rule if they could treat their discharges with advanced biological nutrient removal (BNR) to reach 3 mg/L for TN and 0.1 mg/L for TP as annual averages. This level of performance was selected based on a judgment regarding demonstrated technology that has been used at sufficient scale and can be reasonably applied in Florida (see discussion below under the subsection entitled “Effectiveness of Control Methods”). These targets for water quality-based effluent limits (WQBELs) for all WWTP permittees assume some dilution and assimilation within the receiving waters to meet the numeric nutrient criteria at the point of compliance. Whether more stringent effluent limits will be required, approaching or in fact equaling the appropriate numeric nutrient criterion, is a matter of dispute and is discussed further in this chapter and in Chapter 3.
From the Committee’s reading of EPA (2010a), it appears that only municipal and industrial point sources that discharge to freshwater lakes and streams were considered in the analysis. Municipal and industrial point sources that discharge to groundwater via effluent spray fields or rapid infiltration basins were not considered, although they have the potential to lead to nitrate impairment in springs. For example, both Ichetucknee and Wakulla springs are suspected to be impacted by municipal wastewater effluent spray fields. Lake City’s spray field disposes 3 million gallons per day (MGD) of wastewater effluent in the Ichetucknee springshed. The City of Tallahassee’s municipal effluent sprayfield disposes of about 20 MGD in the Wakulla springshed. A more conservative analysis would have identified all municipal and industrial facilities with effluent sprayfields and rapid infiltration basins in incrementally impaired springsheds and assumed that some level of additional treatment might be required before disposal of their wastewater. Discussions with EPA indicated that they were aware of this possibility, but that available data did not allow them to unambiguously identify all relevant municipal dischargers that would affect springs (although the data suggested that the number of such dischargers and their
capacity was relatively small). Thus, EPA judged that exclusion of these dischargers from the cost analysis would not materially affect the total cost estimate. The quantitative assessment on which this assumption was based was not presented by EPA, making it difficult to determine whether the assumption was reasonable, especially from a water quality (as opposed to a cost) standpoint.
A potential additional industrial cost could exist due to the large number of general permits utilized by Florida. A footnote on Page 2-15 of the EPA analysis states there are 34,508 dischargers covered under general permits in Florida and that EPA did not include those dischargers in the analysis. General permits are used to cover a common class of dischargers in a streamlined fashion with minimal cost to the permitting authority and the permittee. There is no further information regarding the classes of dischargers covered by the general permits. However, if any of those general permits relate to industrial facilities discharging nutrients, those facilities could potentially lose general permit coverage and be required to obtain individual permits. Compliance costs for holders of individual permits are generally higher than for general permits. A related uncertainty of this type arises with stormwater sources. At present, most of these sources are deemed to be outside the NPDES-regulated process where WQBELs apply. However, if this changes due to regulation or third party lawsuits and if the discharge limits that would result are more stringent under the NNC rule than under the narrative rule, then these sources could realize greater costs.
What is assumed about all these regulatory uncertainties has a direct influence on the cost estimates reported by EPA and others. Chapter 3 provides a discussion of the regulatory setting, and how to best incorporate regulatory and other uncertainties in a cost analysis. The sections that follow here focus on uncertainty related to unit costs and effectiveness of controls by sector.
This review of the EPA economic analysis considered the following issues for each sector. First, the overall methods to determine costs were analyzed, focusing on the number of affected units and the per unit cost of treatment. For example, for the agricultural sector the review considers whether EPA estimated the affected agricultural acreage correctly and the costs of BMPs that would be needed for that acreage. Each section discusses the effectiveness of the proposed control methods, where appropriate. In doing so, the Committee used the numeric nutrient criteria as a threshold for evaluating the efficacy of BMPs, in the absence of any other logical benchmark. Each section describes the relevant sources of uncertainty in the cost estimate, including variability in per unit costs, uncertainty in BMP
performance, and regulatory behaviors. It should be noted that some of the uncertainties discussed are not unique to using numeric nutrient criteria (as opposed to narrative criteria); nonetheless, they are discussed here because of their potential effect on the cost estimate for a given sector. Finally, the results of other competing cost analyses are given and compared to those of EPA.
Municipal Wastewater Discharges
EPA estimated that $22.3 to $38.1 million/year would be the cost to municipal wastewater sources to comply with the proposed NNC rule in Florida. The EPA analysis assumed that municipal wastewater dischargers would be in compliance with the NNC rule if they could meet the definition of advanced BNR as presented above (discharge limits of 3 mg/L for TN and 0.1 mg/L for TP as annual averages). It is important to note the use of an annual averaging period for TN and TP in EPA’s cost estimate. Annual averaging means that seasonal variability in wastewater discharge pollutant concentrations is averaged out over the course of a year. There has been some effort at EPA to enforce average monthly and weekly permit limits based on interpretation of 40 CFR 122.45(d) requiring average monthly and weekly permit limits if “practicable.” Monthly and weekly limits are not as applicable for pollutants such as TN and TP, which do not exhibit toxic effects, as they are for other pollutants typically regulated by NPDES permits and which exert their impacts over shorter timeframes than do TN and TP. However, if monthly and/or weekly permits were required for TN and TP, the cost of compliance would increase due to the need to build increased reliability into treatment plant design.
Methods to Determine Costs
EPA considered that every municipal WWTP had “reasonable potential” under the NNC rule, meaning that they might discharge pollutants at levels that would prevent associated receiving waters from achieving the numeric nutrient criteria. Thus, their analysis focused on determining whether existing plants had already installed removal technologies that could meet the targets of 3 mg/L for TN and 0.1 mg/L for TP as annual averages. When both TN and TP removal technologies were already installed at a particular WWTP, it was assumed that additional modifications were unnecessary and that no cost was associated with these facilities to comply with NNC rule. Likewise, when either TN or TP removal technology was installed, only the cost to install and operate technology to remove the alternate nutrient was attributed to these facilities. This approach is reasonable, as costs for
nutrient removal capabilities already in place can be attributed to existing nutrient control requirements, not the proposed NNC rule.
Effectiveness of Control Measures
Advanced BNR, as defined by EPA, is an effective and proven approach to achieve the specified level of performance, 3 mg/L TN and 0.1 mg/L TP on an annual average basis. Effluent TP can be further lowered with similar chemical treatment technology, although at increasing cost. TN removal is limited for existing biological treatment technology by the presence of soluble, nonbiodegradable organic nitrogen which remains in biological treatment effluents and is not removable using treatment approaches conventionally applied at municipal WWTPs. Soluble nonbiodegradable organic nitrogen represents one component of the effluent TN and is present at a concentration which is generally in the 1 to 2 mg/L as N range, which is sufficiently high to prevent reliable compliance with TN effluent limits below about 3 mg/L.
Removal technologies such as RO and activated carbon either with or without advanced oxidation are available but are in various stages of development and have not been generally applied for this purpose in municipal applications. Microfiltration (MF) followed by RO has been proposed by some and has been implemented for potable quality reuse applications in Orange County, California, and other locations overseas.
In situations where treatment beyond 3 mg/L TN and 0.1 mg/L TP might be required, it is also possible that reuse of various types might be an attractive alternative. In fact, reuse is widely practiced in Florida to both augment water supplies and to limit direct surface water discharges (although reuse for irrigation can infiltrate surficial groundwater and indirectly discharge to lakes, streams, and springs).
These possibilities suggest that simply assuming that MF/RO will have to be applied to all municipal dischargers affected by the NNC rule—which is the position taken by the Florida Water Environment Association Utility Council (Carollo Engineers, 2010)—is also not a reasonable assumption. In circumstances such as these, costs to municipal dischargers are often limited to established affordability criteria, which would represent one approach to estimate upper bound costs for this class of dischargers.
The footnotes to EPA’s Exhibit 4-3 indicate that WWTPs with the MLE, A2/O, or modified UCT processes,5 and oxidation ditches were considered to be able to comply with the 3 mg/L TN limit; consequently, no costs for TN removal were attributed to them. However, evidence exists that MLE,
![]()
5 MLE = Modified Ludzack-Ettinger; A2/O = anaerobic-anoxic oxidation; and UCT = University of Cape Town.
A2/O, and modified UCT processes are not able to reliably comply with a 3 mg/L TN effluent limit (Grady et al., 2011; WEF, 2009), such that further upgrade would likely be required for these facilities.
Range of Unit Costs
Unit costs were applied to those NPDES-permitted facilities that were identified by EPA as needing upgrades to comply with discharge requirements of 3 mg/L TN and 0.1 mg/L TP (see EPA, 2010a, Appendix C). EPA estimated the costs for a variety of nutrient control upgrades to existing WWTPs using a computerized cost estimating program called CAPDETWorks. Capital, operation and maintenance (O&M), and annual costs were determined and expressed on a unit cost basis ($/gpd of capacity). The detailed basis for their unit cost development is not presented in the economic analysis, but the results can be evaluated as outlined below.
A variety of upgrade approaches was assumed for the three types of required upgrades, including TN only, TP only, and TN and TP, as summarized in EPA’s Exhibit 4-4. A reasonable range of technologies appears to have been assumed for the TP-only and TN-and-TP upgrade scenarios. The range of approaches was used to establish a range of upgrade costs for each category of reduction needed and are summarized in EPA’s Exhibit 4-5.
As noted by EPA, numerous advanced wastewater treatment facilities exist in the state of Florida. Logically the costs associated with these Florida-specific upgrades would provide the primary source of data to establish unit costs. Conversations with EPA indicated that efforts were made to compare their CAPDETWorks results with Florida-specific data, and this limited effort indicated that the CAPDETWorks data were consistent with Florida experience. As noted by EPA in these discussions, the costs specifically associated with nutrient upgrades must be segregated from other project costs when analyzing actual cost data. Alternate data were supplied by the Florida Water Environment Association Utility Council suggesting significantly higher upgrade unit costs. This Committee is not in a position to determine which set of unit costs are correct, although as noted by EPA such data must segregate nutrient upgrade-related costs from other costs included in the subject projects. It does suggest, however, that direct examination of actual state of Florida upgrade unit costs could resolve this matter. Collaboration between EPA and the Florida Water Environment Association Utility Council seems a prudent step forward.
Sources of Uncertainty
Two sources of uncertainty are potentially significant for this sector. The first relates to the unit treatment costs. Significant and relevant experi-
ence exists in the State of Florida concerning the costs required to upgrade municipal WWTPs to comply with treatment requirements of 3 mg/L TN and 0.1 mg/L TP. This information could have been compared to the unit costs estimated using CAPDETWorks to determine whether the estimates developed using CAPDETWorks were of the proper order of magnitude. Data provided by the Florida Water Environment Association Utility Council suggests that Florida-specific unit costs may be significantly greater than those based on CAPDETWorks and used by EPA in their analysis.
The second significant source of uncertainty is regulatory, specifically the proportion of WWTPs that would be required to treat to levels more stringent than 3 mg/L TN and 0.1 mg/L TP, perhaps approaching numeric nutrient criteria values in their discharge. EPA assumed that no WWTP would be required to treat to levels more stringent than 3 mg/L TN and 0.1 mg/L TP. While this assumption makes the analysis simpler to complete, it has been challenged by others, and the basis for those critiques is explained as follows (and explored further in Chapter 3).
Past experiences suggest that the “default” expectation for municipal WWTPs that are discharging to waters not meeting established ambient water quality criteria is for them to treat their effluent to levels equal to the established ambient water quality criteria. There is no reason to suppose this expectation to be different if numeric nutrient criteria are established. Nonetheless, EPA assumed that SSACs, variances, or use designation modification would be pursued and obtained. (Variances are a regulatory tool to temporarily waive the numeric nutrient criteria and they are typically used to relax point source permit limits while the point source accrues capital to make treatment upgrades.) However, even if approved, these decisions are subject to third-party lawsuits. Thus, it is reasonable to think that, in at least some instances, treatment to levels beyond the specified performance standards of 3 mg/L TN and 0.1 mg/L TP would be required, resulting in greater cost.
As noted above, treatment technologies to achieve end-of-pipe compliance with the numeric nutrient criteria are not well developed and demonstrated, suggesting that significant advances in technology would be required before this becomes an option for municipal dischargers to reliably pursue. Also, past experience suggests that pursuing SSAC, variances, and use designation modifications can be a long and expensive process with little certainty of a successful outcome. Developing alternate effluent management options such as reuse has been successfully pursued in Florida, but this requires time as they must achieve public acceptance and must be integrated into an overall water supply and management strategy for the community. Furthermore, one must consider the possible indirect movement of enriched reuse water through the subsurface to receiving waterbodies.
Other Analyses
An alternate analysis of the costs associated with municipal wastewater discharges complying with the NNC rule was developed for the Florida Water Environment Association Utility Council (FWEAUC) by Carollo Engineers (2010). Carollo’s estimate was significantly higher than EPA’s for several reasons:
• 85 municipal WWTPs were included in the EPA analysis, while 110 were included in the Carollo analysis.
• The unit costs for upgrading WWTPs used by Carollo were significantly higher than those used by EPA.
• Carollo assumed that municipal WWTPs would need to meet the numeric nutrient criteria at the “end-of-pipe” and thus assumed that microfiltration and reverse osmosis (MF/RO) along with brine processing would be needed for all municipal WWTPs. In contrast, EPA assumed that municipal WWTPs would not need to meet numeric nutrient criteria at the “end of pipe,” but rather the targets of 3 mg/L for TN and 0.1 mg/L for TP as annual averages. Clearly a more thorough analysis than either of these would indicate that some, but not all, plants included in this evaluation would be required to upgrade to effluent limits more stringent than 3 mg/L for TN and 0.1 mg/L for TP. Efforts could, and should, have been made by both parties to estimate the proportion of plants for which this would be the case.
• Because of their assumption about the needed technology, and in some cases the unit costs, the overall costs estimated by Carollo were significantly higher than those of EPA.
Industrial Facilities
EPA estimated that $25.4 million/year would be the cost to industrial wastewater sources to comply with the proposed NNC rule in Florida. The agency identified 108 industrial dischargers that would have the potential to be affected by the NNC rule by assuming that any dischargers with a Standard Industrial Classification (SIC) that matched those of another plant with either existing numeric effluents limits for nutrients or a monitoring requirement for nutrients would have similar potential. The potentially affected industrial dischargers represented six major industrial categories and 29 different SIC codes. The 108 was winnowed down by eliminating 38 plants that have a Waste Load Allocation (WLA) under the existing TMDL program. As with municipal WWTPs, EPA assumed that site-specific alternative criteria would be granted to those dischargers. EPA also found that 14 of the 108 plants discharge to waters already deemed impaired, and thus did not include these plants in their analysis, resulting in 56 remaining plants.
Methods to Determine Costs
For the 56 industrial plants, EPA estimated implementation costs by reviewing design and performance data from 12 random plants gleaned from the permit compliance system. For each industrial category, EPA calculated the average treatment unit cost per MGD of flow treated by dividing the total cost for the randomly selected facility by the total flow of that facility. EPA then multiplied the average unit cost by the total flow reported in the permit compliance system for each of the potentially affected facilities in the applicable category. For example, ten mining industrial discharges were evaluated. Two of the ten were sampled to develop a cost per MGD of treated discharge, and these numbers were then multiplied by the total flow of all ten plants to determine the total cost to this industrial category (about $16 million). The average unit cost, in $/MGD/year, depended on (1) the nutrient concentration in the discharge of the randomly selected plant and how those concentrations compared to the targets of 3 mg/L N and 0.1 mg/L P, (2) the combined flows within the sampled industrial category, and (3) the annualized cost of the technology chosen to treat those discharges. For example, the Packaging Corporation of America was chosen for the pulp and paper category. That plant was determined to only need P reductions to meet the targets, and chemical addition and filtration were the chosen technologies.
Limiting the total industry sample size to 12 restricted the primary data (principally flow) from which EPA established unit costs and overall industrial point source cost estimates. Given the diversity of industries and the variability of their operations and discharges, use of the broader resource database that is available under the permit compliance system would have been useful for establishing more accurate cost estimates for the individual industries. It is not clear why EPA did not conduct the analysis for all 56 plants. Note that in many cases Basin Management Action Plans (BMAP) for existing TMDLs may also provide a broad resource for nutrient control cost estimates for both point and nonpoint sources.
Additional effort should be put into estimating the costs and impacts of the significant dischargers. There are three phosphate rock major dischargers (SIC 1475) and two phosphate fertilizer majors and one minor (SIC 2874), as per Exhibit 5-1 of EPA’s economic analysis report. However, a single facility (Mosaic Fertilizer) was used for the entire cost estimate for this industrial category with an average flow of 5.24 MGD. Ultimately Mosaic Fertilizer, with a flow contribution of less than 5 percent of the total mining industrial flow, exerted a disproportionate bearing on the final industrial cost figure.
In the industrial analysis (Appendix D of EPA, 2010a), it was suggested that end-of-pipe effluent limits should be based on the assimilative capacity of the receiving stream (see examples for Pilgrim’s Pride, the Packaging
Corporation of America, and St. Mark’s Powder). It is unclear if or how assimilative capacity was accounted for in the unit cost development; it should only be considered on a site-specific basis and not toward broad industrial sector cost estimation.
Effectiveness of Control Measures
The issues discussed previously for the municipal wastewater discharges also apply to industrial wastewater discharges.
Range of Unit Costs
EPA used the same nutrient control unit cost data established for municipal wastewater treatment to estimate industrial treatment costs (Exhibit 4-4). The principal problem with applying the Exhibit 4-4 data to industrial wastewater treatment costs is the 10 MGD flow basis used to establish the unit costs. Industrial wastewater flow rates tend to be much less than 10 MGD, generally in the 1 MGD or smaller range, such that unit costs tend to be higher and highly variable. For example, in Utah’s 2009 nutrient cost study (CH2M Hill, 2010), unit costs to upgrade 1 MGD plants for P removal only to an effluent concentration of 0.1 mg/L had an average unit cost of about $3.50 per gallon per day design capacity with a range of about $0.50 to $4 per gallon per day design capacity. Above 10 MGD, the average unit cost was about $2 per gallon per day design capacity and the range narrowed to about $1.50 to $2.50 per gallon per day design capacity. EPA’s unit costs for treatment were generally about $1 per gallon per day design capacity, significantly lower than the unit cost in the Utah study.
EPA’s cost estimate to add chemical addition and filters for the 55 MGD Packaging Corporation of America was $17.7 million, which is low compared to the Utah nutrient cost study (CH2M Hill, 2010), where costs to implement similar improvements at five municipal facilities of comparable size ranged from $55 to $110 million.
Sources of Uncertainty6
Industrial wastewater treatment cost estimates did not take into account nutrient loadings, which can be considerably more variable and dynamic in industrial treatment facilities than in municipal wastewater treatment facilities. Differences in nutrient loading, even within an industrial category, are extremely difficult to characterize at this level of analysis.
![]()
6 The same NPDES regulatory uncertainty that was described for the municipal sources applies here as well.
One simple way of establishing a safety factor to account for industrial discharger load variations would be to estimate the requirements for flow attenuation via equalization and include this in the cost model. EPA recognized that randomly selected discharger Mosaic Fertilizer (Appendix D) had highly variable flows, but it specifically excluded equalization costs from the cost estimate for this industry.
As suggested above, there is considerable uncertainty in sampling only a subset of the industries that would be affected by the NNC rule and using it to derive the cost estimate. For the Chemical and Allied Products category, Mosaic Fertilizer’s flow contribution toward the total flow of the two samples in that sector was 95 percent [13.9 MGD/14.69 MGD] but no nutrient removal cost was determined to be necessary at that facility; only for St. Marks Powder, Inc. ($206,800/year). Yet the latter’s flow contribution was only 0.79 MGD. Thus the average unit cost for that sector was estimated to be $14,077 [($206,800 + $0)/(0.79 MGD + 13.9 MGD)]. This figure is skewed considerably lower due to using the cost figure from St. Marks Powder but the combined flow from both facilities. Had the average unit cost been determined using solely the cost and flow elements from St. Marks Powder, the average unit cost for that sector would have increased nearly twenty-fold to $261,772 ($206,800/0.79 MGD) and the resulting total annual sector cost would have been approximately $20,760,000, not $1,116,800. On the other hand, some 34 percent of industrial dischargers reported no flows in the permit compliance system. Averaging within the category and discharge type was conducted, which tended to bias the costs high, particularly for the major discharger type. EPA should more carefully consider how the total annual sector costs may be skewed either higher or lower due to cost or flow elements of a small number of individual sector facilities.
In its random selection of dischargers, the Anguila Fish Farm was not included by EPA. The flows from this fish farm constitute one-third of the food sector’s flows. It is not unreasonable to assume that a fish farm may need to remove significant amounts of phosphorus and nitrogen to achieve the numeric nutrient criteria. Thus, not including this single facility in the sector sample may have significantly underestimated the total annual cost for the food sector.
Other Analyses
Several alternate cost analyses, of varying detail, were performed to estimate industry costs to meet EPA’s numeric nutrient criteria including Environ International Corp. (EIC), on behalf of the Florida Phosphate Industry; Cardno ENTRIX, on behalf of the Florida Water Quality Coalition; and FDEP. These cost estimates were significantly higher than EPA’s estimate of $25.4 million/year because EPA underestimated both the capital
and O&M costs to meet the numeric nutrient criteria, while the other stakeholders overestimated the costs by making very conservative assumptions about the technology that would need to be employed and the number of facilities that would need to be upgraded.
EIC’s analysis was limited to the phosphate industry. Its analysis considered treatment endpoints of 1.479 mg/l for TN and 0.359 mg/l for TP and included the cost of treatment for both process water and stormwater. On the other hand, EPA considered treatment endpoints of 3.0 mg/l for TN and 0.1 mg/l for TP and evaluated only industries which have either numeric effluent limits and/or monitoring requirements for TN and TP. EIC’s cost estimate was $1.6 billion in capital costs and $59 million/year for O&M which, when combined, equates to an annualized cost of $163.1 million/ year (this figure was not presented in its report but rather was calculated, for comparison purposes, assuming a 30-year payment period and 5% present value discount rate).
In the Cardno ENTRIX cost estimate, mean annual costs for industrial discharges were calculated to be $1.97 billion to meet EPA’s numeric nutrient criteria at the “end-of-pipe,” or just $270 million/year for those plants in newly impaired areas to reach the less stringent goal of “limits of technology” treatment. Cardno ENTRIX applied a 25 percent contingency factor to its estimated cost of compliance, which inflated the results.
FDEP’s cost analysis assumed reverse osmosis, a costly treatment alternative, rather than biological nutrient removal and chemical precipitation. A second difference is that EPA assumed a 20-year payment period and FDEP assumed a 30-year payment period. Thus, FDEP estimated the cost of implementing EPA’s numeric nutrient criteria for industrial plants to be $2.1 billion/year.
Urban Stormwater
In the EPA analysis of costs, the urban stormwater sector was the most expensive, accounting for approximately 50 percent of the total costs (EPA, 2010a, p. 11-1). To calculate this cost, EPA determined the land areas thought to be incrementally impaired under the NNC rule and then, based on GIS data, estimated the acreage of urban land that would contribute to a potential impairment.
Methods to Determine Costs
Some of the challenges to estimating urban stormwater costs for compliance with the NNC rule are related to the amount of urban land that drains to incrementally impaired waters, the type of urban development, and the historical timeline of that development. First, EPA considered that
any area urbanized after 1982 would comply 100 percent with FDEP’s existing Stormwater Rule (Florida Administrative Code Chapter 62-40.432). This Rule states that stormwater management systems must “achieve at least 80 percent reduction of the annual average load of pollutants that would cause or contribute to violations of state water quality standards”; the requirement for “Outstanding Florida Waters” is 95 percent. Any pollutant that can cause impairment to state waters, including N and P, falls under this standard (EPA, 2010a). Thus, EPA excluded from its analysis all land developed after 1982, which comprised 28 percent of the urban areas in Florida. In doing so, they assumed that stormwater control measures (SCMs) designed according to the required state criteria are in compliance with the 80 percent reduction standard.
Second, EPA assumed that all low-density residential areas would fully comply with the existing Urban Turf Fertilizer Rule, and thus should be excluded from the analysis. Because low density residential areas represent 58 percent of Phase II MS4 urban areas and 65 percent of non-MS4 urban land, another significant fraction of the acreage was taken out of consideration. Scientifically, it is not possible to know the impact of this Rule on meeting the numeric nutrient criteria. Nutrient prevention programs are notoriously difficult to quantify, especially when stormwater nutrient concentrations rather than load reductions are sought.
The Phase I MS4 permitting program requires municipalities of greater than 100,000 to reduce their stormwater discharges to the maximum extent practicable by a variety of measures (NRC, 2009). Given the qualitative nature of the Phase I MS4 permitting program, EPA was unsure about whether the acreage covered under that program should be considered to be already complying with the NNC rule. To address this uncertainty, EPA used a range in affected land area from the assumption of no Phase I MS4 areas to the assumption all Phase I MS4s, and this range was propagated through the entire cost analysis.
While it is true that if these existing state rules were fully implemented the nutrient contributions from these areas would be much lower, possibly leading to attainment of the numeric nutrient criteria in the corresponding waters, some amount of noncompliance is certain. The urban areas that may require additional expenditures to meet the numeric nutrient criteria may thus be significantly greater than the 23 to 41 percent estimated by EPA. On the other hand, it is also unlikely that 100 percent of urban areas would be affected due to the new NNC rule, in part because stormwater control measures (SCMs) have already been implemented in many urban areas (especially Phase 1 MS4s), and in part because not all urban areas contribute equally to the loading of nutrients to potential incrementally impaired waters. The use of the more refined HUC12 delineation of sub watersheds would improve the estimates of the contributing areas.
Although EPA acknowledges that urban runoff can be a significant source of nutrient pollution to Florida springs, they assume that “efficient land application of nitrogen” will be an effective means of addressing nutrients from urban runoff and cite the Urban Turf Fertilizer Rule, city- or countywide fertilizer ordinances, and public outreach and education campaigns as good examples of such nutrient source control efforts. Thus, EPA assumed that implementation of existing requirements would be sufficient to reduce nitrate-nitrite loads to springs from urban stormwater enough to achieve compliance with the 0.35 mg/L NO3-N criteria. Unfortunately, there is little empirical evidence that the nutrient source control efforts cited above will reduce nitrate from urban runoff/infiltration in springsheds to levels which (when combined with nonpoint source nitrate from agricultural land uses in the springshed) will achieve less than 0.35 mg/L in springs.
Effectiveness of Control Measures
The efficiencies of SCMs vary widely depending on their type, design, placement, and age. Correspondingly, the costs of implementing SCMs to manage urban areas in Florida will vary widely on a per-acre basis. Whether the SCMs proposed in EPA (2010a) will be sufficient to comply with the NNC rule is evaluated by considering the quality of urban stormwater and what is known about the effectiveness of SCMs in Florida.
Florida Urban Water Quality. A detailed report on urban stormwater in Florida was completed in 2007 for the FDEP (ERD, 2007). This document provides a wealth of information relevant to Florida stormwater quality and treatment. Detailed evaluation of water quality for N and P was presented for six types of urban land use (along with other land uses). Urban stormwater pollutant concentrations typically vary by more than an order of magnitude from storm to storm and tend to be log-distributed (NRC, 2009). Average concentrations of N and P runoff discharge in Florida from urban land uses are presented in Table 2-1.
All nutrient concentrations listed in Table 2-1 are means, taken from various Florida research studies. The variability in these concentrations, presented as the standard deviation, was calculated from the mean for each individual study evaluated in the report, and is relatively high, on the order of 50 percent of the mean value. Although unlikely, it is possible that all land use sectors would be required to directly meet the numeric nutrient criteria in their discharges (see subsequent section on agriculture). The proposed numeric nutrient criteria range from 0.5 to 1.87 mg/L TN and from 0.01 to 0.49 mg/L TP, depending upon waterbody type and region. As demonstrated in Table 2-1, the urban runoff means for TN ranges from about equal to several times higher than the numeric nutrient criteria. For
TABLE 2-1 Nitrogen and Phosphorus Concentrations (Average ± Standard Deviation) in Runoff from Various Land Uses in Florida
| Urban Land Use Category | Mean Runoff Concentration (mg/L) | |||||
| Total N | 80% N Reduction |
25% N Reduction |
Total P | 80% P Reduction |
65% P Reduction |
|
| Single-Family | 2.07 ± 1.02 | 0.41 | 1.55 | 0.327 ± 0.126 | 0.065 | 0.114 |
| Multi-Family | 2.32 ± 1.24 | 0.46 | 1.74 | 0.520 ± 0.017 | 0.104 | 0.182 |
| Low Intensity Commercial | 1.13 ± 0.045 | 0.24 | 0.89 | 0.188 ± 0.064 | 0.036 | 0.063 |
| High Intensity Commercial | 2.40 ± 1.03 | 0.48 | 1.80 | 0.345 ± 0.329 | 0.069 | 0.121 |
| Light Industrial | 1.20 ± 0.015 | 0.24 | 0.90 | 0.260 ± 0.178 | 0.052 | 0.091 |
| Highway | 1.64 ± 0.85 | 0.33 | 1.23 | 0.220 ± 0.146 | 0.044 | 0.077 |
SOURCE: ERD (2007, pg. 4-12, 4-15, 4-16, 4-17, 4-18, 4-19).
Standard Deviations calculated from data in ERD (2007).
P, the runoff is generally about 3 to 16 times greater than the proposed numeric nutrient criteria.
Stormwater Control Measures. The science and engineering of understanding SCM performances is still in its infancy. Specific performance of SCMs for pollutant removals are notoriously difficult to quantify due to variations in design, configuration, drainage area land use, climate and weather, and surrounding hydrogeology. As a result, from a regulatory perspective, urban stormwater control technologies have long been used and operated in a “narrative” mode with performance inferred based only on compliance to designing technologies based on specific requirements. Most states do this, including Florida. Jurisdictional legislation requires a percent reduction of a specific pollutant (e.g., 80 percent removal), but does not specify required numeric pollutant concentrations. Because of the variability of natural wet weather events, the use of percent removal to describe SCM performance is scientifically weak, and performance summaries based on percent removal exhibit high variability. Use of percent removal, however, is prevalent and the science to move to another metric is not yet mature.
Both national and local databases have been created for quantitative monitoring studies of urban SCMs. In many cases, the data sets remain small. In all cases, the data are highly variable. Different rainfall events will have variable stormwater runoff water quality due to land activities, climate, antecedent dry period, and other parameters that remain poorly understood. Small, short duration storms may be treated effectively and discharge low pollutant concentrations, or even produce no discharge at
all. However, large events will result in short effective treatment times and resulting poor performance.
In Florida, variability in urban runoff quality and SCM performance is expected geographically throughout the state (ERD, 2007). Most of this is due to variability in annual rainfall (Figure 1-4), which averages from about 38 to 66 inches per year. Higher areas of rainfall require more expensive treatment, or treatment will be less effective. More runoff is expected in the panhandle than in other parts of the state because of the higher annual rainfall, requiring greater investment in treatment. Note from EPA Exhibit 3-2 that this region has the most stringent numeric nutrient criteria.
Feasibility of Achieving the Numeric Criteria. Table 2-1 indicates that a reduction of 80 percent in the N concentration, which is required by the Florida stormwater regulations, would on average reduce the N concentration below the proposed numeric nutrient criteria. An 80 percent reduction of the average P concentration would not comply with the numeric nutrient criteria for all regions. (While this simple analysis has disputed scientific support, it is currently the best tool available for an analysis such as this.) Because of the log-distribution of runoff concentrations and treated SCM discharges, meeting specific concentration criteria for urban stormwater runoff would need to be evaluated on the basis on probability and exceedence distributions.
A large amount of evidence is available to suggest that 80 percent removal of pollutants, including P, is difficult to meet with current SCM technology. EPA (2010a) acknowledges the wide range of pollutant removal efficiencies expected for SCMs (5 to 85 percent, p. 7-2). The EPA report assumes that 50 percent N and P reduction would result in nutrient reduction necessary to meet proposed numeric nutrient criteria, but Table 2-1 suggests that this is not the case. The recent FDEP evaluation of commonly used Florida SCMs (ERD, 2007) suggests that wet ponds can accomplish a 65 percent annual mass removal for total P and 25 percent removal of TN. A recent NRC report on urban stormwater indicates 45 percent removal for TP and 20 percent removal for TN for wet ponds and wetlands (NRC, 2009). For dry retention, Florida estimates about 53-63 percent P removal; NRC reports 10-20 percent P removal. The differences in dry retention pond performances are primarily due to expected greater infiltration in Florida soils. Table 2-1 shows that these treatment efficiencies are mostly inadequate for reaching the proposed numeric nutrient criteria.
Higher treatment efficiencies needed to reach the proposed numeric nutrient criteria could likely be obtained through the use of more advanced SCMs, such as bioretention (up to 80 percent removal of TN and 85 percent removal of TP in high-infiltration soils) or other vegetated infiltration
practices (NRC, 2009), which may be more costly than the per-acre costs populating the existing FDEP database.
Range of Unit Costs
The range of costs for stormwater SCMs varies greatly because of the differing value of urban lands, the difficulties of construction in (sub)urban areas, and different technologies employed as the SCM. Currently, SCMs used in Florida are predominantly detention and retention ponds (personal communication, Eric Livingston, FDEP; ERD, 2007).
A small but valuable database on costs for stormwater control is held by FDEP and was used in the EPA analysis. Costs for 40 projects were evaluated; more than half were wet detention ponds, followed by dry ponds. The mean is $12,570 per acre, with a standard deviation of $14,509 per acre. The median is $6,836 per acre, which is the fixed value used in the EPA analysis. (The 10 and 90 percentiles are $863 and $34,350 per acre, demonstrating the large variability in unit costs.)
Traditional SCMs like detention and retention ponds may not be able to meet the numeric nutrient criteria themselves, such that urban retrofit of other technologies may be necessary. New and evolving technologies may be able to provide better performance for N and P removal. Such filtration and infiltration SCMs can have significantly greater per-area costs than traditional pond and storage systems (Weiss et al., 2007). A recent article has quoted costs between $125,000 and $200,000 per impervious acre for urban retrofit in the Washington, DC suburbs in attempts to meet more stringent Chesapeake Bay water quality criteria (Medina and Curtis, 2011). In retrofit situations, costs for land acquisition must also be included and could be significant in urban areas.
Sources of Uncertainty
The focus of uncertainty in the EPA report was entirely based on the area of land impacted. While this uncertainty is real, it may not be the only or largest uncertainty in the stormwater analysis, especially when one considers the inherent variability of rainfall and pollutant accumulations on the landscape, in conjunction with variable SCM treatment performance. There are several sources of uncertainty other than the one EPA addressed.
With respect to the land area considered, EPA appropriately considered the urban land area developed prior to the 1982 stormwater regulations separately from land developed later. An uncertainty, however, is the extent to which land developed after 1982 is actually complying with the required 80 percent reduction of N and P; as discussed already, recent
studies indicate that much poorer performance has been measured (along with a significant degree of variability). In addition, new stormwater regulations are anticipated in the next few years that are expected to provide greater environmental protection. Gathering information on regulatory compliance and SCM longevity and maintenance [all of which can be poor (NRC, 2009)] would provide another layer of detail to the cost analysis.
As noted earlier, the unit area costs for urban SCMs have a very large range. The EPA analysis selected only the median value from the FDEP database. Unit costs will vary widely depending on the technology selected, on the cost of the land being used for the SCM, and other factors. This cost category is expected to be the greatest uncertainty in the stormwater analysis. Interestingly, the EPA analysis used unit cost variability as a prime uncertainty metric for other sectors, such as agriculture, but did not carry this methodology to the urban sector. In analyzing the other sectors, the land area or unit was always fixed by EPA and the variability was captured in the unit cost.
Finally, refining the cost analysis geographically (by considering rainfall distributions), based on the type of urban development and by regional numeric nutrient criteria, would reduce uncertainty.
Other Analyses
Two stakeholder reports with cost estimates for urban stormwater were made available to the Committee, one by the Florida Department of Environmental Protection and the other by Cardno ENTRIX (which included a 2011 Addendum). A simple summary of the differences among the reports is provided in Table 2-2. The large difference between costs results from
TABLE 2-2 Comparison of Urban Stormwater Costs for the EPA Analysis and Two Others
| Cost Analysis | Approximate Affected Acres (thousands) | Approximate Cost per Affected Acre | Approximate Total Capital Costs (M) | Estimated O&M | Approximate Annual Cost (M) | |
| EPA | 61.3-109.4 | $6,800 | $419-$748 | 5% | $61-$108 | |
| Cardno | ||||||
| ENTRIX BMP/LOT scenarioa | 180 | $5,120 | $922 | 5% | $61 | |
| Cardno | ||||||
| ENTRIX EOP scenarioa | 1,878 | $5,120 | $9,620 | 5% | $630 | |
| FDEP | 2,344 | $7,295 | $17,100 | 5% | $1,967 | |
aBMP/LOT scenario entails Best Management Practices for diffuse sources and the Limits of Technology for point sources. EOP scenario assumes that both point and diffuse sources would be required to meet the numeric nutrient criteria at the end-of-pipe or edge-of-field.
the land area assumed to require stormwater management. The land areas used by FDEP and the Cardno ENTRIX EOP scenario incorrectly include all urban area developed before 1982. These two analyses do not limit their focus to incrementally affected areas. The Cardno ENTRIX BMP/ LOT scenario and EPA appropriately used estimates of the incrementally affected urban area only.
Agriculture
Agricultural nonpoint sources known to cause nutrient pollution to nearby waterways (as identified in Florida TMDL studies) include animal livestock (dairy, cow/calf pastures, poultry), citrus, vegetable, and sod farms. For years, BMPs have been developed and implemented for agricultural activities to reduce nutrient discharges to nearby waterbodies. A BMP is defined as a practice or combination of practices that is technologically and economically effective in reducing pollutant loads generated by nonpoint sources to a level that meets water quality goals (Mulla et al., 2008).7 Typically, a BMP reduces pollutant loads while maintaining agricultural productivity and being economically feasible to adopt. Agricultural BMPs have been implemented on over 3 million acres of agricultural land in Florida (FDACS Office of Water Policy, 2011a).
Methods to Determine Costs
In addressing agriculture, EPA (2010a) acknowledges that Florida’s implementation of the NNC rule may result in additional BMP requirements to control agricultural nonpoint nutrient sources. A primary assumption made by EPA is that the BMPs for agricultural nutrients detailed in the Florida Department of Agriculture and Consumer Services’ (FDACS) BMP manuals will reduce agriculture’s contribution to the problem sufficiently to meet the NNC rule when combined with other source control strategies.
EPA estimated the incremental cost of new agricultural BMPs only for those agricultural lands in “incrementally impaired watersheds”—some 805,793 acres (as estimated by EPA) of the 13+ million acres in agriculture throughout the state (EPA, 2010a, p. 8-1). EPA also estimated that there is an additional 1.1 million acres of crop or specialty agriculture that would be required to adopt nutrient management BMPs to attain EPA’s numeric
![]()
7 Florida defines BMPs as cost-effective and practicable management actions for improving water quality and water conservation, developed through research, field testing, and expert review. They can be structural (e.g., fencing, stormwater ponds) or nonstructural (e.g., managing fertilization and irrigation rates), and may be developed for both urban and agricultural use. Agricultural BMPs focus on managing inputs (fertilizer, water, pesticides, herbicides) to provide for economic, environmental and agronomic efficiency in production agriculture. SOURCE: FDACS (2011b).
nutrient criteria for springs. In terms of the per acre costs, EPA recognized three levels of activities that agricultural producers might undertake to make nutrient reductions: the “owner” program which would likely be adopted without compensation, the “typical” program which would include government or NGO incentives or cost sharing, and the “alternative” program which would be more aggressive and costly (and also involve cost sharing). In their analysis EPA assumed that implementing “owner” and “typical” BMPs on all agricultural acres in the incrementally impaired watersheds and springsheds would be sufficient. The BMP cost estimates of “owner” and “typical” BMPs were taken from SWET (2008a).
Effectiveness of Control Measures
BMP effectiveness can be evaluated through a variety of techniques, including water quality trend monitoring and analysis, plot or farm-scale evaluations, paired watershed studies, or watershed modeling (Mulla et al., 2008). Each of these approaches has strengths and weaknesses. Many farm-scale BMP field studies suffer from (1) a lack of replication; (2) spatial heterogeneity in crop management, crop productivity, soils and aquifer properties; (3) year-to-year climate variability; and (4) budget constraints that limit the spatial extent and temporal duration of sampling and thus confound rigorous statistical analysis. Nevertheless these studies can provide representative examples of surface and groundwater nutrient concentrations measured on farms.
Table 2-3 summarizes some representative water quality measurements from farm-scale BMP studies in Florida. In general these measurements represent on-farm measured or modeled water quality after BMP implementation. In almost all cases the studies indicate that on-farm surface and groundwater samples significantly exceed the EPA numeric nutrient criteria. (As a point of reference in reviewing Table 2-3, the numeric nutrient criteria range from 0.5-1.27 mg/l TN and 0.011-0.050 mg/l TP for lakes, 0.67-1.87 mg/l TN and 0.06-0.49 mg/l TP for flowing waters, and 0.35 mg/l NO3+NO2-N for springs.) These data, along with experience in ongoing efforts to reduce nutrient loads to the Everglades and Lake Okeechobee (see Box 2-1), Lake Apopka (Bachmann et al., 1999), and the Lower St. Johns River Basin (FDEP, 2008a), do not support the EPA’s assumption that typical “owner” implemented on-farm BMPs will achieve the proposed numeric nutrient criteria. Rather, Table 2-3 suggests that treatment measures beyond typical on-farm BMPs will be required to achieve the proposed numeric nutrient criteria. This is further supported by a recent assessment of BMP costs and impacts on water quality in the Caloosahatchee River and St. Lucie River watersheds in Florida (SWET, 2008a). Discussed extensively in the next section with regard to costs, information on BMP effectiveness in SWET (2008a) suggests that the percent reduction in nutrient concentration
TABLE 2-3 Representative Water Quality Measurements and Model Predictions from Farm-Scale BMP studies in Florida
| Crop | Range of measured [N] (mg/l) |
Range of measured [P] (mg/l) |
Situation | Reference |
|
Central Florida Ridge Citrus (Groundwater) |
4.6-14.0 NO3-N |
NA |
Measured post-nutrient and irrigation management BMPs |
Lamb et al., 1999 |
|
Central Florida Ridge Citrus (Groundwater) |
3-8 NO3-N |
NA |
Modeled post-nutrient and irrigation management BMPs |
Harrison et al., 1999 |
|
Central Florida Flatwoods Citrus (Groundwater) |
0.01-0.07 NO3-N |
NA |
Measured post-nutrient and irrigation management BMPs |
Lamb et al., 1999 |
|
Okeechobee Basin Cow-Calf (SW) |
2.39-4.26 TN |
0.94-2.25 TP |
Measured post-ditch fencing and wetland water retention BMPs |
Shukla et al., |
|
Okeechobee Basin Cow-Calf Improved Summer Pastures (SW) |
3.35-3.9 TKN |
0.58-0.69 TP |
Measured over range of stocking densities |
Capece et al., 2007 |
|
Okeechobee Basin Cow-Calf semi-improved winter Pastures (SW) |
3.16-3.88 TKN |
0.11-0.19 TP |
Measured over range of stocking densities |
Capece et al., 2007 |
|
Suwannee River Basin Row Crops (Groundwater) |
23.2-26.5 NO3-N |
NA |
Measured post-nutrient and irrigation management BMPs |
Graetz et al., 2008 |
|
Suwannee River Basin Dairy (Groundwater) |
0.8-159.5 NO3-N |
0.04-8.45 μg/l SRP |
Measured over range of land uses with dairy farm |
Graetz et al., 2008 |
|
Suwannee River Basin Poultry (Groundwater) |
1.6-19.2 NO3-N |
0.01-0.09 μg/l SRP |
Measured over range of land uses with poultry farm |
Graetz et al., 2008 |
|
Sugarcane Everglades Agricultural Area (SW) |
NA |
0.044-0.170 TP |
Measured post-nutrient and water management BMPs |
Daroub et al., 2011 |
|
Mixed Sugarcane and vegetables Everglades Agricultural Area (SW) |
NA |
0.101-0.165 TP |
Measured post-nutrient and water management BMPs |
Daroub et al., 2011 |
|
TriCounty Agricultural Area Row Crops, lower St. Johns River Basin (SW) |
1-30 TN |
1-14 TP |
Measured post-nutrient and water management BMPs |
Livingston-Way et al., 2001 |
|
TriCounty Agricultural Area Row Crops, lower St. Johns River Basin (SW) |
4-15 TN |
0.36-0.99 TP |
Modeled post-nutrient and water management BMPs |
Livingston-Way et al., 2001 |
NA = not applicable; SW = surface water; SRP = soluble reactive phosphorus.
Box 2-1
Case Studies of Water Quality Improvements Resulting
from Implementation of Agricultural BMPs in Florida
In 1987, the Surface Water Improvement and Management (SWIM) Act was passed by the Florida Legislature as a framework for protecting and restoring Florida waters. Its primary focus at the time was the restoration of Lake Okeechobee, which is upstream of the Everglades National Park. On the northern side of Lake Okeechobee, the primary source of TP to the lake at that time was dairy operations (Bottcher et al., 1995). The primary BMPs for controlling this source of pollution are (1) collection, pumping, and treatment of drainage waters from High Intensity Areas of grazing to adjacent cropland (60-95% reduction in TP concentrations at a cost of $15 to $40/lb of P; SWET, 2008b), and (2) collection and land application of barnyard manure on adjacent cropland based on soil testing (10-90% reduction in TP). Implementation of diary BMPs on half the land in Taylor Creek, a tributary to Lake Okeechobee, was started in 1981. By 1991, these BMPs produced an 84% reduction in TP concentrations and a 40% reduction in TP loads discharged to Lake Okeechobee from this tributary (Anderson and Flaig, 1995). Additional measures required to further reduce TP loads included construction of a 30,000 ac-ft. reservoir to intercept and treat discharge from Taylor Creek (EPA, 2008).
South of Lake Okeechobee is the 700,000 ac Everglades Agricultural Area (EAA). An extensive series of agricultural BMPs were installed for sugar cane and vegetable production in this region from 1991 through the present (Wan et al., 2001), including both water and nutrient management BMPs. Water management BMPs included spatial and temporal water table level controls to reduce drainage losses from EAA farms. Nutrient management BMPs included reductions in rate of phosphorus application and adjustments in placement and timing of application. Tens of thousands of acres have constructed to be Stormwater Treatment Areas. As a result of these actions, TP concentrations declined from 173 ppb in the period from 1980-1991 to 69 ppb in Water Year 2004 (Daroub et al., 2005). This corresponds to a 64% reduction in TP loads from the EAA. Despite these improvements in water quality, the U.S. Sugar Corp. entered an agreement in 2010 to sell the State of Florida 73,000 ac (10%) of sugar cane and citrus land in the EAA at a cost of $536 million ($7,400/ac). These lands are to be used for wetland restoration and water storage and treatment practices that will further improve water quality in the EAA.
typically required in a Florida TMDL could not be achieved by the implementation of “owner,” “typical,” or “alternative” BMPs (see Table 2-4).
Range of Unit Costs
EPA estimated only the costs associated with the “owner” and “typical” BMPs currently practiced in Florida that were assumed to be required in the incrementally impaired watersheds and springsheds. A more com-
TABLE 2-4 Comparison between % reductions in TN or TP required by TMDL studies for Florida lakes or rivers and % reductions potentially achievable with implementation of Owner, Typical, or Alternative agricultural BMPs
| TMDL Study/ BMP Scenario | Percent Reduction in TN | Percent Reduction in TP |
| Lake TMDL Reductions | 24-80 | 10-85 |
| River TMDL Reductions | 8-45 | 11-90 |
| Owner | 10-20 | 9-40 |
| Typical | 5-40 | 5-29 |
| Alternative | 30-52 | 25-52 |
SOURCE: SWET (2008a). The numbers in the columns are the nutrient reduction percentages actually achieved by different types of BMPs (bottom three rows) as compared to that percentage reduction required by the TMDL (top two rows).
plete analysis would have also considered the costs for regional treatment efforts that may be required to further reduce nutrient levels and are often much more expensive. In addition, agricultural land acquisition to limit nutrient intensive activities may be a part of a nutrient reduction strategy and, depending on the crop produced on the land being restored, that can be very expensive. For example, evidence from the Everglades Agricultural Area, Lake Okeechobee, and Lake Apopka restoration programs indicates the need to acquire and convert significant areas of agricultural production land into regional treatment systems at land costs ranging from $5,575/ac to $7,400/ac.
The basis for EPA’s unit costs was SWET (2008a), a recent assessment of BMP costs and impacts on water quality in the Caloosahatchee River
TABLE 2-5 Percent Reductions in Nitrogen and BMP Costs for Three Levels of BMP Implementation in Different Crop and Animal Production Systems
| Production System | Owner Initiated BMPs | ||
| % Reductions |
Cost ($/ac) | Establishment Costs ($/ac) |
|
| Cow/Calf Production | |||
| Improved Pastures | 17 | 4 | 11 |
| Unimproved Pastures | 11 | 1 | 2.2 |
| Row Crops | 30 | 3.5 | 11 |
| Sugar Cane | 10 | 1 | 3 |
| Citrus | 10 | 6.4 | 20 |
| Dairy Production | 20 | 0.7 | 2.2 |
| Hay Production | 15 | 4 | 11 |
SOURCE: SWET (2008a).
and St. Lucie River watersheds in Florida. The dominant land uses in the St. Lucie watershed are pasture and citrus in the west and urban and residential areas in the east. Unfortunately, these watersheds are not necessarily representative of the soils, geology, and land uses in large portions of Florida, including the Panhandle, North and West Central, and West Central Regions.
According to SWET (2008a), “BMP implementation costs were typically not provided with the research studies and therefore had to be developed by SWET, Inc. Cost estimates took into account the following factors: saved fertilizer, equipment and construction, operation and maintenance, energy/fuel, crop yield reduction, crop displacement, and land purchases. In agriculture, when a BMP requires additional land, such as for retention/ detention systems, the area is typically carved out of existing land holdings such that there are costs are associated with lost crop production (displacement).” Based on these statements it is apparent that SWET (2008a) estimated costs contain considerable uncertainty, especially if they are extrapolated from southern Florida to the rest of the state.
As mentioned above, there are three scenarios for BMP implementation: owner implemented, typical cost share incentives, and alternative BMPs including regional treatment systems and other practices that take crop land out of production. Cost and effectiveness information on all three strategies is given in Tables 2-5 and 2-6 for N and P. “Owner” initiated BMPs are the least costly, but result in the smallest water quality benefits. “Typical” BMP programs are more costly, but should result in larger water quality benefits. “Alternative” BMP programs are more costly than the “typical” incentive-based BMPs, but would also result in larger water quality benefits.
There are many limitations of the approach taken by EPA (2010a) to
| Typical Incentivized BMPs | Alternative BMPs | ||||
| % Reductions |
Cost ($/ac) | Establishment Costs ($/ac) |
% Reductions |
Cost ($/ac) | Establishment Costs ($/ac) |
| 10 | 12 | 38.5 | 30 | 35 | 110 |
| 8 | 4 | 11 | 43 | 18 | 55 |
| 30 | 66.9 | 209 | 50 | 141 | 440 |
| 23 | 34 | 108 | 52 | 88 | 275 |
| 5 | 150.4 | 470 | 52 | 77 | 242 |
| 40 | 334 | 1043 | 48 | 240 | 750 |
| 25 | 15 | 47 | 36 | 35 | 110 |
TABLE 2-6 Percent Reductions in Phosphorus and BMP Costs for Three Levels of BMP Implementation in Different Crop and Animal Production Systems
| Production System | Owner Initiated BMPs | ||
| % Reductions |
Cost ($/ac) | Establishment Costs ($/ac) |
|
| Cow/Calf Production | |||
| Improved Pastures | 11 | 4 | 11 |
| Unimproved Pastures | 11 | 1 | 2.2 |
| Row Crops | 30 | 3.5 | 11 |
| Sugar Cane | 10 | 0 | 2.2 |
| Citrus | 12 | 0 | 5.5 |
| Dairy Production | 9 | 2 | 2.2 |
| Hay Production | 40 | 15.8 | 50 |
SOURCE: SWET (2008a).
estimate costs of BMP implementation in agricultural areas incrementally affected by numerical nutrient criteria. First is that the costs of implementing BMPs for water quality benefits are likely to vary considerably in different regions of Florida. The SWET (2008a) estimates are based primarily on experience with BMPs in the Lake Okeechobee region of southern Florida. Second is that EPA (2010a) assumed that BMPs described in the SWET (2008a) owner or typical incentive BMP scenarios would be sufficient (in combination with nutrient reduction efforts from other sectors) to attain numerical nutrient water quality goals. BMP practices in the alternative BMP scenario described by SWET (2008a) will almost certainly be needed in many locations in order to attain the numeric nutrient criteria. Thus, it is likely that the actual annual per acre costs of implementing BMPs on agricultural land to meet EPA’s proposed numerical nutrient criteria will be much larger than their estimates.
Sources of Uncertainty
An underlying assumption by EPA is that the agricultural lands that would require TMDLs and BMAPs under existing state narrative standards would require the same controls to meet the proposed numeric nutrient criteria. There is uncertainty as to whether more restrictive (or less restrictive) controls would have to be implemented in order to meet the numeric criteria. Indeed, one could ask whether the application of “owner” and “typical” BMPs to agricultural lands in Florida would actually be sufficient to allow lakes and flowing waters to meet either the narrative or numeric standards. If “alternative” measures are required to meet the numeric nutrient criteria, the costs and complexities of such efforts increase dramatically.
| Typical Incentivized BMPs | Alternative BMPs | ||||
| % Reductions |
Cost ($/ac) | Establishment Costs ($/ac) |
% Reductions |
Cost ($/ac) | Establishment Costs ($/ac) |
| 19 | 12 | 38 | 38 | 35 | 110 |
| 29 | 4 | 11 | 43 | 18 | 55 |
| 30 | 66.9 | 209 | 50 | 141 | 440 |
| 23 | 34 | 108 | 52 | 88 | 275 |
| 5 | 24.6 | 77 | 52 | 77 | 242 |
| 28 | 334 | 1043 | 48 | 176 | 550 |
| 15 | 4 | 11 | 25 | 12 | 39 |
Such measures would likely include off-site treatment and the retiring of agricultural lands, as was necessary in some of the examples referred to above.
A second source of uncertainty relates to the effectiveness of the FDACS BMP program. Producers who implement and maintain FDACS-adopted BMPs receive a presumption of compliance with state water quality standards. The FDACS Office of Agricultural Water Policy employs a small staff to follow up with producers to confirm that they are conducting the BMPs applicable to their operations. However, enforcement is difficult, and it is not yet possible to get an accurate assessment of whether the BMPs selected by the producers are being properly implemented and effectively maintained, and to what degree they are improving water quality. Other reasons for limited effectiveness include the fact that system complexity and implementation costs can be high, labor and especially management requirements are usually underestimated, planning horizons tend to be short, and the availability and accessibility of supporting resources is limited (Nowak, 1992). Critical to effectiveness are successful implementation and then long-term maintenance for the practice or technology. While a farm in Florida in an impaired watershed is required to adopt BMPs, which BMPs the grower must implement are not specified. There is a substantial gap between what may be required, what may be economically feasible, and what may be sufficient to meet the NNC rule that may not be filled by voluntary action.
Other Analyses
The EPA analysis estimated significantly lower costs for the agriculture sector than the analyses of Cardno ENTRIX and FDACS. EPA grouped
its agriculture land uses somewhat differently: (1) EPA had three classes of cow calf production compared to one for Cardno ENTRIX and (2) EPA classified what Cardno ENTRIX calls sugarcane land use as cropland and pasture land. This is a fairly important difference because the cost for sugarcane BMPs is about twice as much as that for cropland and pasture. Furthermore, the sugarcane land use accounts for 30 percent of Cardno ENTRIX’s costs of meeting the NNC rule.
Citrus and hay are the other two large contributors to the cost (about 50 percent), and they were treated quite differently by EPA and Cardno ENTRIX. Hay is important because it covers a large number of acres, and citrus is important because of the relative high assumed costs per acre for BMPs. In Cardno ENTRIX’s BMP/LOT scenario, their high estimate was that 937,513 acres of hay land would be affected by the NNC rule compared with 284,378 acres estimated by EPA. For citrus, Cardno ENTRIX’s high estimate was 90,142 acres as compared with EPA’s 27,343. This discrepancy resulted from Cardno ENTRIX including additional acres draining to waters that were “unassessed” and thus not included by EPA. Repeating this across all agricultural land use categories resulted in a total difference of about 1.8 million acres between the EPA land estimate and that of Cardno ENTRIX. The differences in per acre BMP costs cited by EPA and Cardno ENTRIX are large for two reasons: (1) different cost estimates for the same BMPs and (2) because of which BMPs were considered necessary to meet the nutrient criteria. Furthermore, it is not clear whether the EPA costs included the same extent of maintenance and other cost components as Cardno ENTRIX did. While EPA almost surely underestimated costs by choosing low-cost BMPs, Cardno ENTRIX’s “end-of-pipe” scenario is beyond what would likely be required to meet the NNC rule and represents an overestimation of BMP costs (and acres to be treated).
Both the number of acres requiring BMPs and the cost per acre for BMPs are clearly highly uncertain. It is always difficult to predict which BMPs farmers will elect to adopt and how well they will maintain them even when they are mandated by regulatory programs. Furthermore it is uncertain whether Florida can effectively enforce the adoption and maintenance of agricultural BMPs. Both the need for farmer cost-share incentives and the need for effective state enforcement will result in transaction costs that neither EPA nor Cardno ENTRIX have adequately considered. How much these transaction costs will add to total costs is unclear, but it could be as high as an additional 25 to 35 percent (McCann and Easter, 2000).
FIGURE 2-5 Idealized individual on-site sewage treatment and disposal system flow diagram.
SOURCE: Bouma (1979).
On-Site Septic Systems
Onsite Sewage Treatment and Disposal Systems (OSTDS) refer to conventional septic tank soil absorption systems and include more complex technologies called Performance-Based Treatment Systems. Regardless of their complexity, OSTDS have the following fundamental distinguishing feature: they treat and return wastewater to the hydrologic cycle close to the point where the wastewater was generated (Crites and Tchobanoglous, 1998. pg 2). This commonality was schematically represented by Bouma (1979) and is reproduced below as Figure 2-5. The figure has been modified to represent septic tank requirements in Florida and to demonstrate a septic-tank soil absorption system adjacent to a flowing stream.
As shown in Figure 2-5, renovated septic tank effluent (percolate) rejoins groundwater immediately below the soil absorption area. Due to the slight groundwater table gradients found in Florida, a plume of septic-influenced groundwater moves very slowly away from the discharge point.
The average home in Florida on an OSTDS discharges approximately 11 pounds of nitrogen per person per year (FDOH, 2010a), and approximately 4 pounds of phosphorus per person per year (Lowe et al., 2009). As percolate from an OSTDS moves down gradient, microbiological and chemical reactions convert nearly all the nitrogen to nitrate while phosphorus is held back in the effluent plume due to adsorption and precipitation reactions (Wilhelm et al., 1994).
Methods for Determining Costs
To determine the costs of implementing the NNC Rule for septic systems, EPA considered the 793,697 active septic systems in the FDEP database, and then determined which of those systems lie within the potential
incrementally impaired WBIDs. Acknowledging that septic systems contribute differentially depending on subsurface transport distance to the waterbody, EPA considered only those septic systems that are within 500 feet of a waterbody in a potential incrementally impaired watershed. This reduced the number of septic systems considered for the EPA cost analysis to 8,224, or just over 1 percent of all the systems in the state of Florida. For the 8,224 OSTDS, EPA assumed that they would require upgrades for nitrogen and phosphorus removal to comply with the NNC rule.
Although necessary to facilitate their analysis, choosing 500 feet as the cutoff distance for OSTDS nitrogen and phosphorus impacts is a critical and as-yet unsubstantiated assumption in EPA’s analysis. A greater distance (e.g., 1000 ft) would take into consideration the specific hydrogeologic conditions in Florida. For example, in areas within the Biscayne Aquifer or in karst geologies, groundwater velocities are so rapid that a 500-ft setback distance could be traversed in just a few days. However, for the vast majority of the state 500 feet is a realistic starting point. That is, it would require months for nutrients discharged 500 ft from a stream or lake to reach the waterbody and in that intervening time, both dilution and removal (adsorption of P, denitrification of N) would likely reduce the ultimate concentration discharged.
EPA assumed that no additional controls would be needed for septic systems to attain the nitrate-nitrite criterion for springs, claiming that the contribution of nitrogen from septic systems is highly uncertain and likely site specific. They cited Brown et al. (2000) as indicating that the preponderance of nitrogen pollution in Florida springs appears to be from fertilizer sources, not septic tanks and wastewater sprayfields. Although Brown et al. (2000) do state that the preponderance of N pollution appears to be from fertilizer sources, they also explain that there are several reasons to treat this finding as an overgeneralization, and point out that there remains significant uncertainty about the interpretation of bulk stable isotope measurements (that are used to distinguish nitrate from mineral sources versus municipal effluent or septic tanks) in complex karst hydrologic systems. A more conservative assumption would have been for EPA to assume that all septic tanks in incrementally impaired springsheds would require upgrade to advance nutrient removal systems.
Effectiveness of Control Measures
EPA recommended the use of advanced nutrient removal systems for the 8,224 OSTDS that would require upgrades to comply with the proposed NNC rule. The effluent standards for this designation were not given and EPA said it was unclear whether retrofit technologies could be used. The
Performance-Based Treatment Systems technologies mentioned in EPA’s report are capable of meeting advanced secondary effluent standards of 20 mg/L TN and 10 mg/L TP. Although further reduction in both parameters are likely in soil absorption and transport, achievement of the actual numeric nutrient criteria is not guaranteed before an OSTDS plume reaches the property line.
EPA did not consider the use of permeable reactive barriers, which were found to be low cost in the Chesapeake Bay watershed and able to achieve a nitrate discharge of 5 mg/L (EPA, 2010b). They are the only known technology likely to be able to approach the proposed numeric nutrient criteria in their discharge. However, permeable reactive barriers have their own limitations, since they have to be replaced on a timed schedule and the longevity of the media is not well understood (Robertson and Cherry, 1995). In the Florida Keys a layer of phosphorus-absorbing media 24 inches thick was used directly beneath the soil absorption area to achieve phosphorus removal to less than 1 mg/L (Ayres Associates, 2000); it was predicted to have a lifespan of 10 years. Unfortunately, no media performs both nitrogen and phosphorus removal simultaneously.
Range of Unit Costs
Using interviews with manufacturers and published cost data, EPA estimated the annualized capital cost of upgrades, assuming 7 percent interest over 20 years, to be between $800 and $1,300 per OSTDS. It is not clear that this simple analysis took into account a number of important factors that should be included in estimating the costs of OSTDS upgrades. Under Florida law, all such upgrades would be considered Performance-Based Treatment Systems, which must be designed by a Florida Licensed Professional Engineer. Typical design fees range from $1,000 to $2,000. Permit fees for Performance-Based Treatment Systems are $125 for the initial application and $100 for a biennial operating permit. Performance monitoring of Performance-Based Treatment Systems, including laboratory analysis, can be expected to range from $400 to $800 per year. In the Florida Keys, which has the highest proportion of Performance-Based Treatment Systems in the state, total annual construction and operational costs for nitrogen and phosphorus reducing systems were estimated at between $1,730 and $2,841 (Ayres Associates, 2000).
In order to install a permeable reactive barrier a hydrologic survey including determination of groundwater elevations would be necessary. Typical fees for such services range from $500 to $1500. In the Chesapeake Bay watershed (EPA, 2010b) anticipated installation costs of permeable reactive barriers ranged from $5,000 to $15,000 per home.
Sources of Uncertainty
Of the two metrics that need to be estimated to determine the range of costs for septic systems to implement the NNC rule, the number of units affected is the more uncertain than the per unit cost because springs areas were excluded from the analysis. There is also regulatory uncertainty. Unlike for the other sectors, implementation of the NNC rule for septic systems could not occur as quickly and unilaterally because the FDEP must work through the Florida Department of Health (FDOH), which has responsibility for regulating OSTDS in the state of Florida. The two agencies interact formally through an interagency Memorandum of Understanding (MOU) and meet monthly to discuss issues of mutual interest. FDOH rulemaking involves the in-depth participation of a stakeholder group called the Technical Review Advisory Panel (TRAP). All meetings of the TRAP are conducted in accordance with Florida’s Sunshine Law. Any person can bring forward proposed rule revisions for consideration by the FDOH and discussion by the TRAP. Florida’s OSTDS rule (64E-6, Florida Administrative Code) has been revised approximately once every two to four years over the last decade.
Other Analyses
In responding to EPA (2010a), FDEP made several extreme assumptions regarding actions needed to make septic systems compliant with the NNC rule. First, it assumed that conventional septic systems on lots larger than three acres would automatically comply with the NNC rule, and thus assumed no additional costs on three-acre or larger lots. A review of the FDOH permitting databases indicates that approximately 83 percent of new septic systems and approximately 90 percent of older systems were on lots less than 3 acres. FDEP chose an overall estimate that 85 percent of septic systems were on lots less than three acres.
Rather than assume a specific cutoff distance from an incrementally impaired waterbody, FDEP assumed that 75 percent of all septic systems discharge to groundwater that eventually becomes surface water. Thus, the number of septic systems in Florida that they included in the cost estimate was 1,687,500 (as opposed to EPA’s estimate of 8,224) (FDOH, 2010b). Although EPA’s assumption of a 500-ft setback can be criticized as an arbitrarily low cut-off for septic systems that might contribute nutrients (given the prevalent and highly transmissive soils and karst geology), FDEP’s assumption that nutrient contributions from throughout the state will impact flowing waters in Florida equally is also questionable.
FDEP assumed that all affected septic systems would be upgraded in the first year (called instant replacement), which is extremely expensive. Even
assuming a more reasonable 5 percent per year replacement over 20 years, FDEP’s annual cost estimates ranged from $0.9 to 2.9 billion because of the larger number of systems considered.
Cardno ENTRIX revised their economic analysis in July 2011 and made major changes in their analysis regarding septic systems to take into account additional geospatial data on septic tanks and new FDOH information on the likely incremental compliance costs associated with septic systems. Cardno ENTRIX accepted a 500-ft setback in refining the number of septic systems affected. Their overall estimate of annual compliance costs for septic systems was between $2 to $18 million dollars, with a mean estimated annual cost of $8 million dollars. This estimate is much closer to the $6.6 to $10.7 million estimated by EPA.
Government Costs
EPA (2010a) assumed all incremental costs to government associated with the promulgation of the NNC rule would accrue exclusively in the development of total maximum daily loads (TMDLs). EPA reviewed potential incremental costs associated with developing site-specific alternative criteria and ambient monitoring, but determined these costs were insignificant. The incremental cost of TMDL development was reduced to a function of the numbers of incrementally impaired waters requiring TMDLs and the estimated cost of TMDL development. As noted previously, the key cost variable is likely to be the number of impaired waters. The potential number of incrementally impaired waters varies widely depending on the assumptions used to identify impairment. Thus, the number of impaired water/pollutant combinations significantly affect the government cost component as well as have a cascading effect on the overall cost estimate.
Methods for Determining Costs
The methodology for determining government costs is found in Chapter 10 of EPA’s economic analysis performed in support of promulgation of numeric nutrient criteria for Florida (EPA, 2010a). Since the primary variable in the cost analysis is the number of incrementally impaired waters, Chapter 10 ties back directly to Chapter 6 where the estimate of incrementally impaired waters requiring TMDLs can be found. Exhibit 6-1 of the EPA analysis presents data in a tabular format summarizing EPA’s analysis of incrementally impaired waters and arrives at a total of 325 waters that include streams, lakes, and springs. EPA further assumed that multiple waters would be included in a single TMDL document. Based on the average of previous Florida TMDLs, EPA estimated two waterbodies would be
incorporated into each TMDL bringing the number of new TMDLs associated with the NNC rule incremental impairment to 163.
Several assumptions are used to estimate the number of incrementally impaired waters, including two key assumptions that eliminate certain groups of waters. Those key groups include waters with existing or proposed TMDLs for nutrients and those waters with insufficient data. If EPA accepts all existing nutrient TMDLs as a means for reaching endpoints compatible with the NNC rule, then the assumption that no additional TMDL work will be required for those waters with preexisting TMDLs is valid. If any of those existing TMDLs are challenged as not reaching suitable endpoints, then there will be added cost for modifying those TMDLs.
The larger uncertainty lies with the elimination of waters determined by EPA to lack sufficient nutrient data. As reported in EPA’s Exhibit 6-1, only 34 percent of the waters without existing or pending TMDLs were thought to have sufficient data. Thus, 66 percent or 3,169 waters were eliminated for lack of sufficient data. As described earlier in this chapter, FDEP later tried to determine which of the 3,169 waters with insufficient data would potentially be identified as impaired using EPA’s numeric nutrient criteria and concluded that 1,018 of the 3,169 currently un-assessed waters would potentially be listed as impaired and require TMDLs when assessed against the numeric nutrient criteria. Using EPA’s estimate of two waters per TMDL, an additional 509 TMDLs would potentially need to be developed, more than tripling the current EPA cost estimate. This Committee advocates for an alternate approach to determining the number of unassessed waters likely to be out of compliance with the numeric nutrient criteria, which takes into consideration the characteristics of the various WBIDs.
Range of Unit Costs
The cost estimate for completing a TMDL was estimated based on a draft EPA document evaluating TMDL program costs (EPA, 2001a). EPA utilized an average cost per impairment of $28,000 based on a range of $6,000 to $154,000 per impairment. Those costs represent an aggregate of costs for all pollutants with no indication as to whether nutrient TMDLs would be more or less costly than other pollutants. EPA further assumed that each TMDL would be written for two impairments, TN and TP. This is a reasonable assumption because most of the incrementally impaired waters would be impaired for both TN and TP. The cost of the second impairment was discounted because much of the background information would have been collected for the first impairment. The second impairment was estimated to cost $6,000 (the low end from the 2001 EPA document). The costs of the two impairments were added and the total was brought forward to 2010 dollars resulting in a unit cost of $47,000 per TMDL.
The EPA (2001a) document included multiple cost ranges for developing TMDLs: the cost for single impairments; the cost for waterbodies with single to multiple impairments; and the cost per state submission which included multiple TMDLs for clustered waters. Interestingly, in the Executive Summary of the 2001 document, EPA references only the waterbody cost estimates in approximating aggregate national TMDL unit costs. Those unit costs utilized for the national estimate range from $26,000 to $500,000 per TMDL with an average of $52,000 dollars. Inflating that average cost to 2010 dollars using EPA’s multiplier yields an average cost of $72,000, or 1.5 times the cost used in EPA’s analysis. It is not clear why the 2010 EPA economic analysis did not use the $52K cost, as the 2001 document is frequently cited, which implies that $52K is the best overall nationwide estimate of TMDL development costs. Perhaps there was a sound reason for the selection of a lower unit cost, however no reason was stated. The 2010 cost analysis also notes that the additional costs for monitoring needed to develop TMDLs were not included in the cost estimates.
Although not cited in the EPA analysis, the support document for the TMDL program costs (EPA, 2001b) provided additional detail on the methodology used to compute costs. A matrix of costs was developed based on the degree of complexity of a TMDL and the efficiencies realized by performing TMDLs for multiple pollutants and/or waterbodies versus single pollutants. The data indicate the cost for a single pollutant, single waterbody TMDL ranged from $36,284 for a simple TMDL to $69,924 for a moderately complex TMDL to $123,476 for a complex TMDL. All costs are in 2000 dollars. Those costs inflated to 2010 dollars are $50,240; $96,500; and $170,400, respectively. Costs for a second parameter at each of the complexity levels are estimated to be $11,978; $28,779; and $56,741 in 2000 dollars, respectively. Inflating those costs to 2010 dollars and adding them to the costs for the original parameters yields the total costs for two parameter TMDLs on single waterbodies as $66,800 for a simple TMDL, $136,200 for a moderately complex TMDL, and $249,000 for a complex TMDL. These estimates range from 1.4 to 5.3 times higher than the analysis used in EPA (2010a).
Regardless of the unit cost selected, the TMDL cost data discussed above are over a decade old. Bringing the cost of the original estimates up to current dollars may be acceptable as an estimate. However, use of contemporary or Florida-specific data may have provided a more accurate estimate of actual TMDL costs. The FDEP Office of Inspector General (FDEP, 2008b) produced a report detailing FDEP TMDL program costs, including operations funding, for the program through 2007. Based on operations funding and the numbers of TMDLs completed, it appears a Florida-specific cost estimate for TMDL development could have been de-
veloped. To develop a crude but rapid understanding of what the number would have been, the following calculations are provided:
• Operations costs from FY02-06 were 21.51% of the total TMDL program costs. Operations costs included “… expenditures such as staff salary, travel, monitoring, contractor services, TMDL development and BMAP implementation.” The BMAP implementation and followup monitoring would go beyond TMDL development costs, but the numbers provided in the report did not go into additional detail.
• Total TMDL costs through FY08 totaled $156.5M. So the estimate of operating costs = $156.5M × 0.2151 = $33,663,150.
• As of the FDEP (2008b) report, there are 156 TMDLs adopted, 100 TMDLs in the process of being adopted, and 83 TMDLs being developed. So one could estimate 256-339 TMDLs developed. Thus, the range of average cost = $33.6M/339 to $33.6M/256 or $99,000 − $131,000/TMDL.
In terms of more contemporary data, EPA has contracted with various consultants for TMDL development throughout the country. It is likely contemporary cost estimates for TMDL development could be calculated based on those contractual arrangements. It may also be possible to parse out the specific cost of developing nutrient TMDLs from those data. At a minimum, the value of the contracts could be used to gauge the general accuracy of the 2000 cost estimates.
Other Cost Considerations
Other costs associated with complying with the NNC rule could have potential fiscal impacts to government bodies other than TMDL development. This document will not attempt to quantify those costs, only to identify the possible additional costs to government. In addition to the potential costs mentioned below, there could conceivably be new administrative, monitoring, and enforcement costs if FDEP ramps up its efforts to address waters newly impaired under the numeric nutrient criteria, but these are not discussed further.
SSAC Development Costs. In the section on municipal and industrial wastewater treatment plants, the EPA analysis assumed there would be liberal acceptance of variances or SSACs to replace the promulgated numeric nutrient criteria on a case-specific basis. SSAC development costs could be borne by government sector or the private sector, but the possibility of the former was not factored into the government sector analysis done by EPA. Regardless of who develops the SSAC, government time and resources would have to be spent evaluating and ruling on the acceptance or denial
of the SSAC, and on evaluating variance requests, but these costs were not considered in the EPA analysis. The history of using SSACs and variances for nutrient issues is virtually unwritten on a national level. Thus, their use in Florida would be breaking new ground.
Second round and later costs for TMDLs. EPA assumes all TMDL costs occur over a nine-year period and then end. In reality, many adaptively managed TMDLs will have to be evaluated after the nine-year period and adjustments made to the TMDL to further reduce nutrients. While not as costly as the original TMDL development, there are costs involved in the reevaluation of those TMDLs.
Potentially Lower Stream Criteria Based on Downstream Protective Values. Once EPA promulgates numeric nutrient criteria for estuaries, those criteria could force lower nutrient concentrations in streams in order to meet the estuary criteria. Lower mandatory stream concentrations could result in additional waters being assessed as impaired, thus increasing the number and complexity of the TMDLs which must be developed.
Sources of Uncertainty
Government costs as analyzed by EPA are tied exclusively to TMDL development. Thus, a significant uncertainty for the government sector is the number of waterbodies that may be impaired and require a TMDL. Different estimates put that number between 325 and 1,018. While there is also a large percentage difference in the unit cost of each TMDL estimated by EPA as compared to others, the gross cost per TMDL is small in comparison to implementation costs in other sectors.
Another significant unknown is that FDEP maintains they will be unable to develop TMDLs and BMAPs for waters deemed impaired according to the EPA numeric nutrient criteria due to Florida state law prohibitions on the use of criteria not contained in state rule (FDEP, 2010). If that is the case, EPA will be forced to take the lead in both identifying nutrient impaired waters and developing TMDLs and BMAPs. Since EPA has no track record of developing nutrient TMDLs, it is unclear what an EPA TMDL would look like, how it would be implemented, and what it would cost. All of EPA cost estimates assume the State of Florida will implement the numeric nutrient criteria. It is anticipated that costs could be significantly higher if EPA were responsible for a nutrient TMDL program because EPA would have initial start-up costs in establishing an infrastructure capable of assessing Florida’s waters, developing TMDLs, and following up on BMAP implementation.
TABLE 2-7 Cardno ENTRIX Total Government Cost Analysis in Millions
| Assumption | Estimated Annualized Cost | Estimated Present Value Cost: 2011-2040 | Monte Carlo Output |
||||
| 5th Percentile |
95th Percentile |
Mean | 5th Percentile |
95th Percentile |
Mean | ||
|
BMP/LOT |
$1 |
$4 |
$2 |
$11 |
$65 |
$32 |
$29 |
|
End-of-Pipe Criteria |
$3 |
$11 |
$6 |
$43 |
$175 |
$93 |
$85 |
Other Analyses
Cardno ENTRIX (2011) performed an analysis of government cost as a part of their overall review of EPA’s cost analysis. Their Monte Carlo analysis of the data led to a prediction of 902 additional waters would be listed as impaired under the numeric nutrient criteria. The analysis also estimated a higher unit cost for each TMDL using EPA’s minimum and maximum unit costs as model inputs. Based on the analysis, Cardno ENTRIX estimated a TMDL unit cost of $64,000 as opposed to the EPA estimate of $47,000.
To determine the total government costs, Cardno ENTRIX considered two scenarios—(1) Best Management Practices for diffuse sources and the Limit of Technology for point sources (BMP/LOT) and (2) End-of-Pipe (EOP) assumption that both point and diffuse sources would be required to meet the numeric nutrient criteria at the end-of-pipe or edge-of-field. The results of the Monte Carlo simulation, which provide a range of cost from low to high, are given in Table 2-7 and range from $1 million to $11 million with a mean of $6 million. The EPA cost estimate of $0.9 million is near the low-end Cardno ENTRIX estimate.
While the difference between $0.9 million and $6 million is very significant in terms of state government budgeting, the government costs are a small fraction of the overall cost of implementation—less than 1 percent. Therefore, the government costs play an insignificant role in terms of the total costs for implementing numeric nutrient criteria.
The first set of findings and recommendations pertain to the determination of the number of incrementally impaired waters, and as such have repercussions for several of the sector analyses. A second set of findings and recommendations are provided that are specific to each sector, preceded by a summary table. All of these findings and recommendations are based on the assumption that EPA would use the same basic method for
any future economic analyses, with the intent of making suggestions for improvements.
Incrementally Impaired Waters and Watersheds
FINDING: The HUC10 delineation used to assess the acreage of various land uses that contribute to the potential impairment is too coarse.
RECOMMENDATION: EPA should use the more refined HUC12 delineation to generate a more precise estimate of the acres to consider for the BMPs in the various land uses.
FINDING: It is not valid to assume that the percent of unassessed waters that would be incrementally affected is zero. A more defensible approach would take into consideration the characteristics of the various WBIDs to predict the likelihood that they would fail to meet the narrative criteria or the numeric nutrient criteria.
Sector Analyses
Table 2-8 summarizes the Committee’s assessment of EPA’s economic analysis by sector. The color coding of Table 2-8 entries reflects the Committee consensus of the accuracy of the EPA evaluation. Green indicates a satisfactory job in addressing the issue, yellow indicates only moderate agreement, and pink indicates unsatisfactory assessment.
The table is based on the cost method used in the EPA analysis, in which the total sector cost was calculated as the product of the number of affected units (or area) and the unit cost. The second column refers to how well EPA determined the number of affected units, including judgments on assumptions used for the number of point discharges that will require treatment upgrades and land areas that will need to have new BMP technologies implemented. The third column deals with the accuracy of unit costs assessments.
The fourth column considers whether the numeric nutrient criteria could be met by existing technologies at the “end-of-pipe” or “edge-of-field” for each sector. The EPA analysis assumes that in every case assimilative capacity exists somewhere in the watershed or waterbody, or that administrative relief is available, such that the each sector does not have to meet the numeric nutrient criteria at the end-of-pipe or edge-of-field. Yet the EPA has not employed watershed modeling to determine if implementing all assumed technologies would allow the numeric nutrient criteria to, in fact, be met. From the regulatory standpoint, if a waterbody violates the numeric nutrient criteria, its assimilative capacity is considered to already be exceeded. Thus, the numeric nutrient criteria were used in this column
TABLE 2-8 Summary of Key Findings by Sector
| EPA estimate of the area affected or number of units | EPA estimate of the unit cost of BMPs | Can chosen technologies/ BMPs meet the NNC? | Strategies to improve the analysis | |
| Municipal Plants | All WWTPs included due to "reasonable potential" provisions of regulations | CAPDET Works cost estimates not verified using Florida-specific experience | Assumed that WWTPs would only be required to treat to 3 mg/L TN and 0.1 mg/L TP and none will treat to NNC at end of pipe | 1. Ground truth unit costs based on significant existing Florida experience 2. More realistically reflection of the proportion of WWTPs receiving administrative relief to avoid treating beyond 3 mg/L TN and 0.1 mg/L TP |
| Industrial Plants | Established by averaging flows from only a limited number of facilities and extrapolating to others | CAPDET Works program (used for municipal facilities) was misapplied to industries | Same as for municipal WWTPs | Should not have investigated only 1 or 2 plants per SIC but rather analyzed each plant |
| Agriculture | EPA likely underestimated the area of incrementally impaired watersheds as well as the number of springs affected | Costs from SWET report not representative; need more site-specific cost estimates | No. Alternative BMPs will likely be required along with land retirement | Use existing TMDLs and restoration plans to identify the BMPs and regional treatment needed to meet the criteria |
| Urban Stormwater | Assumed Urban Turf Rule would insure compliance on all low-density residential land and that all land after 1982 is already in compliance | EPA used low end of a very wide range of unit costs | Assumed traditional BMPs would meet NNC and assumed 100% compliance and functionality for urban BMP implementation; NNC may necessitate more advanced BMPs | Consider advanced BMP implementation throughout most developed land area |
| Septic Systems | Excluded systems beyond 500 ft and springs areas | Reasonable for technologies evaluated | Not necessarily, but other technologies may | Consider wider range of systems and updated per unit costs |
| Government Costs | Did not consider other government costs like SSAC approval, variances, etc. | Used old TMDL cost data not specific to FL | NA | 1. Use contemporary, Florida and nutrient-specific TMDL development costs 2. Consider costs of SSACs, TMDL revision, etc. |
because no other logical benchmark is available with which to compare the performance of technologies and BMPs.
An important consideration not well captured in this summary table (but returned to in Chapter 3) is the degree of uncertainty and variability expected in each of the sector categories. In many cases, uncertainty is expected to be exceedingly high. While some uncertainty is captured in the EPA analysis, it is not considered to be adequate to describe the vast complexity inherent in many of the parameters critical to the economic analysis. In some of the sectors, especially with agriculture and with urban stormwater, technology and implementation unit costs can vary by factors approaching two orders of magnitude. Placing the assessment accuracy results summarized in Table 2-8 in the context of the high uncertainty and variability of many of the categories leads to even greater concern with the EPA economic analysis.
Municipal Wastewater Treatment Plants
FINDING: There is significant uncertainty in the cost estimate for municipal wastewater treatment plants because (1) the unit treatment costs were not thoroughly verified by comparison to the existing and extensive Florida advanced wastewater treatment experience and (2) the assumption that no plant will be required to treat to levels more stringent than 3 mg/L TN and 0.1 mg/L TP is unrealistic. While the proportion that will be able to avoid treating to levels more stringent than 3 mg/L TN and 0.1 mg/L TP is uncertain, there is a real possibility that at least some WWTPs will have to treat to more stringent levels.
RECOMMENDATION: Efforts should be made to compare the unit costs of CAPDETWorks with cost data from Florida. Efforts should also be made to better estimate the percentage of plants that will be required to reach discharge limits more stringent than 3 mg/L TN and 0.1 mg/L TP by performing mass balance and dilution calculations for at least a representative proportion of plants, if not for all of the plants included in this analysis.
Industrial Plants
FINDING: There is significant uncertainty about the incremental cost of the NNC rule for industrial plants for several reasons. EPA based its estimates on one or two selected facilities from each sector and ignored the diversity of industrial facilities within a sector. This extrapolation led to some low-flow facilities exerting a disproportionate influence
on the overall industrial costs. Furthermore, the same cost model and treatment processes were used for industrial facilities as was employed for municipal WWTPs. For facilities with highly variable flows, flow equalization may be a more cost-effective solution than mechanical/ chemical treatment, such that EPA may have overestimated costs for these facilities. On the other hand, some industrial facilities have higher unit costs than municipal WWTPs. Finally, industries covered under general permits were not investigated, raising the question of whether there may be costs to remove nutrients from those facilities that were not captured in EPA’s estimates.
RECOMMENDATION: Given the small number of industries involved, the cost analysis should be improved by analyzing each plant rather than extrapolating the results of one or two plants to the entire sector. As with the municipal wastewater treatment plants, efforts should be made to compare the unit costs of CAPDETWorks with cost data from Florida and to better estimate the percentage of plants that will be required to reach discharge limits more stringent than 3 mg/L TN and 0.1 mg/L TP.
Urban Stormwater
FINDING: For the urban stormwater sector, the costs of complying with the NNC rule in those watersheds determined by EPA to be incrementally impaired are expected to be higher than EPA estimates. However, high uncertainty and variability is prevalent throughout all aspects of this sector analysis, which would lead to a wide cost range and costs that are highly dependent on several critical assumptions. Most traditional Florida urban SCMs will not likely be able to comply with stringent numeric nutrient criteria, but newer, novel (and more expensive) technologies may. Per acre costs for traditional Florida SCMs are highly variable; broadening the SCM options increases the cost range even more. Many simplifying assumptions are employed to estimate urban land area incrementally affected by the NNC rule. Actual affected land area estimates are highly dependent on unverified existing SCM performance and compliance with urban stormwater rules and regulations.
RECOMMENDATION: To improve the cost analysis, higher-efficiency SCMs should be considered, which have costs higher than traditional SCMs. Costs of retrofitting SCMs into already-developed land should be considered.
Agriculture
FINDING: For the agricultural sector, the costs of complying with the NNC rule in those watersheds determined by EPA to be incrementally impaired are likely to be higher than EPA estimates. The incremental land area needing treatment was likely underestimated, individual costs for the BMPs assumed to be sufficient were underestimated, and the more effective and costly BMPs and regional treatment systems likely required to meet numeric nutrient criteria were not included in the analysis. The need for more stringent BMPs and treatment systems has been demonstrated in many of the BMAPs developed for impaired waters in Florida. Furthermore, there were some critical omissions that could well lead to increased costs, including the degree of actual participation by agricultural producers and the costs of maintaining BMPs over time.
RECOMMENDATION: To improve the cost analysis, actual experience from existing TMDLs should be used to identify the BMPs and regional treatment systems that were sufficient or insufficient to meet certain numeric targets.
Septic Systems
FINDING: For septic systems, the costs of complying with the NNC rule in those waterbodies determined by EPA to be incrementally impaired are likely to be substantially higher than EPA estimates. The Committee was comfortable with the 500-ft threshold assumption made by EPA; however, the exclusion of septic systems in springsheds is a significant deficiency of EPA’s analysis. EPA received cost estimates from vendors of equipment capable of meeting a total nitrogen target of 20 mg/l and a total phosphorus target of 10 mg/L, values which are much higher than EPA’s numeric nutrient criteria.
RECOMMENDATION: Efforts should be made to consider septic systems in springsheds and a wider range of systems including permeable reactive barriers, which are known to be more effective in removing nutrients to levels consistent with the numeric nutrient criteria.
Government Costs
FINDING: The incremental costs for the government sector are expected to be higher than EPA estimates. The key factors in determining government cost are the number of incrementally affected units (WBIDs requiring a TMDL) and the unit cost of a TMDL. In the EPA
analysis, WBIDs with insufficient data were not used, thus potentially underestimating the number of incrementally impaired waters requiring TMDLs. Unit costs were based on low-end estimates of costs from a 2001 study that focused on a broad range of TMDL work not specifically related to either Florida TMDL development or nutrient TMDL development. The unit cost selected was less than the national unit cost referenced in the 2001 report.
RECOMMENDATION: Effort should be made to quantify costs for Florida-specific and/or nutrient-specific TMDLs to provide more accurate unit costs for TMDL development. Additional government costs should also be considered, including costs for developing or approving SSACs and variances, costs associated with downstream protective values effectively reducing upstream criteria, future costs of adaptively managed TMDLs, and consideration of additional waters becoming impaired in the future.
Anderson, D. L., and E. G. Flaig. 1995. Agricultural Best Management Practices and surface water improvement and management. J. Wat. Sci. Tech. 31:109-121.
Arthur, J. D., H. A. R. Wood, A. E. Baker, J. R. Cichon, and G. L. Raines. 2007. Development and Implementation of a Bayesian-based Aquifer Vulnerability Assessment in Florida. Natural Resources Research 16(2):93-107.
Ayres Associates. 2000. Florida Keys Onsite Wastewater Nutrient Reduction System Demonstration Project, Phase II Addendum. Bureau of Onsite Sewage Programs, Tallahassee, FL, 28 pp. Retrieved September 6, 2011 from http://www.myfloridaeh.com/ostds/zip/keysnutrientdemoph2.zip.
Bachmann, R. W., M. V. Hoyer, and D. E. Canfield, Jr. 1999. The restoration of Apopka Lake in relation to alternative stable states. Hydrobiol. 394:219-232.
Birr, A. S., and D. J. Mulla. 2002. Relationship between lake and ground water quality patterns and Minnesota agroecoregions. Hydrological Sci. Tech. 18(1-4):31-41.
Bottcher, A. B., T. K. Cremwell, and K. L. Campbell. 1995. Best Management Practices for water quality improvement in the Lake Okeechobee watershed. Ecol. Engin. 5:341-356.
Bouma, J. 1979. Subsurface applications of sewage effluent. Planning the Uses and Management of Land. Madison, WI: ASA-CSSA-SSSA. 665-703.
Brown, C. D., M. V. Hoyer, R. W. Bachmann and D. E. Canfield, Jr. 2000. Nutrient-chlorophyll relationships: an evaluation of empirical nutrient-chlorophyll models using Florida and north-temperate lake data. Can. J. Fish Aquat. Sci. 57:1574-1583.
Capece, J. C., et al. 2007. Soil Phosphorus, Cattle Stocking Rates and Water Quality in subtropical Pastures in Florida, USA. Rangeland Ecology and Management 60(1):19-3.
Cardno ENTRIX. 2011. Addendum to the Economic Analysis of the Federal Numeric Nutrient Criteria for Florida. July 2011.
Carollo Engineers. 2010. Costs for Utilities and Their Ratepayers to Comply With EPA Numeric Nutrient Criteria for Freshwater Dischargers. Prepared for the FL Water Environment Association Utility Council. November 2010.
CH2M Hill. 2010. Statewide Nutrient Removal Cost Impact Study. Prepared for the Utah Division of Water Quality, Salt Lake City, Utah. October 2010.
Crites, R., and G. Tchobanoglous. 1998. Small and Decentralized Wastewater Management Systems. McGraw-Hill Series in Water Resources and Environmental Engineering, Boston, MA, 1084 pp.
Daroub, S. H., T. A. Lang, O. A. Diaz, M. Chen, and J. D. Stuck. 2005. Everglades agricultural area BMPs for reducing particulate phosphorus transport. Everglades Agricultural Research and Education Center, Univ. Fl.
Daroub, S., et al. 2011. Best Management Practice and Long-Term Water Quality Trends in the Everglades Agricultural Area. Critical Reviews in Environmental Science and Technology 41(S1):608-632.
ERD (Environmental Research & Design, Inc.) 2007. Evaluation of Current Stormwater Design Criteria within the State of Florida. Final Report prepared for Florida Department of Environmental Protection, Orlando, FL. http://www.dep.state.fl.us/water/nonpoint/docs/nonpoint/SW_TreatmentReportFinal_71907.pdf.
FDACS (Florida Department of Agriculture and Consumer Services). Office of Water Policy. 2011a. NSPM Annual Report.
FDACS. 2011b. Fact: Sheet “Protecting Florida’s Water Resources with Agricultural Best Management Practices—What, Why, and How.”
FDEP (Florida Department of Environmental Protection). 2008a. Lower St. Johns River Basin Management Action Plan. Tallahassee, FL: Florida DEP. http://www.dep.state.fl.us/Water/watersheds/docs/bmap/adopted-lsjr-bmap.pdf.
FDEP Office of Inspector General (OIG). 2008b. Total Maximum Daily Load Program Review, Division of Environmental Assessment and Restoration. Report # IA-03-14-2008-52.
FDEP. 2010. Memorandum—Department Comments on the Environmental Protection Agency’s (EPA) Proposed Numeric Nutrient Criteria for Florida Lakes and Flowing Waters, January 26, 2010. Florida DEP, Tallahassee, FL. http://waterwebprod.dep.state.fl.us/nutrients/dep-comments/fdep_cover_letter.pdf.
FDEP. 2011. Estimation of the Increase of Water Segment Impairments under the U.S. Environmental Protection Agency’s Numeric Nutrient Criteria.
FDOH (Florida Department of Health). 2010a. Final Study and Report on phase 1 of the Florida Onsite Sewage Nitrogen Reduction Strategies Study (2008-2010). Bureau of Onsite Sewage Programs, Tallahassee, FL, 40 pp. Retrieved August 5, 2011 from http://www.myfloridaeh.com/ostds/pdfiles/forms/NitrogenReductionReport.pdf.
FDOH. 2010b. Bureau of Onsite Sewage GIS Data Files. http://www.doh.state.fl.us/Environment/programs/EhGis/EhGisDownload.htm.
Grady, C. P. L., Jr., G. T. Daigger, N. G. Love, and C. D. M Felipe. 2011. Biological Wastewater Treatment, 3rd Edition. Boca Raton, FL: CRC Press.
Graetz, D., et al. 2008. Evaluating Effectiveness of Best Management Practices For Animal Waste and Fertilizer Management to Reduce Nutrient Inputs into Ground Water in the Suwannee River Basin Section 319 Nonpoint Source Pollution Control Program Education/Training Demonstration Project Final Report, January 2008.
Harrison, C. B., W. D. Graham, and S. T. Lamb. 1999. Evaluating the Impact of Alternative Nitrogen Management Practices on Groundwater beneath Central Florida Citrus Groves, 2. Computer Modeling. Transactions of the ASAE 42(6):1669-1678.
Lamb S. T., W. D. Graham, and C. B. Harrison. 1999. Evaluating the Impact of Alternative Nitrogen Management Practices on Groundwater beneath Central Florida Citrus Groves, 1. Monitoring Data, Transactions of the ASAE 42(6):1653-1668.
Livingston-Way, P. 2001. Water Quality Monitoring and Assessment of Agricultural Best Management Practices in the Tri-County Agricultural Area Phase II Final Report, submitted to the Florida Department of Environmental Protection in fulfillment of Contract No. WM602.
Lowe, K. S., M. B. Tucholke, J. M. Tomares, K. Conn, C. Hoppe, J. E. Drewes, J. E. McCray, and J. Munkata-Marr. 2009. Influent constituent characteristics of the modern waste stream from single sources. Water Environment Research Foundation 04-DEC-1. Retrieved August 8, 2001 from http://www.decentralizedwater.org/documents/04-DEC-1/04DEC01web.pdf.
McCann, L., and K. W. Easter. 2000. Estimates of Public Sector Transaction Costs in NRCS Programs. Journal of Agricultural and Applied Economics 32(3): 555-63.
McKee, K. 2011. National Hydrography Dataset Basin 311. University of Florida Water Institute.
Medina, D., and S. Curtis. 2011. Comparing LID and Stream Restoration. Stormwater 12(6):10-23.
Mulla, D. J., A. S. Birr, N. R. Kitchen, and M. B. David. 2008. Limitations of evaluating the effectiveness of agricultural management practices at reducing nutrient losses to surface waters. Pp. 189-212. In: (J. L. Baker, ed.), Final Report Gulf Hypoxia and Local Water Quality Concerns Workshop. Upper Mississippi River Sub-Basin Nutrient Hypoxia Committee (UMRSHNC). Am. Soc. Ag. Biol. Eng., St. Joseph, MI.
NRC (National Research Council). 2009. Urban Stormwater Management in the United States. Washington, DC: National Academies Press.
Nowak, P. 1992. Why Farmers Adopt Production Technology. Journal of Soil and Water Conservation, Jan-Feb 1992 47(1):14-16.
Robertson, W. D., and J. A. Cherry. 1995. In situ denitrification of septic-system nitrate using reactive porous media barriers: field trials. Ground Water 33(1):99-111.
Shukla, S., D. Goswami, W. D. Graham, A. W. Hodges, M. C. Christman, and J. M. Knowles. 2011a. Water Quality Effectiveness of Ditch Fencing and Culvert Crossing in the Lake Okeechobee Basin, Southern Florida. Ecological Engineering, doi:10.1016/j. ecoleng.2011.02.013.
Shukla, S., W. Graham, D. Goswami, J. Knowles, A. Hodges, V. Nair, M. Christman, C. Wu. 2011b. Evaluation of Cow-Calf Best Management Practices with Regards to Nutrient Discharges in the Lake Okeechobee Basin. Final Report submitted to: Florida Department of Agricultural and Consumer Services & South Florida Water Management District.
Soil and Water Engineering Technology, Inc. 2008a. Tasks 1, 2 and 3: Nutrient loading rates, reduction factors and implementation costs associated with BMPs and technologies. Final Report for South Florida Water Management District. Gainesville, Fl.
Soil and Water Engineering Technology, Inc. 2008b. Task 4: Nutrient loading rates, reduction factors and implementation costs associated with BMPs and technologies. Final Report for South Florida Water Management District. Gainesville, Fl.
U.S. EPA (U.S. Environmental Protection Agency). 2001a. The National Costs of the Total Maximum Daily Load Program (Draft Report). EPA-841-D-01-003.
U.S. EPA. 2001b. The National Costs of the Total Maximum Daily Load Program (Draft Report): Support Document #1. EPA-841-D-01-004.
U.S. EPA. 2008. Final Total Maximum Daily Load (TMDL) for Biochemical Oxygen Demand, Dissolved Oxygen, and Nutrients in the Lake Okeechobee Tributaries. Atlanta, GA: EPA Region 4.
U.S. EPA. 2010a. Economic analysis of final water quality standards for nutrients for lakes and flowing waters in Florida. Washington, DC: EPA Office of Water.
U.S. EPA. 2010b. Guidance for Federal Land Management in the Chesapeake Bay Watershed. Chapter 6—Decentralized Wastewater Treatment Systems. Washington, DC. EPA 841-R-10-002, May 12, 2010. Retrieved August 12, 2011 from http://www.epa.gov/owow_keep/NPS/chesbay502/pdf/chesbay_chap06.pdf.
U.S. EPA. n.d. National Water Quality Assessment Report (n.d.). Retrieved from http://www.epa.gov/waters/ir/attains_q_and_a.html#content.
Wan, Y., M. Voich, and S. Trost. 2001. Effectiveness of Best Management Practices. Everglades Consolidated Report.
Water Environment Federation (WEF). 2009. Design of Municipal Wastewater Treatment Plants, 5th Edition, Manual of Practice No. 8, Alexandria, VA.
Weiss, P. T., Gulliver, J. S. and Erickson, A. J. 2007. Cost and Pollutant Removal of Stormwater Treatment Practices. J. Wat. Res. Plan. Mgmt. 133(3):218-229.
Wilhelm, S. R., Schiff, S. L. and Robertson, W. D. 1994. Chemical Fate and Transport in a domestic septic system: unsaturated and saturated zone geochemistry. Environmental Toxicology and Chemistry 13(2):193–203.


