
A Framework for Incremental Cost Analysis of a Rule Change
EPA’s estimate of the incremental cost from implementing numeric nutrient criteria in Florida was reviewed in Chapter 2. The EPA analysis first estimated which waters would be listed as impaired under the numeric nutrient criteria (NNC), but were not yet listed under the existing narrative rule. That estimation assumed that these waters would not have been listed as impaired under the narrative rule. The corresponding watersheds for these incrementally affected waters were then delineated, and their land uses were determined in order to predict the additional nutrient control actions various source sectors in that watershed would need to take for the numeric nutrient criteria to be met. In addition, EPA estimated how many National Pollutant Discharge Elimination System (NPDES)-permitted municipal and industrial sources that discharge to inland surface waters anywhere in the state would have revised concentration limits for nitrogen (N) and phosphorus (P) in their discharge permits. These two changes were how EPA defined the incremental effect of the NNC rule.
In writing its review in Chapter 2, the Committee accepted the EPA definition of the incremental effect and provided a critique of the methods by which that incremental effect was empirically developed. Chapter 2 reviewed the EPA estimates of the unit costs and effectiveness of EPA’s chosen load reduction methods, concluding that there was much uncertainty about both the costs and effectiveness of the methods. Of course, that uncertainty would be present under any rule.
This chapter proposes an alternative framework for conducting a cost analysis, with an emphasis on defining the implementation time paths of the various rules and consideration of uncertainty. The chapter begins by describing the difference in the rules according to what is required in EPA’s 2010 Guidelines for Preparing Economic Analysis (EPA, 2010a). Those guidelines call for first establishing a baseline “defined as the best assessment of the world absent the proposed regulation,” including identifying starting and ending points over time for the baseline scenario (EPA, 2010a, p. 5-1, 5-2). To develop such a baseline for this chapter, the water quality management process is divided into five broad stages, and a description is provided of how the narrative rule, the NNC rule, and the proposed Florida rule would affect each stage over time. By comparing the three implementation time paths, with the narrative rule as a baseline, one can isolate the differences in the rules in order to determine how these differences might affect costs. In fact, many of the differences in cost estimates made by EPA and others can be traced to different assumptions made about how the rules would affect actions taken in each of the stages.
That discussion is followed by presentation of a framework for predicting incremental costs of the various rules. In describing the logic of the framework and graphically illustrating its application, the text demonstrates that predictions of costs over time depend on many assumptions about (1) current and future regulatory agency behavior, (2) future political and legal decisions and interpretations, (3) waterbody response to load reductions, (4) unit costs of current load reduction activities, (5) changes in cost and effectiveness of load reduction activities, and (6) socioeconomic, demographic, and land use change. Indeed, what was assumed about these various factors explains the differences in the EPA and stakeholder estimates of the cost of the NNC rule. Use of this framework can highlight differences in assumptions, help to narrow differences in the cost estimates if similar assumptions can be agreed to, and highlight how uncertainties can be reduced analytically or by clarification of ambiguities in the rules. What the framework also suggests is that the results of all cost analyses are contingent on the assumptions made by the analysts and that it is an unrealistic expectation of any analysis to produce a single, agreed upon cost estimate.
COMPARING THE NARRATIVE AND NUMERIC NUTRIENT CRITERIA RULES
For the purposes of this comparison, the water quality management process shown in Figure 1-8 was divided into five stages. This section summarizes the actions taken during those five stages under the narrative rule (which is considered the baseline), under the NNC rule that was the motivation for this report, and under the recently proposed Florida rule which EPA
TABLE 3-1 Comparison of Narrative, Numeric, and Newly Proposed Florida Rule For Nutrients
| Stage | Narrative Rule |
| 1. List Waters as Impaired | Based on biological impairment for streams, lakes, and springs |
| 2. Establish Stressor | Determine if N and/or P are stressor(s) causing biological impairment |
| 3. Define Level of Nutrient Reduction/ Write TMDL | Model water quality conditions to relate desired biological condition to N and/or P loads; determine N and or P targets |
| 4. Develop TMDL/BMAP Implementation | BMAP process seeks WLA/LA load reduction balance across sources |
| 5. Determine Use Attainment | Biological condition attained; N and P targets revised to be consistent with meeting required biological condition |
has agreed to consider as an acceptable replacement for the NNC rule. The following descriptions of the rules were derived from detailed flow charts created by the Committee for each rule (see Appendix A).
Description of the Rules
The five stages begin with the identification of impaired waters and end with an evaluation to ascertain when the designated use is met. The stages are shown as row headings in Table 3-1. The cells in the table are abbreviated descriptions of the rules’ content.
| Numeric Nutrient Criteria Rule | Proposed Florida Rule | |
|
N and P assumed to cause impairment if criteria are exceeded and water is automatically placed on verified 303(d) list. |
Streams and Lakes: Based on (1) biological impairment; (2) exceeding nutrient thresholds coupled with biological impairment, or (3) adverse trend in nutrient concentrations |
|
|
Petitioners have opportunity to seek EPA approval of site specific alternative criteria (SSAC) to replace the NNC for P, N, or both |
Streams and Lakes: Determine if N and/or P are stressor(s) causing biological impairment
Springs: No stressor analysis if nitrate threshold is exceeded |
|
|
Model water quality to determine loads of N and P that result in ambient N and P numeric criteria concentrations |
Streams and Lakes: Model water quality conditions to relate desired biological condition to N and/or P levels; determine N and or P targets |
|
|
WLA set by NPDES permitting process/LA the remainder for nonpoint sources |
BMAP process seeks WLA/LA load reduction balance across sources |
|
|
N and/or P ambient concentration equal to NNC or SSAC must be met; biology may or may not remain impaired |
Biological condition attained; N and P targets revised to be consistent with meeting required biological condition |
|
Stage 1: List Waters as Impaired
Stage 1 establishes whether a waterbody is going to be listed as impaired. The narrative rule uses various biological condition indices (depending on the type of water body) as criteria to serve as a proxy measure for the designated use. The water is listed when evidence that the biological condition is unacceptable becomes compelling. To be deemed compelling, the data must be adequate in quantity and quality. If the monitoring data are deemed inadequate, the water is placed on a planning list for further evaluation, before it can be placed on the verified list of impaired waters.
The proposed Florida rule also requires violation of biological criteria for placement on the verified list, but streams will be placed on the planning list if nutrient concentrations exceed a threshold value. To move a waterbody from the planning list to the verified list requires confirmation of biological impairment. In addition, the proposed Florida rule includes a provision to place waters on the planning (not verified) list if they show an adverse trend in biological response variables or dissolved oxygen (DO), even if waters did not fail any of the biological indicators.
The NNC rule measures ambient concentrations of nutrients (N and P) in the water and compares those to ambient concentration criteria that were established for reference water bodies in the region, according to water body type. If the monitored concentration exceeds either criterion then the water is deemed to be impaired, even though there may be no measured biological impairment.
Because the NNC rule offers explicit limits for ambient nutrient concentrations, listing proceeds at a faster pace than under the narrative or the proposed Florida rule due to the more complex evaluation that is required under that latter two for biological assessments. However, the proposed Florida rule will place streams on a planning list if they exceed a nutrient threshold or show adverse trends in measurements of dissolved oxygen or biological condition. Thus, the proposed Florida rule could expedite the identification of waters that are likely to be impaired due to nutrients as well as the development of TMDLs and Basin Management Action Plans (BMAPs) for those waters, relative to the narrative (but not the NNC) rule.
Stage 2: Establish Stressor
Stage 2 in the narrative rule determines whether nutrients are the stressor causing the impairment. This determination is based on analytical procedures (stressor–response relationships) to establish whether N, P, or both are causing the impairment and at what levels might they be creating unacceptable biological conditions. The FDEP may also presume that nutrients are one stressor if the level of N or P is above a threshold concentration in reference waters. If the narrative rule determines that one or both nutrients are the cause of unacceptable biological conditions, nutrient targets as loads or concentrations are established as an outcome of the TMDL process during Stage 3. The proposed Florida rule is essentially the same as the narrative rule for this stage.
Stage 2 under the NNC Rule is less explicit because during Stage 1 the NNC Rule has already listed a water as impaired based on the presence and level of nutrients. However, the NNC Rule does recognize the possibility that there may be site-specific conditions that warrant different criteria and it allows for any entity to petition EPA for approval of site-specific
alternative criteria (SSAC) for a specific location (http://www.epa.gov/region4/water/wqs/). The petition could result in a change in the nutrients to be controlled (to either N or P, as opposed to both) and/or changes to the ambient concentrations of either nutrient. This petition can be filed with EPA at Stage 2 (or at any other stage) after a water is listed as violating the numeric nutrient criteria. According to draft EPA guidelines (EPA, 2011), the FDEP can submit any waterbody with an existing TMDL-derived target (if expressed as a concentration) for approval as an SSAC. It is uncertain whether the TMDL targets will be accepted as SSACs, although EPA cites a memo that says targets can be SSACs for the interim purpose of setting NPDES permit limits.
Stage 3: Define Level of Nutrient Reduction/Write TMDL
At Stage 3, a narrative-rule-driven TMDL will establish concentration or load targets that are predicted to secure an appropriate biological index. The targets may be for N or P, but not necessarily both. It is also at this stage that the waste load allocation and load allocation are established. This division between the waste load allocation and load allocation is based on Florida policy (FDEP, 2001).
Stage 3 occurs similarly under the proposed Florida rule. As currently written, the proposed Florida rule affirms that a numeric TMDL target approved by EPA under the current narrative rule would be the numeric nutrient target for that waterbody. This is not a change from the narrative rule, but under the NNC rule the waters that already had a TMDL and a nutrient target would have still been required to define that target as a concentration (if it was only a load limit in the TMDL), relate the concentration to biological response, and submit that concentration as a proposed site-specific alternative criteria (SSAC) to EPA.
The TMDL analysis under both the narrative rule and the proposed Florida rule requires models that relate loads to ambient chemistry and then to the biological conditions. These will be more complex than the models required for an NNC-derived TMDL. The difference in TMDL model complexity and the different ways that the waste load allocation is defined between the NNC and the narrative rule may allow for the development of a TMDL more quickly under the NNC rule. Also, the NNC rule may accelerate the reduction of loads from NPDES-permitted municipal and industrial sources because a water quality-based effluent limit (WQBEL) may be set for those discharges independent of and prior to the TMDL.
The NNC-based TMDL will be established using models that relate nutrient loads to the ambient concentrations, as defined by the criteria. The NNC rule will establish a TMDL to assure that concentrations are met for both N and P, unless there is approval of an SSAC. These WQBELs may
define the WLA with the residual load allocation being given to the non-NPDES permitted sources.
Stage 4: TMDL Development/BMAP Implementation
At Stage 4, the narrative rule and the proposed Florida rule implement load reductions by writing NPDES permit limits as a part of the BMAP to implement the TMDL. As the NPDES permits are issued to secure the waste load allocation, the plans for the non-NPDES sectors are prepared and implementation begins, employing the various tools available, to meet the load allocation.
Under the NNC rule, it is possible that permit limits for point sources may be established as early as Stage 1, thus focusing the TMDL on defining the load allocation. A key difference of opinion about the requirements in Stage 4 hinges on what is assumed about the way the NNC rule affects the NPDES permit limits and when that effect occurs. Otherwise the pace of development for the implementation plans is the same for all three rules.
Stage 5: Determine Use Attainment
Stage 5 tracks implementation and continues monitoring of ambient waterbody conditions. If the criteria are met then a determination is made that the designated use has been attained. However, monitoring does not stop and loads limits must continue to be maintained in the face of population and economic growth to assure that the water does not become impaired at a future date. The narrative rule and the proposed Florida rule focus their determination of attainment on ongoing bioassessment along with measurement of all stressors. If the TMDL target concentration is met, but biological conditions are not, the TMDL and implementation plan are revised to require further reductions in load, unless a Use Attainability Analysis is submitted and approved. If the biological criteria are met before the nutrient targets are met, the TMDL and implementation plan may be revised and further load reductions would not be required.
Under the NNC rule, monitoring for nutrient concentrations and load reductions will continue until the numeric nutrient criteria are met. There is always the opportunity to petition EPA for an SSAC to show that reductions are no longer needed to meet the designated use.
Key Differences Among the Rules
Listing and Stressor Assessment
The selection of the biological criteria that best represent the designated use and the determination of “data sufficiency” to determine impairment
are central to the execution of the narrative rule. If the criteria are acceptable proxies for the designated use,1 the determination of whether the data are sufficient to establish impairment is, in effect, a decision on acceptable error when making a listing and stressor assessment.
The narrative rule makes an impairment determination based on biological conditions and then moves to further analysis to determine if that impairment is attributable to nutrients (N or P or both) and at what levels. This further analysis defines targets for N and P that are predicted to protect the designated use. A listing based on numeric nutrient criteria simultaneously concludes that either or both nutrients N and P (depending on ambient nutrient concentrations) are the cause of failure to meet the designated use.
In the language of statistics, the null hypothesis is that the water is not impaired. A type I error is concluding that the water is impaired when it is not. A type II error is concluding that the water is not impaired when it is. The likelihood of error is not of interest in itself; what is of interest is the cost of making that error. The cost of a type I error is making load control expenditures from a limited budget that were not necessary to meet the designated use of one or more waterbodies—called the cost of overcontrol. The cost of type II error is the water quality benefits that are lost when a waterbody is not listed as impaired when it is impaired and so load controls are inadequate—called the cost of undercontrol.
While it is not possible to clearly conclude which rule is more prone to which type of error, there are some general observations that can be made. The advocates for the narrative rule want to avoid making a type I error (that is, they want to avoid overcontrol). The proposed Florida rule continues this focus on avoiding type I error, but in an effort to recognize and accommodate the type II error it includes the modification to Stage 1 and 2, described earlier, in which waters with downward trends in chemical condition are put on a planning list. The NNC rule advocates want to avoid type II error (i.e., under-control), and in an effort to recognize and accommodate the possibility of a type I error, it includes the SSAC rule.
Table 3-2 further describes the differences in the rules as responses to the cost of error. Case 2 suggests that if the SSAC rule is not employed, the NNC-listed waters may be listed incorrectly for N, P, or both, leading to a misallocation of TMDL planning and load reduction efforts and costs. Cases 2, 3, or 4 suggest that the NNC rule can be too limiting, or not limiting enough, on discharges of P, N, or both. If the NNC rule were to replace the narrative rule, and if the SSAC option was not employed, there could
![]()
1 The extent to which the biological criteria are adequate in representing the designated use is one concern of critics of the narrative rule; that is, if the criteria are inadequate then the criteria may be met, but the designated uses will not be. The result will be that water quality benefits will be forgone, even as the criteria are met.
TABLE 3-2 Narrative and Numeric Nutrient Criteria Rules Differences for a Given Waterbody
| NNC not Exceeded | NNC Exceeded | |
| Biological Condition Acceptable in WBID and downstream | Case 1. Neither rule would list the waterbody as impaired. | Case 2. Numeric rule would list the waterbody as impaired for N, P, or both; some entity could petition EPA for a SSAC. Narrative rule would not list the water as impaired. |
| Biological Condition Not Acceptable in WBID and downstream | Case 3. NNC rule would not list the water as impaired. Narrative rule would list the waterbody, then ascertain if the stressor was nutrients and if so it would set nutrient targets. | Case 4. Both rules would list the waterbody. Narrative rule would develop targets that could be greater, equal to, or lower than NNC. |
be cases of both overcontrol and undercontrol, with the associated costs of each error. These are not hypothetical possibilities; rather a comparison of TMDL nutrient targets with the numeric nutrient criteria suggests these differences are real possibilities (see Box 3-1). All of this suggests that the SSAC rule, including its likely use and cost, is very important when describing the differences in the rules.
According to the draft guidelines (EPA, 2011), the SSAC rule would be based on analytical approaches that provide evidence, satisfactory to the EPA, that alternative levels of N, P, or both will protect the biological designated uses for both the waterbody and any downstream waters. It is reasonable to conclude from the draft guidelines that the analytical approaches that might be used to support a request for an SSAC are similar to those analyses already in use in the narrative rule. For example, a place-based stressor response analysis might be prepared for the SSAC application to demonstrate that a concentration of nutrients different from the numeric nutrient criteria would support the designated use. In the narrative rule, a similar place-based stressor response analysis is often used to identify what nutrient levels could exist and still be supportive of the designed uses (Stage 2).
There are other key differences between the rules at Stage 2, if not in the analyses themselves. The SSAC occurs after a waterbody is listed as impaired for nutrients and is only completed at the discretion of a petitioner (such as a state agency, discharge source, or a nongovernmental organization, NGO) who would seek an alternative to the numeric nutrient criteria. Therefore, even though the SSAC opportunity exists, it may not be taken and so there may be no costs for the SSAC. In addition, under the NNC rule, waters that have an established nutrient TMDL target that is less strin-
Box 3-1
Do Numeric Nutrient Criteria Differ Significantly From
Nutrient TMDL Targets Developed Under Narrative Criteria?
Data were provided in Appendix H (Exhibit 2-8) by EPA (EPA, 2010b) for waters that have been through Stage 3 of the narrative process and already have nutrient targets assigned by the FDEP. These data were examined to draw a preliminary conclusion about whether the numeric nutrient criteria would differ from the nutrient targets. However, these conclusions cannot be extended to waters that have not been through Stage 3 of the narrative process because the results are not based on a random sample of impaired waters but rather are based on data from those waters that are already have targets. The narrative rule will put a priority on the places where the impairments are most obvious and so the existing narrative targets may not be representative of the targets that would be established for other waters in the future. Within this limitation, the results showed the following:
• Narrative TMDL targets for river nitrogen are generally lower (i.e., more stringent) than numeric criteria
• Narrative TMDL targets for river phosphorus are lower than numeric criteria
• Narrative TMDL targets for lake nitrogen are generally lower than numeric criteria
• Narrative TMDL targets for lake phosphorus are generally higher than numeric criteria
In general, additional load reductions will be required for lakes determined to be impaired for phosphorus under the NNC rule compared to the narrative rule. However, in the case of impairments for river nitrogen or phosphorus, or for lake nitrogen, lesser load reductions would be required by the NNC rule than with the narrative target.
gent than the numeric nutrient criteria with respect to N or P loads would need to be submitted to EPA for approval as SSAC.
NPDES Permitting and BMAP Differences
The EPA economic analysis assumed that there would be no differences in NPDES permit concentration limits or when the limits would be established if the narrative criterion was replaced by the numeric nutrient criteria. Under the CWA, the presence of a numeric limit for an ambient concentration of a pollutant (in this case N and P) may become a water quality based effluent limit (WQBEL). The WQBEL may come into effect as soon as a water is listed as impaired by the NNC rule (Stage 1), even if a TMDL has not been written and a BMAP put in place. Also the NNC rule
creates the possibility that the ambient numeric nutrient criteria becomes an end-of-pipe concentration limit, or a limit that must be met at the edge of a defined mixing zone, if a mixing zone is allowed. For these reasons, it is reasonable for point source dischargers to assume that the numeric nutrient criteria, derived from outside a TMDL, eventually must become NPDES effluent concentration limits, although temporary variances are possible. This temporary relief may be extended if the source seeks and gains approval for a use attainability analysis or SSAC.
Conversely, in the narrative rule the effluent limit for a point source is developed integrally with the TMDL process. The TMDL process, once completed, assigns a waste load allocation to the NPDES-regulated sources; the waste load allocation may or may not result in effluent concentration limits equivalent to the numeric nutrient criteria, even for waters where the ambient target is more stringent than the numeric nutrient criteria, under the FDEP allocation (FDEP, 2001). At this point the TMDL and follow-on BMAP can allocate responsibility for load reduction to non-NPDES sources that might otherwise have been assigned to the NPDES sources under the NNC rule.
The various cost estimations of EPA and other stakeholders differed according to the assumptions made about how the different rules are implemented. Conceptually, the incremental costs of adopting the NNC rule or the proposed Florida rule is the change in costs over what would have occurred under the existing narrative rule during all five stages of water quality management. Defining the baseline involves identifying both current and future conditions that would exist without the regulatory change over the period of analysis (EPA, 2010a). This requires making assumptions about the magnitude and timing of outcomes and costs for three alternative futures: one guided by the narrative rule, one under the NNC rule, and one under the proposed Florida rule.
Costs Defined
For the purposes of the new framework proposed in this section, three costs are defined as follows:
• Nutrient load control costs are the capital, operation, maintenance, and replacement costs incurred by dischargers to implement any action to reduce the discharge of N or P into a waterbody. These were the principal costs considered in the EPA analysis.
• Administrative costs are borne by public or private entities for ambient monitoring, assessment, developing plans (e.g., SSAC application and review, TMDL development, establishing a BMAP), permit issuance, permit
Box 3-2
Water Quality Benefits
The Committee was asked to review those analyses that reported on the costs of possible nutrient load reduction actions. Other parts of the EPA (2010b) report, not included in the committee task statement, included estimates of the water quality benefits from adoption of the NNC rule. By implication, the broader analysis implies that failure to adopt the NNC rule would result in water quality benefits being forgone; these forgone benefits being a “water quality opportunity cost” of continuing with the narrative rule. This opportunity cost argument was made to the Committee in several letters and presentations by Florida-based and national NGOs. They asserted that it was inappropriate and perhaps misleading to review only incremental load reduction and administrative costs. The Committee did not review the EPA described benefits of the NNC rule.
The continuing interest in this topic warranted the presentation in this chapter of the way to frame future analyses to accommodate these concerns. However, this is not a call for detailed water quality modeling for large and complex systems, followed by quantification of benefits (as was done in the EPA analysis). It is, rather, a recognition that a cost analysis will also need to report on assumptions about how different actions taken at different times are more or less likely to protect designated uses, with considerations to response lag times, legacy loads, and demographic and economic growth and change.
compliance reporting and monitoring, negotiating and gaining agreement by landowners to implement BMPs, engaging in legal rules and challenges, etc.
• Water quality opportunity costs are the forgone benefits from not improving water quality to some particular level (see Box 3-2).
Timing and Cost Uncertainty
As discussed in the first section of this chapter, the three rules differentially affect the timing of the five stages of water quality management, and as a result, also the realization of administrative and load control costs and water quality outcomes. However, timing was not considered in the EPA and other reports. The EPA estimates the incremental cost of the NNC rule as the annualized present value of nutrient control costs to fully meet the numeric criteria for the incrementally impaired waters and for the incrementally affected point sources. No date is given when this level of implementation would be achieved, but the impression that is given is that these costs would be faced soon after implementation.2
![]()
2 Note that EPA’s guidance on conducting economic analysis (EPA, 2010a) discusses the need to identify both a start and end point for comparing baseline and alternative policy scenarios.
In fact, timing was not considered even though the proposed NNC rule was explicitly described by EPA as a way to “increase the pace of listing,” with the implication that this would then accelerate the TMDL and implementation stages (King, 2011),3 and despite the well understood reality that implementation under either narrative or numeric rules is constrained by the time required to conduct the necessary studies and by limited budgets and staff. Articulating when costs would be incurred and what level of implementation across the two rules can be expected would provide a more realistic and transparent means to compare the two rules in order to estimate the incremental costs and water quality outcomes. Furthermore, a more explicit and quantitative consideration of timing in the cost analyses would acknowledge that predictions of future conditions under various rules have to be made and that any such predictions is accompanied by substantial uncertainty.
In general, predictions of administrative and load control costs over time, and the resulting water quality outcomes, depend on many assumptions including (1) regulatory agency behavior, (2) future political and legal decisions/interpretations, (3) watershed response to load reductions, (4) unit costs of currently known load reduction activities, (5) changes in cost and effectiveness of control technologies, and (6) socioeconomic, demographic and land use change. Uncertainty can be attributed to a lack of knowledge about the cost of relatively untried technologies or the level of implementation required to meet water quality criteria. Uncertainty can also arise because of unknown future economic conditions and how behavior may change when program rules and incentives change. For instance, substantial uncertainty exists on how the implementation of the numeric nutrient criteria will be translated into effluent limits for point sources. Many of these key uncertainties cannot be eliminated by more data collection or analysis.
Of course, uncertainty does not need to be taken into account when making a water quality management decision if the future costs of being wrong are trivial. It is only when the future costs of a wrong decision are significant that uncertainty takes on relevance when making the initial decision, and demands that an analysis characterize and communicate those uncertainties. Analysts can characterize and communicate these decision-relevant uncertainties (i.e. uncertainties that affect costs) in different ways. EPA’s analysis included some discussion of uncertainty about the assumptions used in its analysis. Cardno ENTRIX performed an uncertainty analysis on the level of treatment and unit costs, relying on a data-limited
![]()
3 The environmental NGO community has made a similar argument in letters to the Committee and in other public statements.
Monte-Carlo simulation. A cost analysis framework that fully recognizes and incorporates timing and uncertainty is presented next.
The Framework Description
A cost analysis requires comparing the future time paths of costs at each stage under either the NNC rule or proposed Florida Rule to the narrative rule (the baseline). This means predicting of the level of activities at each stage for a series of future dates, under each rule, and in turn the timing of future costs. The analysis would be composed of several tasks.
Task 1. Predict the decisions that would be made in each stage, for each rule. The predictions would be for specified time intervals, such as for five-year increments. This prediction requires a clear understanding of the differences in the rules, as described in the beginning of this chapter. The differences among the three rules can lead to different decisions at each stage of water quality management including which waters are impaired; which waters are stressed by nutrients, and which nutrients are the stressors; at what level do the nutrients become a stressor and how this level gets reflected in the TMDL; what are the implementation actions for load reduction, when are the actions required, and what sectors bear the responsibility and costs for those actions; and when has the designated use been attained so that additional load controls are not needed. Prediction of these decisions requires making assumptions about both the likelihood of any particular decision, and the relationship of that decision to others that follow in sequence. These different assumptions about both the ways the rules will work in practice, as well as about the cost estimates for certain load control practices, are the source of the very different cost estimates found in the EPA report compared to the competing analyses. In addition, these same differences of view lead the environmental NGO community to assert that the narrative rule and the proposed Florida rule will result in significant loss of water quality benefits.
Task 2. Estimate administrative and load control costs under each rule and for each future time period. Chapter 2 provides a detailed review of the EPA estimate of unit costs and lengthy discussion of the effectiveness of the load control methods. In the broader framework, there should be at least a narrative statement of the predicted water quality outcomes at each point in time.
Task 3. Characterize uncertainties in Tasks 1 and 2. Determine if the costs of uncertainty are likely to be high. If so, determine whether it is possible to assign probabilities to outcomes and compute expected values (and other moments of the cost distribution) or whether to conduct scenario analysis. Scenario analysis is a method for considering the importance of the most uncertain future conditions affecting an analytical outcome. Un-
like single factor sensitivity analysis, scenario analysis requires describing different combinations of uncertain future conditions that taken together can create different outcomes. Building scenarios can help to isolate those combinations of possible future conditions that are most likely to have significant effects on (in this case) costs. Building scenarios can be a group activity that facilitates knowledge exchange and mutual understanding of central issues important to the results of the analysis.
Task 4. Calculate the incremental difference in total costs (costs of the proposed NNC rule less costs of narrative rule) and relate this to the incremental differences in water quality outcomes at each time period. The costs for the existing narrative rule would serve as the baseline for any comparisons.
Task 5. Record each result in a decision-making display. Figure 3-1 illustrates a template for a single set of assumptions. The rows in grey are decisions and actions at each stage in a rule and are identical to the rows in Table 3-1. There would be templates created for each set of assumptions for the narrative rule (the baseline) and then one for each set of assumptions under the alternative rule (here the NNC).
The content of the grey shaded cells is a description of the level of administrative and load control effort and when the effort is predicted to occur. For example, the cells in each figure can be used to describe when and how many waterbodies would be listed (Stage 1) over a fixed time period. The metrics used for each stage [e.g., the number of waterbodies assessed and listed as impaired (Stage 1), metrics of the stressor evaluation (Stage 2), the number of TMDL plans developed (Stage 3), metrics of the implementation of plans (Stage 4), and the number of waterbodies meeting the
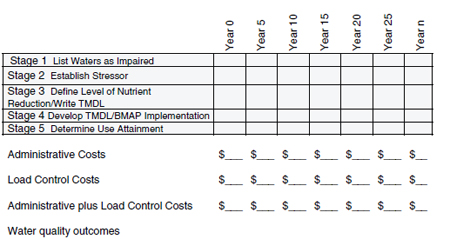
FIGURE 3-1 Timeline of stages and related costs for a rule.
designated use (Stage 5)] should be predicted and the prediction explained, based on how the rule governs these stages and the available funding. Costs are calculated by multiplying the load reduction effort (grey cells) by the cost per unit of effort. This is how the EPA analysis was completed, but unlike the EPA analysis, this framework would make explicit that costs will occur at different times under the two rules.
The content of the cells, as well as the costs and outcomes, can be based on trend analysis of historical records, predictive models, statistical equations, and expert judgment. Once complete, the costs of the narrative process could be subtracted from the numeric process to get a total cost difference, which could be compared to the incremental differences in water quality outcomes and interpreted in light of the uncertainty of the total cost estimates of each process. This can be done for each time period and would provide information on the implication for annual public budgets and when water quality results might be realized. Of course the total cost of either rule can still be calculated as the difference in the present value of the annual total cost between the two rules.4
If uncertainty was not going to be considered in the analysis, then the grey cells simply would record what assumptions were made to warrant the costs shown. However, if there are different assumptions made, then the analysis described above would be repeated for each set of assumptions and cost estimates and water quality outcomes for the narrative process, and then for the NNC process and the array of different outcomes described. These different outcomes might be assigned a probability of occurrence and an expected value, or they may be left as individual scenarios (see Task 3).
Most importantly, the framework encourages decision participants and analysts to explicitly discuss and test assumptions and transparently articulate the differences in costs that might result from these assumptions. For instance, the number of permits modified and stringency of controls within the permits over the period of analysis can be compared with and without the NNC rule. Such a comparison would clearly define what might occur under the baseline condition and transparently illustrate how the level and pace of activities would differ under an alternative rule and alternative assumptions.
How to Use the Cost Estimation Framework
This section offers illustrative examples of how an analyst might fill out the rows in the general framework described by Figure 3-1, for both the narrative (baseline) and the NNC rules. Because differences in the assump-
![]()
4 Also other outcomes of interest such as effects on employment could be made and reported in the same format.
tions underlying how this might be done are often the source of disagreement, discussing how these tables are filled out can be an important means to clarify issues and create transparency in the evaluation of the various options. For exposition purposes, the proposed Florida rule is not included in this illustration.
Illustration 1: The Incremental Difference in Nutrient-Stressed Waters
This discussion illustrates how the incremental differences of the NNC rule at the end of Stage 3 can be described. Under the NNC rule EPA estimates that new waters would be listed (EPA, 2010b, p. 6-3) as nutrient impaired presumably almost immediately after the numeric nutrient criteria rule is adopted. However, it also is reasonable to assume that additional waters would be listed as nutrient impaired under the NNC rule in future years, since more than half of all waters could not be assessed due to insufficient data (note that EPA assumed no additional waters would be listed under the NNC rule beyond the initial assessment). An example of the time path of the number of nutrient-impaired waters listed (at the end of Stage 2) under the NNC rule is shown graphically by the red line in Figure 3-2. The dashed lines indicate uncertainty bands on the estimate of new waters listed under the NNC rule.
Absent the implementation of the NNC rule, additional waters would also have been listed as biologically impaired under the narrative rule (in Stage 1), deemed to be stressed by nutrients (in Stage 2) and then assigned nutrient targets (in Stage 3). The total number of new waters deemed stressed by nutrients in the future under the narrative rule can also be estimated, as shown by the black line in Figure 3-2 (with associated uncertainty bars). The black line shows that a number of waters assessed and identified
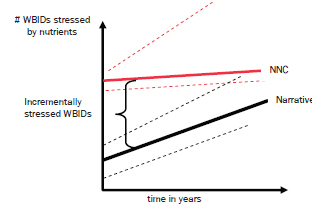
FIGURE 3-2 Illustration of incrementally stressed waters.
as stressed by nutrients will steadily be added to the impaired waters list under the narrative standard. FDEP conducts a number of WBID assessments each year and adds biologically impaired waters that are deemed nutrient stressed to its 303(d) impaired waters listed annually. Projecting this historical pace into the future, the number of new waterbodies assessed, listed, and identified as nutrient stressed under the existing Florida narrative rule could be estimated.
The incremental effect of the NNC rule on Stages 1-3 is the difference between the red and black lines over time (see Figure 3-2). Because EPA’s analysis did not evaluate an implementation time path, EPA effectively assumed that the only incremental change was the initial new listing of waters (the difference between the red line and black lines at a single point in time).
A more complete analysis also would recognize that the narrative rule may list different waterbodies than the NNC rule and ultimately the narrative may require different nutrient targets than the numeric nutrient criteria. Conceptually more waters could be deemed nutrient stressed under the narrative rule at the end of the evaluation period if the NNC rule misses waters that are biologically impaired. Conversely, the NNC rule may deem more waters as nutrient stressed at the end of the evaluation period if the NNC rule includes waters that are not biologically impaired, or if the resource intensive, but budget constrained, narrative rule moves at a slow pace. These and other possibilities are the basis for creating the uncertainty bands. Assumptions and analysis regarding the different possible outcomes produced by the two rules will ultimately have consequences on estimates of nutrient control costs that will be incurred.
Illustration 2: Administrative Costs for Listing and Stressor Assessment
As described above, the two rules entail a number of activities, each requiring a resource commitment to assess and perhaps reassess waters for possible nutrient impairments. These costs were not estimated in the EPA analysis, but as described above represent important differences between the two rules. These differences in turn, will generate incremental administrative cost differences between the narrative rule and proposed alternatives.
An illustrative example of the possible relative magnitude and time path of some administrative costs incurred by the narrative and NNC rules is shown in Figure 3-3. Two administrative costs are shown, one representing the cost of listing waters as impaired and the possible administrative costs of an SSAC rule. In each illustrative graph, the time path of annual administrative costs under the narrative rule is show in black while the time path of costs under the NNC rule is shown in red (the difference between the two represents the incremental cost of the proposed NNC rule).
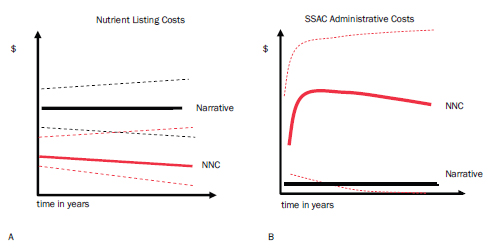
FIGURE 3-3 Illustration of select administrative costs.
Figure 3-3(A) shows the timing and uncertainty of possible future listing administrative costs under the narrative rule and NNC rule. The narrative rule requires a substantial commitment of staff and monitoring resources to identify waters of potential concern, biological monitoring, and stressor-response analysis to identify the cause of the biological impairment. Over time, the annual cost of listing activities may be fairly stable, but could increase or decrease over time (as shown by the uncertainty bands). The NNC rule avoids many of these costs and accelerates the determination of whether a waterbody is to be listed as nutrient impaired. The cost of making that determination is limited to the cost of chemical water quality monitoring and determined through a predefined sampling procedure. While the magnitude and direction of these listing costs under the NNC rule is uncertain, the relevant point is that it is reasonable to conclude that the NNC rule would produce a net incremental cost savings in the administrative costs associated with the listing (difference between two cost time paths).
The NNC rule allows numeric criteria to be adjusted to take site-specific conditions into account through an SSAC rule. Public and private costs, including administrative, analytical, and legal costs, would be incurred for the SSAC and need to be considered as a part of a cost analysis of the NNC rule. The SSAC cost would represent a potentially significant, but highly uncertain, new cost borne by those who would be expected to petition for an SSAC. Figure 3-3(B) illustrates what SSAC costs could be under the assumption that petitioners will challenge a portion of a large increase in newly listed waters under the NNC rule (solid red line). SSAC administrative costs could then gradually decrease as the number of cases declines. By comparison, SSAC costs are modest under the narrative rule
(black line). As has been noted elsewhere, SSAC costs may also be incurred for waters already listed as impaired under the narrative standard. Possible legal challenges for the existing TMDLs could also potentially escalate SSAC administrative costs further.
The uncertainty bands surrounding SSAC costs under the NNC process are shown as large (especially the upper bound) because of higher type I (overcontrol) error rates under the NNC and the highly contentious nature of water policy in Florida, which might inflate legal and administrative costs of conducting SSACs.5 On the other hand, the administrative costs incurred in the SSAC rule might be low because either type I errors are low or the barriers to SSAC participation are so high that petitioners avoid the rule entirely.6 Regardless, this discussion illustrates that the NNC rule potentially creates significant new SSAC-related administrative costs.
EPA did not include costs for the SSAC process in its analysis, because it asserted that the SSAC-like costs associated with site-specific biological assessments are similar to those undertaken under the narrative rule [in other words, the higher costs in Figure 3-3(B) offset the lower costs in Figure 3-3(A)]. However, there are various legitimate reasons to believe this will not be the case. Given the untested nature of the SSAC rule, it is not clear that the total SSAC and administrative listing costs would ever be the same, yet it is certain that the party that would bear the costs is different.
Illustration 3: Timing of Municipal and Industrial Permits and Nutrient Control Costs
Chapter 2 reviewed the estimation of nutrient control costs and uncertainties for municipal and industrial wastewater plants with NPDES permits. This analysis builds on the previous chapter by highlighting the substantial cost differences between the narrative and NNC rule related to the timing of point source control costs. The general pattern of the timing of permit modification and future compliance costs under the NNC and narrative rules is shown in Figure 3-4. According to EPA’s assumptions, all industrial and municipal point without sufficiently stringent nutrient limits would face new nutrient effluent limits in their permits under the NNC rule. Presumably, these permits would be modified within five years of adopting
![]()
5 Similarly, administrative SSAC costs could be higher if the N or P targets in the existing TMDLs are not accepted as SSACs. If the TMDLs are not accepted as SSACs then there will be additional administrative and control costs by either conducting a new SSAC or due to additional nutrient targets imposed by the NNC.
6 Given high administrative barriers and high type 1 errors, the NNC process could potentially increase the control costs faced by the different source sectors (see below) by increasing the amount of area covered by a TMDL.
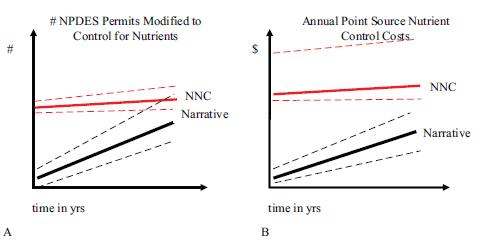
FIGURE 3-4 Illustration of the timing and uncertainty of point source control costs.
the NNC rule and implemented independently of a TMDL. Thus, the point source control costs would also be incurred soon after the NNC rule is adopted, with a WQBEL being set possibly at the level of the numeric nutrient criteria. Under the narrative rule, some point source permits would also be incrementally tightened, but this would occur gradually as TMDL plans are developed and implemented in watersheds with these point sources. The number of future permit modifications under the narrative rule could be estimated by obtaining the historical pattern of permit modifications. Figure 3-4(A) suggests that point sources would likely bear the brunt of cost increases in the initial stages of NNC Rule implementation.
The difference in point source control costs between the narrative and NNC rules is a function of the rate of permit modifications and differences in unit costs. Cost differences are magnified further when considering that the two rules will likely produce different levels of control requirements; that is, at Stages 4 and 5 there might be significant differences in which nutrients have targets for a given waterbody and by how the targets differ from the numeric nutrient criteria. As Chapter 2 highlights, the upper bound estimates of costs to meet the numeric nutrient criteria themselves in plant discharges could be very high [see upper bound dashed red line on Figure 3-4(B)]. Point source costs would increase more slowly under the narrative standard both because permit requirements are phased in over time and effluent limits would be established under Florida TMDL and BMAP rules. Arguably there is less cost uncertainty under the narrative rule than the proposed NNC rule.
Illustration 4: Control Costs for Nonpoint Sources
A stated objective of the NNC rule is to accelerate the implementation of nutrient controls (King, 2010). Assuming that sources outside the NPDES program dominate loadings, under either the narrative or numeric process the majority of nutrient control efforts will be initiated via TMDL development and BMAP implementation (Stage 4 in Figure 3-1). EPA estimated the incremental costs of developing TMDLs and BMAPs that would occur under the NNC rule with no implementation time frame given and with no consideration to what would have occurred in the absence of the proposed rule.
If one considers the difference in costs across time, it is clear that the NNC process would create a larger number of listed waters immediately. However, conducting a TMDL analysis and developing a TMDL/BMAP plan are resource- and time-intensive, with the rate of implementation linked to the level of public cost share support for staff resources and the adoption of control practices. Faced with limited budgets, there already exists a backlog of listed waters without an implementation plan. Currently, only a relatively small portion of all waters listed as nutrient impaired have completed a TMDL and even fewer are under an active BMAP (EPA, 2010b, p. 2-23). Based on past rates of implementation, waters that might be listed immediately under a numeric rule may require years to develop TMDLs and BMAPs. Thus, the pace of TMDL/BMAP development under both rules is expected to be similar and to gradually increase over time [see the black and red lines in Figure 3-5(A)]. The time path of plan development is shown as slightly lower under the narrative process because TMDLs
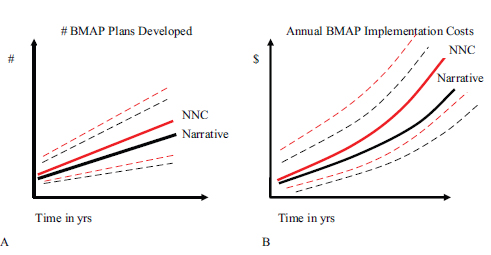
FIGURE 3-5 Illustration of the TMDL and NPS control costs time paths.
may be more analytically challenging due to having biological endpoints. Nonetheless, the relevant point is that the incremental difference between the two rules in terms of when and how many waters will be under an active BMAP plan is predicted to be relatively small due to the existing implementation bottleneck [difference between the red and black lines in Figure 3-5(A)].
The cost implication of these constraints and limitations on the TMDL/ BMAP implementation process is that the cost differences between the NNC and the narrative rules could be small. Figure 3-5(B) shows the differences in nonpoint source control costs of implementing actions to meet the numeric nutrient criteria relative to meeting the narrative targets. Under both rules, nonpoint source control costs will be incurred and these costs will likely increase over time as more expensive efforts are pursued to achieve the water quality criteria. Yet, the difference between the NNC and narrative nonpoint source control curves, which is the incremental cost of the proposed rule, is small, assuming the funding and staffing constraints will be similar across processes.
Figure 3-5(B) also illustrates the substantial uncertainty associated with nonpoint source administrative and load control cost under either rule. Chapter 2 discussed the uncertainty surrounding nonpoint unit control costs for both agricultural and urban sources, as well as the level of application (number, type, and effectiveness of BMPs) needed to achieve nutrient targets/criteria. However, these uncertainties exist under either future process and are arguably substantial. On the other hand, there are possible differences among rules that may lead to different costs for nonpoint sources. For example, the NNC rule requires the achievement of both nitrogen and phosphorus targets in a TMDL plan while the narrative standard may only target one nutrient. Achieving two targets will be more costly than achieving just one, thus increasing the incremental cost of the NNC rule (holding other factors constant). However, the stringency of the final nutrient limits that emerge in the TMDL process under the narrative process is itself uncertain. It is possible that more stringent nutrient requirements would be necessary to achieve biological criteria under the narrative rule (see Box 3-1), increasing the potential costs under the narrative and reducing or eliminating the cost differences between the two processes. What this suggests, and what is shown in Figure 3-5(B), is that the incremental increase in nonpoint control costs is highly uncertain.
Finally, such an analysis also clearly distinguishes between the incremental and the total cost of achieving nutrient standards. While the difference between nonpoint source control costs under the two rules can be analyzed and debated, it should be clear that the costs to reduce nonpoint source discharges to meet water quality standards under either rule are go-
ing to be high and the costs are only likely to increase over time if water quality criteria are to be achieved.
Illustration 5: Ambient Water Quality Outcomes
A final illustration is provided regarding the pace of water quality outcomes under the narrative vs. the numeric process. In seeking to reduce the likelihood of type II error (undercontrol), the NNC rule accelerates both the pace of listing and the imposition of controls and costs for point sources. It is possible that reducing the delay in getting to the implementation stage under the NNC rule will reduce the risk of a loss of water quality benefits over the short or long term. That is, the NNC rule might be expected under some assumptions to result in incremental improvement in water quality outcomes and in more waterbodies meeting their designated uses at certain points in the future (see Figure 3-6).
On the other hand, the discussion above indicates that because the NNC rule does not alter the regulatory and budgetary constraints on nonpoint source controls, the acceleration of water quality improvements that occurs over time could be modest. Furthermore, as Chapter 2 points out, considerable uncertainty exists as to the extent and intensity of controls that will be necessary to achieve designated uses in impaired waters. This uncertainty has the potential to push achievement of water quality objectives further out into the future, such that the differences between the rates at which waters meet designated uses under the two rules might be modest or even nonexistent (see Figure 3-6).
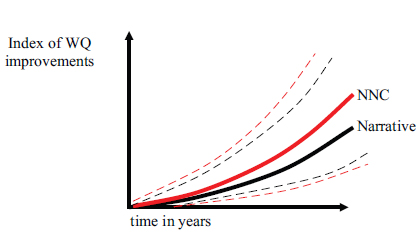
FIGURE 3-6 Progress toward meeting the designated uses.
TRANSPARENCY AND DISPUTE RESOLUTION UNDER THE PROPOSED FRAMEWORK
As has been emphasized, it is only when the future costs of a wrong decision are significant that analytical uncertainty is relevant to making a decision. In the water quality management context, one possible cost consequence of analytical error is that assessment decisions and subsequent control actions may lead to control of nutrients in places where nutrients were not the stressor or at levels that exceed those required to meet the designated use. If this was the result there would have been unnecessary load control costs placed on limited public budgets and on the financial viability of businesses. On the other hand, the argument offered by the environmental NGOs and supported by the EPA is that the narrative rule, in minimizing the possible error of overcontrol of nutrients, makes water quality management too slow and inadequate in protecting designated uses. The dispute over the EPA cost analysis that was the reason for the formation of this Committee can be understood as a difference of viewpoints among agencies and stakeholders about the likelihood that different rules will lead to errors of overcontrol or undercontrol of nutrients and the cost consequences of those errors.
The cost analysis framework presented in the previous section can help to narrow disagreements over the assumptions that might be made to accommodate uncertainty over unit costs, effectiveness of load control, water quality response, and rule design. Thus, a report to decision makers organized around the likelihood and costs of analytical error serves a different purpose than the role often played by a traditional benefit–cost analysis, as represented by the EPA report. In the EPA analysis the rule was written and proposed and then a benefit–cost analysis was conducted to determine the justification for the rule as written. This is a standard application of benefit–cost analysis that proposes to answer a single question: “Is the rule change justified, or is it not?” To answer this question, different analyses had to make different assumptions (implicit or explicit) about how the rule would be implemented over time. The uncertainties in those assumptions could be reported in some fashion, as EPA and Cardno ENTRIX attempted to do in different ways. However, simply reporting uncertainty over benefits and costs, when the question is framed only as whether a predefined rule change is justified, does not contribute to stakeholders’ appreciation of uncertainty nor does it help develop water quality management processes to minimize the likelihood of both undercontrol and overcontrol of nutrients.
The analytical framework proposed in this chapter could be used in support of rule design and could then be transformed to provide an analysis of the justification of any given design. In fact, Florida’s newly proposed alternative to the NNC rule remains focused on minimizing the possibility
of load control cost error, although it seeks to address the criticism that the state has ignored the possibility of too little control on nutrients by having new listing and stressor assessment components during Stages 1 and 2. However, whether these modifications will achieve the desired result is unanalyzed, with the result that environmental NGOs are likely to oppose the new Florida rule. This is not to suggest that had EPA (and FDEP) followed the framework presented in this chapter that there would have been no opposition; however, it is the case that the analyses done to date have done little to bridge gaps that exist between stakeholders. Indeed, EPA conducted its cost analysis in a manner that led some Florida stakeholders to have concerns over its salience, legitimacy, and credibility (similar to what was observed in Jordan et al., 2011; Maguire, 2003).
The following are examples of different ways that reaching agreement on how the water quality management process would change under the various rules might have reduced differences in assumptions and narrowed the estimated cost differences:
• Increases in administrative budgets for assessment and monitoring could reduce the expected size of, and concern over, the costs of both type I and II errors (Shabman and Smith, 2003; NRC, 2001).
• The uncertainty about the SSAC guidelines led to wholly different assumptions by different stakeholder groups. Greater clarity and understanding about the SSAC process, which is central to the NNC rule, might lead to less divergence in assumptions about the cost of applying for SSAC and the likelihood of SSAC approval.
• There were different assumptions made regarding whether the numeric nutrient criteria would become WQBELs for NPDES permitted sources, with the EPA cost analysis assuming less stringent levels of control and being silent on when they would be imposed on NPDES regulated sources. Greater clarity and understanding of the way in which the NNC rule would affect NPDES permit limits might lead to less divergence in assumptions made about the resulting WQBELs.
• The implied assumptions in all analyses were that the TMDL and BMAP once set in motion by the NNC rule could not be altered by new information on costs, effectiveness, and water quality response. A more explicit inclusion of principles of adaptive implementation, and an associated budget commitment, may have lessened concerns about the costs type I and II errors (NRC, 2001; Shabman et al., 2007).
In the end, the “cost” of error depends on what a decision maker believes about the likelihood of an effect of the rule change and their own judgment about the future severity of the adverse consequences. Analysis can narrow, but not eliminate, differences of view about the uncertainty
surrounding these two determinants of costs. Some stakeholders will have preferences that make them unwilling to accept the possibility of costs of overcontrol, while others will not accept a rule that they believe will bring about a possible loss of water quality benefits. Analysis cannot bridge such gaps in preferences.
FINDING: The incremental costs of the NNC rule are attributable to more than an increase in waterbodies listed and a requirement that all NPDES-permitted municipal and industrial sources discharging to surface water have certain effluent concentration limits. In computing the incremental effect, the appropriate baseline should have been defined as what would have occurred over time under the existing (narrative) rule. Thus, an incremental cost is the difference in implementation costs between two (or more) alternative future implementation time paths.
Future cost analyses of rule changes would more fully represent areas of possible costs differences (administration, load control, and water quality opportunity costs) if they were more explicit in describing the differences between the rules over time. This could be done by analyzing and reporting costs as a cash flow over time, showing what sectors bear the costs as nutrient load reductions at different levels are pursued. Comparing the rules over time also can provide an opportunity to present a realistic picture of how the timing of water quality improvement actions might unfold with alternative rules, by illustrating the time lags between listing and achievement of water quality standards. Most importantly, reporting on timing would provide useful information for predicting annual budgetary requirements.
FINDING: Uncertainty is pervasive in estimating the incremental cost of implementing the NNC rule and is inadequately represented in the EPA analysis. In future analyses, reporting the difference in the time paths for implementation of water quality management rules, and associated uncertainties, would provide a more transparent and realistic way to compare costs of the different rules and provide more useful information about where, when, and how costs diverge.
FINDING: Some stakeholders viewed the EPA cost analysis as being superficial or of limited scope, leading to reduced credibility. The result was to foster disagreement about embedded assumptions rather than use the analysis to isolate and possibly reconcile sources of disagree-
ment. Cost analysis as outlined in this chapter can help convey cost estimates in a more transparent way and thus facilitate learning, reduce misunderstandings among stakeholders, and increase public confidence in the results.
FINDING: Based on the conceptual reviews in this chapter and on the content of Chapter 2, the following broad findings are made about the differences between the NNC and narrative rules:
• Administrative costs for listing and TMDL development for FDEP will be lower under the NNC rule because there would be no biological assessment (unless FDEP is the SSAC petitioner). In part, this administrative cost reduction is made possible by the NNC rule shifting the responsibility for SSAC-like analyses to SSAC petitioners and away from the FDEP.
• Compared to the narrative rule, under the NNC rule the pace of listing and the number of waters listed will increase, but the rate at which TMDLs and BMAPs are developed and load controls implemented to meet the designated use will not necessarily increase.
• Municipal and industrial wastewater dischargers may face substantial near-term increases in cost under the NNC rule.
• Over time, there is significant uncertainty in nonpoint source load control costs under either rule because of uncertainty about the incremental increase in the number of listed waters, about the nutrient target levels for N or P, and about cost and effectiveness of nonpoint source load control actions.
FINDING: Conducting the cost analysis as outlined in this chapter, with increased attention to careful assessment of rule differences, stakeholder engagement, and uncertainty analysis, might not have been possible with the budget and time EPA spent on its cost analysis. Any critique of the existing EPA cost analysis should recognize that some deficiencies may be traced to time and budget limitations.
FDEP. 2001. A Report to the Governor and the Legislature on the Allocation of Total Maximum Daily Loads in Florida.
Jordan, N. R., C. Shively Slotterback, K. V. Cadieux, D. J. Mulla, D. G. Pitt, L. Schmitt Olabisi, J. Kim. 2011. TMDL implementation in agricultural landscapes: A communicative and systemic approach. Environ. Management. 48(1):1-12.
King, E. 2011. Presentation to the NRC Committee. July 25, 2011. Orlando, FL.
Maguire, L. A. 2003. Interplay of Science and Stakeholder Values in Neuse River Total Maximum Daily Load Process. Journal of Water Resources Planning and Management 129(4):261-270.
NRC (National Research Council). 2001. Assessing the TMDL Approach to Water Quality Management. Washington, DC: National Academy Press.
Shabman, L., and E. Smith. 2003. Implications of Applying Statistically Based Procedures for Water Quality Assessment. Journal of Water Resources Planning and Management 129(4):330-336.
Shabman, L., K. Reckhow, M. B. Beck, J. Benaman, S. Chapra, P. Freedman, M. Nellor, J. Rudek, D. Schwer, T. Stiles, and C. Stow. 2007. Adaptive Implementation of Water Quality Improvement Plans: Opportunities and Challenges. Durham, NC: Nicholas School of the Environment and Earth Sciences, Duke University.
U.S. EPA (U.S. Environmental Protection Agency). 2010a. Guidelines for Preparing Economic Analyses. Washington, DC: EPA National Center for Environmental Economics, Office of Policy.
U.S. EPA. 2010b. Economic Analysis of Final Water Quality Standards for Nutrients in Lakes and Flowing Waters in Florida. Environmental Protection Agency; November, 2010.
U.S. EPA. 2011. Technical Assistance for Developing Nutrient Site-Specific Alternative Criteria in Florida. June 2011. Interim Draft.


