
METRICS FOR FOOD INSECURITY AND MALNUTRITION
WHAT DO WE REALLY KNOW? METRICS FOR FOOD INSECURITY AND MALNUTRITION1, 2
Hartwig de Haen and Stephan Klasen, University of Göttingen
Hartwig de Haen and Stephan Klasen summarized their background paper, which examines three key methods of assessing food insecurity and malnutrition: (1) the United Nations (UN) Food and Agriculture Organization (FAO) indicator of chronic undernourishment, (2) indicators derived from household consumption surveys, and (3) anthropometric measures. They illustrated the dimensions of food insecurity (Figure I 1-1), reviewed the discrepancies and complementarities between indicators, and offered recommendations for improvement.
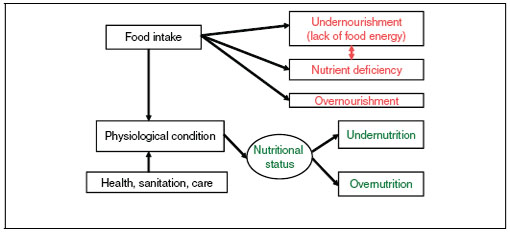
FIGURE I 1-1 Dimensions of food insecurity.
NOTE: Food Security ![]() Nutrition Security; FIVIMS—Multiple Indicators Needed
Nutrition Security; FIVIMS—Multiple Indicators Needed
SOURCE: Presentation by Hartwig de Haen, University of Göttingen, February 16, 2011.
____________
1 The complete background paper authored by de Haen, Klasen, and Matin Qaim is included in Appendix D.
2 The presentation is available at http://sites.nationalacademies.org/PGA/sustainability/foodsecurity/PGA_060826, presentation by Hartwig de Haen and Stephan Klasen (February 16, 2011).
The FAO indicator—This indicator is based on national level food balance sheets. It is published annually and, among other things, is used to monitor the Millennium Development Goal (MDG) for hunger. It estimates on a global scale the number of persons in a country whose daily food availability does not provide the minimum amount of energy (kilocalories). It can be criticized for (a) the possibility of errors in food balance sheets caused by uncertain data received from national level data inputs and (b) possible biases in the parameters used to reflect the inequality of consumption within countries (the coefficient of variation). de Haen and Klasen concluded that the FAO method, in principle, was sound theoretically, but that there were major uncertainties and gaps in the data base, so that at present its accuracy is very much open to question. Also, it does not generate actionable information to identify and monitor priorities at the national and sub-national levels.
Food consumption surveys—Nationally representative household surveys are an increasingly important source of data on food security. They are being conducted more frequently and with rising accuracy. Information on food consumption is derived by converting food expenditure information into consumption quantities and calories. Surveys provide a more direct assessment of food energy deficiency at the household level, compared to the FAO method, and provide direct measures of the intra-national inequality of food intake. As with the estimates derived from food balance sheets, household surveys may face problems with data accuracy. There are also concerns about their high cost, timeliness, coverage, and comparability between countries and over time.
Anthropometric measures—These measures are based on nationally representative surveys such as the Demographic and Health Surveys (DHS) or integrated household expenditure surveys (e.g., living standard measurement surveys). They may include anthropometric measurements for all household members, or only for children under a given age (often for children less than 5 years of age), or for women and young children in the household. The data for children are compared to an international reference standard (WHO, 2006) to derive prevalence rates of stunting (low height-for-age), wasting (low weight-for-height), and underweight (low weight-for-age). They are actionable indicators that can be used to target specific interventions and to monitor changes in nutritional status as well as responses to programs and policy changes. There is increasingly good coverage of these indicators internationally and comparability between countries (especially for indicators derived from the DHS). One of the limitations of this indicator is that it is often collected only on children—and, in many cases, their caregiver (such as in the DHS). The data are also usually not collected yearly, preventing the monitoring of short-term trends. The DHS surveys also fail to gather data on important covariates such as income, although integrated household expenditure surveys that collect anthropometric data do have information on total expenditure (a good proxy for income). One advantage of anthropometric data is that they can also be used to derive indicators of overweight and obesity and provide some information on the nutrition transition. But there are also questions about their comparability over time and between countries. In particular, the nutrition transition leading to heavier children may erroneously suggest improvements in underweight (the key MDG indicators), and the method is extremely sensitive to assumptions about even small genetic differences in height and weight potential among populations.
Recommendations from the Authors
de Haen and Klasen first emphasized that each of the indicators discussed above have its particular strengths and weaknesses (Table I 1-1). As a result, a key recommendation is to first work towards a suite of indicators that draws on the respective strengths of each approach. A first step in that direction is to be more transparent about the methods for calculating the measures, and to assemble information in one place (e.g., a Web site) that allows immediate comparisons using all the measures used. Moreover, de Haen and Klasen made several recommendations for improving the FAO indicator, namely, strengthening the food balance sheets data, updating the coefficients of variation, and resuming estimates of the depth of hunger. They also suggested expanding living-standard measurement surveys and possibly linking them to anthropometric surveys (or adding anthropometric measurements where possible). In addition, they recommended using these surveys to derive additional nutrition indicators such as dietary diversity (e.g., using food expenditure modules) and overweight and obesity indicators (using anthropometric measurements of household members), and expanding surveys to include indicators of micronutrient deficiencies (e.g., biomarkers). de Haen and Klasen emphasized that food security is not synonymous to nutritional security, and that both types of indicators should be generated. That is, nutritional security depends not just on food intake but also on physiological condition, health, sanitation etc. They also noted that the common metrics used to assess food insecurity are often inconsistent and focus on chronic food insecurity and on deficiency of energy (kilocalories), ignoring the important dimension of dietary quality. Different metrics are needed to assess the effect of short term price rises and supply disruptions as well as to gauge the magnitude, type, and depth of hunger and to develop appropriate policy responses.
As next steps, they suggested establishing an on-line inventory of various indicators and taking steps to enhance the empirical databases. They also recommended a number of institutional reforms, including encouraging key agencies to cooperate in overcoming incompatibilities between methods and advocating and promoting country owned measurements and policy responses.
TABLE I 1-1 Performance of Three Assessment Approaches as Currently in use with Respect to Different Criteria
| Criterion | FAO approach | Consumption survey | Anthropometry |
| Ability to draw a regular picture for total global, regional and national populations | ++ | - | + |
| Ability to draw a regular picture for special population groups at global level | - | - | ++ |
| Usefulness to assess inequality of food consumption within countries | -- | ++ | -- |
| Usefulness to assess consumption consistent with national supply and demand | ++ | - | -- |
| Accuracy in terms of measuring the adequacy of food intake | + | ++ | -- |
| Accuracy in terms of measuring and identifying determinants of nutritional status at a point in time | - | + | ++ |
| Accuracy in comparing nutritional status across space and over time | -- | + | ? |
| Ability to assess dietary diversity and micronutrient status | -- | ++ | - |
| Ability to portray regional and socioeconomic heterogeneity within countries | -- | ++ | ++ |
| Ability to portray seasonal variation | -- | - | - |
| Ability to inform global governance | ++ | - | ++ |
| Usefulness to guide national policy decisions (e.g., targeting) | -- | + | ++ |
| Usefulness to simulate nutritional impacts of policies and shocks at country level | -- | ++ | - |
| NOTE+ and - signs indicate whether or not the approach is suitable. Double signs indicate very suitable or very unsuitable. | |||
| SOURCE: Presentation by Hartwig de Haen, University of Göttingen, February 16, 2011. | |||
FOOD CONSUMPTION INDICATORS: FAO CHRONIC HUNGER INDICATOR3
Pietro Gennari, Food and Agriculture Organization
Pietro Gennari outlined some of the major criticisms of the FAO measure. He cited concerns about the appropriateness of FAO’s operational definition of hunger, the soundness of the methodology, and the reliability of the data used to compile estimates. He talked about new
____________
3 The presentation is available at http://sites.nationalacademies.org/PGA/sustainability/foodsecurity/PGA_060826, presentation by Pietro Gennari (February 16, 2011).
demands for information at national and subnational levels as well as by socio-economic groups, interest in tracking changes in hunger to income growth and poverty reduction, and real time monitoring in response to food price changes.
Gennari explained that the FAO prevalence of undernourishment (PU) indicator is based on two fundamental assumptions:
- Nourishment refers to food intake, not to the consequences of metabolic food processing.
- Food intake can be properly measured through the amount of dietary energy.
FAO’s PU is an indicator of chronic hunger; that is, it captures the evolution of fundamental elements that drive long term nutritional status. As such, it is not intended to capture the impact of seasonal food shortages or temporary food price crises, unless such events have long lasting consequences. He noted the need for additional indicators to measure, for example, the impact of price volatility on food security. Gennari also discussed the FAO methodology, described in Box I 1-1.
FAO is currently working on a comprehensive revision of its methodology. Gennari cited the major issues being addressed:
Improvement of food balance sheets (FBS) estimates. The amount of food available in a country is a very important indicator in its own right and not just an input into measuring undernourishment. It measures one of the key dimensions of food security as defined by the World Food Summit in 1996. A program of revision of the FBS parameters and technical coefficients used to estimate the diverse uses of food items for non-human consumption and their conversion into nutrients has been undertaken. A system for regularly updating these parameters also needs to be put in place. In the longer-term, FBS estimates will benefit from improved basic agricultural data through a new initiative of statistical capacity development (the Global Strategy to Improve Agricultural Statistics) recently launched by FAO in partnership with other international and regional organizations.
Whenever possible, make systematic use of household survey (HS) data to estimate the mean and coefficient of variation (CV) of the dietary energy consumption (DEC) distribution, and compare them with the parameters used in the past. This activity also contributes to the objective on reconciling estimates of food availability from FBS and HS.
BOX I 1-1
Theoretical Considerations and Implementation
FAO follows a parametric approach based on postulating a probability model for the level of individual dietary energy consumption (DEC) in the population, as opposed to a possible nonparametric approach based on the measure of the relative frequency in a sample of people found to consume less than their requirement. The parametric approach has the advantage of allowing for a better comparability and aggregation of the estimates obtained for different countries.
In the practical implementation of FAO’s parametric approach, key choices (which have been subject to criticisms) are the following:
1. Choice of the most appropriate model for the marginal distribution of DEC. In practice, FAO has been using a lognormal distribution for DEC. The choice has been admittedly guided by desirable properties of the statistical model (flexible, yet parsimonious) though a number of tests in the past have consistently failed to reject it as a legitimate one.
2. Method to estimate the parameters of the marginal distribution of DEC.
• The Mean. FAO has traditionally used the mean per capita dietary energy availability as derived from food balance sheets (FBS) data and after converting food available into calories. It has been proposed that, where available, estimates of mean per capita food consumption obtained from household surveys (HS) be used instead. Since household budget surveys of good quality are now frequently available and with a good country coverage, FAO plans to use both FBS and HS for the same country and, if needed, year-after reconciliation of the estimates obtained from the two sources.
• The Coefficient of Variation. As opposed to the mean, the only possible source of data for estimation of the coefficient of variation (CV) of DEC is survey data. One debated issue is whether survey data can be used for a direct estimate of CV or if an indirect method needs to be devised. According to FAO, direct estimates of variance from household surveys are likely to be biased because of higher variability in samples than in the population, for various reasons, including that survey rounds are usually spread across the year and the likely presence of outliers, missing data (e.g., food consumed away from home), and so on. To avoid the problem, FAO has devised an indirect method based on clustering individual households’ data to eliminate unwarranted variability.
3. Method to estimate the cut-off level of the minimum dietary energy requirement (MDER). In estimating the MDER, DER depends on the basic metabolic rates of individuals, which vary with sex, age, and the level of physical activity. Normative values on the acceptable ranges of energy requirements are given for groups of same sex-age by expert nutritionists. The minima of those ranges compatible with a light physical activity level are averaged across the sex-age composition of the population to provide a single estimate of MDER
Additional tests and refinement of the parametric model, which includes performing new tests of the lognormality of the DEC distribution and devising proper methods for interpolation and extrapolation of the estimate of the prevalence of undernourishment (based on observed evolution or on projected values of income, price, and population) for producing revised time series of country-specific PUs, and real time global PU estimates, even before actual data on food consumption are available.
Production of additional indicators. In view of broadening the scope for information on food security and nutrition, as a first step FAO proposes the following additional indicators, which could be easily produced given the available data: (1) prevalence of over-nourishment, (2) prevalence of population under food stress (minimum dietary energy requirement corresponding to an economically active life), and (3) depth of food deficit (amount of energy that would be needed to ensure that hunger would be eliminated).
Improved communication, to allow users to understand the specific analytic objectives and theoretical basis of each of the indicators, to provide measures of uncertainty associated with point estimates, and to resist publication of estimates when based on data that are deemed unreliable. The overall aim is to consolidate FAO’s role as the main contributor to the monitoring of food security, by developing a platform for dissemination of a comprehensive set of food security indicators and related background information to serve the needs of analysts and policy makers.
FAO UNDERNOURISHMENT INDICATOR: STRENGTHS AND WEAKNESSES4
Benjamin Senauer, University of Minnesota
Following the Gennari presentation, Ben Senauer reiterated the basic elements of the FAO methodology for estimating the number of food insecure persons, which is based on three key components. The first component is the average calories available per capita, the dietary energy supply (DES), based on national food balance sheet data. The second is the distribution of calorie consumption across the population, for which a log-normal function is assumed and a CV derived from household survey data is utilized. The third is an average minimum calorie requirement for the population, based on gender and age, which establishes a cut-off point on the distribution for undernourishment.
Senauer described some of the strengths of the FAO indicator. The measure serves as an important, annual benchmark of progress towards reducing chronic hunger, or the lack thereof, assuming it has the right trend. With the FAO indicator, food insecurity can be monitored at the global, regional, and national levels, and the same methodology is used for every country. He noted that the FAO indicator relies on the accuracy of the three major components, with food balance sheet data as the foundation. National food balance sheets, also referred to as food disappearance or food availability data, form the foundation for FAO’s estimates. They start with an estimate of a country’s production by crop, based on estimates of the area harvested and yield. The quality of these estimates almost certainly varies enormously between a country like Norway and the Congo. The supply of a crop is equal to production plus imports and beginning
____________
4 The presentation is available at http://sites.nationalacademies.org/PGA/sustainability/foodsecurity/PGA_060826, presentation by Benjamin Senauer (February 16, 2011).
stocks, minus exports. Disappearance or utilization must then balance (equal) supply. Disappearance includes seed and feed use, ending stocks, government purchases, and a “residual”, which balances supply and utilization. This residual is assumed to have been “consumed” or is available for consumption. The aggregate availability is divided by national population to get per capita availability. The calories across all crops and animals can then be summed to get the total dietary energy supply (DES) per capita. This result depends on many separate estimates within the food balance sheet.
Senauer discussed the difficulties inherent in converting the crop or animal supply at the farmgate into what is available as retail-level food products and accounting for losses during transportation, storage, and processing. For example, the U.S. conversion factor for converting beef carcasses to retail beef is 0.76, and 0.689 for boneless, which means 76 percent of a beef carcass is assumed to end up at the retail level, or 68.9 percent when leaving out the bones. The determination of the conversion factor can be very complicated, when considering the hundreds of different food products that a crop like wheat is used for. In addition, to get to the DES utilized for the FAO estimates, losses at the household level must be accounted for, such as losses during home storage and cooking and uneaten food. In conclusion, Senauer asked how reliable are food balance sheet data for deriving FAO’s undernourishment estimates.
OUTCOME INDICATORS: MEASURES OF MALNUTRITION5, 6
Lynnette M. Neufeld, Micronutrient Initiative
Lynnette Neufeld began her presentation by explaining that collecting information on the nutritional status of populations is necessary to characterize the magnitude and distribution of deficiency, to identify subgroups at risk, and to design, implement, and monitor interventions and programs that can address nutritional problems and their direct and indirect causes. Several indicators are used at the population level to serve this purpose, including anthropometric measures (physical size, growth over time, and age), dietary intake, and biomarkers of micronutrient status. She commented on some of the strengths and weaknesses of anthropometric measures and the use of physiological biomarkers when assessing the nutritional status and health of populations.
Anthropometric Indicators
Neufeld talked about the use of size as a reflection of the growth process and its use as a proxy for health status because it is strongly associated with mortality and morbidity risk, impaired cognitive development in children, and adverse pregnancy outcomes. Examples of such measures are illustrated in Table I 1-2. She noted that the potential height of an individual is determined by genetics, but actual size and rate of growth depend on whether potential is limited by inadequate nutrition and illness. Growth of an individual can only be assessed with multiple
____________
5 Presentation prepared in collaboration with Blair Cameron, Research Associate, Micronutrient Initiative.
6 The presentation is available at http://sites.nationalacademies.org/PGA/sustainability/foodsecurity/PGA_060826, presentation by Lynnette Neufeld (February 16, 2011).
measures over time; single measures assess size, which can be interpreted in comparison to what is expected in a healthy individual for a given age.
TABLE I 1-2 Metrics for Assessing Malnutrition
| Weight Height |
Low | Adequate | High | |||
| Micro- nutrient sufficient |
MN deficient | MN sufficient |
MN deficient | MN sufficient |
MN deficient | |
| Low | Stunted Wasted |
Stunted Wasted |
Stunted Adequate weight |
Stunted Adequate weight |
Stunted Over weight |
Stunted Over weight |
| Adequate | Adequate height Wasted |
Adequate height Wasted |
Adequate height Adequate weight |
Adequate height Adequate weight |
Adequate height Over weight |
Adequate height Over weight |
| SOURCE: Presentation by Lynnette Neufeld, Micronutrient Initiative, February 16, 2011. | ||||||
Height below what is expected for age is an indicator of chronic nutritional status. Weight-for-height reflects the extent to which the body’s soft tissues (muscle and fat, principally) are proportional to their size (height) and is thus a reflection of short term or acute nutritional status. In older children and adults, the body mass index (BMI) (weight [kg]/height [m2]) is often used to reflect the appropriate proportion between body mass (soft tissue) and height (WHO, 2006). A third indicator, weight-for-age, has been used to provide a reflection of the overall nutritional status of an individual but without distinguishing between compromised growth due to undernutrition (low height) and current or acute malnutrition (low weight-for-height). Nor can weight-for-age distinguish among individuals who may be tall and thin (e.g. high weight-for-age and height-for-age but low weight-for-height) and those who are short and adequate- or even high-weight proportional to their height. Other measures of child size can provide context to weight-for-age, including height-for-age, an indicator of long-term nutritional status, and weight-for-height and mid-upper arm circumference (MUAC), both indicators of short-term nutritional status. Therefore, weight-for-age has limited utility to distinguish between the likely causes of nutritional problems and provides no clues as to the types of interventions that might be needed to alleviate them.
Neufeld noted that the World Health Organization’s (WHO) Global Database on Child Growth and Malnutrition compiles information on all four anthropometric indicators of nutritional status: height-for-age, weight-for-age, weight-for-height, and BMI-for-age (WHO, 2006). However, the utility of these indicators for informing policies and programs at a country level relies on the availability of this data being systematically collected and its accuracy, as well as the availability of information related to the potential causes of any observed deficits. The only one of the four indicators that is widely collected by numerous countries is the prevalence of low weight-for-age. This is due at least in part to ease of measurement and because it is a key indicator for monitoring progress towards the Millennium Development Goals. Despite the limitations mentioned above, this information allows for comparison within and across regions and countries over time (United Nations, 2010).
Biochemical Indicators
Neufeld explained that the utility of anthropometric indicators to provide a complete reflection of the nutritional status of a population is further complicated by the potential for concurrent micronutrient deficiencies, even in an apparently well-nourished group. Biochemical indicators or biomarkers are used to detect a deficiency before clinical signs appear, requiring biological samples most commonly in the form of blood or urine. Biomarkers of micronutrients may reflect exposure (dietary intake), status (nutrient reserves), or function (improved or compromised performance of a system).
There has been some progress in improving the availability of sensitive and specific biomarkers of micronutrient status. The U.S. National Institutes of Health are currently leading an initiative entitled Biomarkers of Nutrition for Development (BOND). BOND focuses on clarifying the uses of biomarkers for different user groups (research, clinical, policy, and programs applications), identifying the strengths and weaknesses of current biomarkers to meet the needs of those groups, and promoting the research and technological innovations needed to strengthen them.
Indicators of exposure, such as dietary assessment, can also provide information on the risk of inadequate intake and of resulting micronutrient deficiencies. Dietary intake assessment methods, Neufeld noted, can be time- and resource-intensive, but simple measures of dietary diversity (e.g., number of food groups consumed in past 24 hours) have recently been shown to be useful predictors of the probability of inadequate intake of micronutrients in children and in women of reproductive age (Arimond et al., 2011). These simple indicators can be collected through large, nationally representative surveys such as the DHS or the integrated household expenditure surveys and generate useful information on the risk of poor diet quality and micronutrient deficiencies in certain population groups.
Conclusions
Neufeld concluded that there have been many improvements in the quality and availability of information on the nutritional status of populations in recent years. The inclusion of anthropometric measures in large national surveys (e.g., DHS and Multiple Indicator Cluster Surveys) has been particularly helpful for this purpose. However, many countries still have information only for global malnutrition (i.e., prevalence of low weight-for-age), which is insufficient to accurately reflect nutritional problems in countries. At this time, no single indicator of nutritional status can adequately reflect the complex problem of poor nutrition. It is unlikely that any single indicator will ever be sufficient to reflect long and short term overall adequacy of dietary intake and the sufficiency of micronutrient intake in individuals or populations. Multiple indicators are needed to reflect both the adequacy of food intake (e.g. height and weight) and its quality (nutrient content of foods or biochemical indicators of micronutrient status).
MEASURES OF OVERNUTRITION AND OBESITY7
Ricardo Uauy, University of Chile
Ricardo Uauy began his presentation with a set of photographs illustrating the problem of using just weight or a Body Mass Index (BMI) to determine overnutrition or obesity in adults. He explained that the location where fat is stored, in the abdomen or not, is more important than weight by itself. Abdominal fat (belly fat) is associated with changes in lipid metabolism leading to higher levels of LDL cholesterol (bad cholesterol), lower levels of HDL cholesterol (good cholesterol) and higher levels of sugar in the blood, these changes result in increased risk of heart disease and diabetes respectively. Alternatively if fat is stored in other parts of the body buttocks; it is less harmful. A BMI is calculated solely on the basis of height and weight and therefore is not a direct measure of body fat, nor does it indicate where the fat has been deposited (as illustrated in Figure I 1-2).
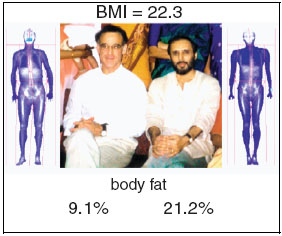
FIGURE I 1-2 BMI and percent body fat.
SOURCE: The Lancet 363, January 10, 2004.
Furthermore, Uauy stated, standard cutoffs, such as a BMI greater than 25 to indicate elevated risk associated with overweight, may not be appropriate in all countries. A lower value (e.g., 23 rather than 25) might be more appropriate in many Asian countries, since these populations have increased metabolic complications when the BMI exceeds this value.
While the use of BMI is not a perfect indicator, it is useful in assessing long term consequences of overnutrition and obesity. Data suggest that in all regions of the world there have been very significant increases in BMI levels, with slightly higher increases for women
____________
7 The presentation is available at http://sites.nationalacademies.org/PGA/sustainability/foodsecurity/PGA_060826, presentation by Ricardo Uauy (February 16, 2011).
than for men. The highest rates of obesity (BMI over 30) occur in the United States and in Oceania, with rates of obesity reaching 30 percent of the U.S. population in 2009. Uauy noted that WHO did not recognize obesity as a public health problem until the late 1990s, but it is now widely seen as a critical public health issue in developed and many developing countries.
Uauy also discussed some of the specific challenges associated with childhood malnutrition. He explained that often stunted children who are short and underweight for age but not underweight for their height are given supplementary food in an attempt to make them grow. However, if this increased energy intake does not contain sufficient micronutrients, children gain weight in excess of normal for their height, leading to obesity and “metabolic syndrome” when they reach adulthood. He noted that the government of Mexico is addressing the problem of undernutrition in the right way, providing high levels of micronutrients and only 10-20 percent of daily energy needs in its supplemental feeding program.
In conclusion, Uauy emphasized some of the short comings in the BMI measures, but he maintained that the survey data used to measure the BMI were strong and that what we need now are measures of physical activity that could be used in conjunction with the BMI to assess long term health risks. Abdominal circumference can be used as a reasonable proxy for metabolic
alterations associated with metabolic syndrome. The possibility of documenting the blood changes in lipids and sugar in a sub-sample of the population may be considered if resources are available.
Shahla Shapouri, U.S. Department of Agriculture, and Adelheid Onyango, World Health Organization
Shahla Shapouri and Adelheid Onyango began the general discussion. Shapouri talked about the need to have information on food stocks in use and not to treat stocks as a residual. She explained that there appear to be significant discrepancies between calories per capita using food balance sheets versus household surveys. She emphasized the need for policy makers to have access to timely data to understand the impacts of food price rises on food security for different population groups (e.g., urban versus rural, net producers versus net consumers, etc.). She noted that all measures of global hunger are estimates and thus can be challenged. Shapouri suggested that it is necessary to have a balanced approach, recognizing the trade-offs between perfecting
the data and methodology and providing timely data for policy makers. She also stated that there are a lot of additional data being generated by the UN World Food Program and the U.S. Agency for International Development (USAID) Famine Early Warning Systems. Network that could supplement the FAO data, providing more comprehensive data to policy makers.
Onyango explained the long term importance of child nutrition, noting that in the first 2 years, growth is sensitive to nutrient intake and infections, and this period is the critical “window of opportunity” to intervene to prevent malnutrition. By age 2-3 years, stunting (deficit in attained height) has happened, and reversal is extremely difficult thereafter. Early stunting is also
associated with life-long negative consequences, such as poor cognitive development, school performance, reproductive capacity, and economic productivity at adulthood.
Countries have been most successful at monitoring underweight because the equipment is the most accessible and the skills required are easily attained. However, in populations with high stunting prevalence, the normalization of weight-for-age happens when stunted children become overweight. This carries serious implications for chronic diseases (e.g., starting at school age, metabolic syndrome).
WHO recently published a set of key indicators that are now subject to public review, shown in Box I 1-2:
BOX I 1-2
Key Indicators
Outcome indicators: Low birth weight; malnutrition derived from anthropometry in under 5 children, 5-19 year old children/young adults, women of reproductive age, obese adults), anemia in women of reproductive age, etc.
Process indicators of program implementation: Infant and young child feeding indicators, Baby-friendly Hospital Initiative, immunization coverage, vitamin supplements to children under 5 years of age, iodized salt consumption, access to treatment and ready-to-use therapeutic food for children with severe acute malnutrition.
Food security indicators: Dietary energy intake, measures of dietary diversity, measures of household expenditure on food, poverty headcount ratio at $1.25 a day.
Policy environment indicators: International code of marketing breast milk substitutes, strength of nutrition governance (very soft), staff with nutrition skills at different levels of service delivery.
SOURCE: http://www.who.int/nutrition/EB128/en.
Unfortunately, data for these indicators are often lacking or are unreliable, but it would be useful to have them to answer the variety of questions and interests that policy makers may have, including the following:
- The impacts of investments in human capital on food security, poverty, and nutritional status
- Monitoring trends in different nutrition problems in nations or in areas of endemic micronutrient malnutrition
- Forecast of future nutrition-related chronic diseases that have important implications in terms of economic and healthcare costs
- Feasibility and cost implications are often the factors that weigh most on decisions to collect and analyze the data to generate these indicators.
Emmy Simmons noted that the FAO indicators are “supply driven,” when what is needed are systems that are more “demand driven,” that is, designed to meet the needs of policy makers at national and subnational levels. Participants also discussed the importance of developing better quality national level data—a key input to the global metrics as well as for assessing local conditions. A number of participants discussed the growing role of household surveys as a complement to food balance sheets and other data used for food security indicators. It was noted that it would be useful to make such surveys more comparable across countries. At the same time, some participants expressed concern about the long term “sustainability” of these surveys given expected reductions in donor budgets used to fund many of them, such as the USAID funded Demographic and Health Surveys.
Marie Ruel made a point about the so called Asian enigma—high levels of underweight or malnourished children despite substantial economic growth in recent years. She noted that the Asian enigma has been described as a problem largely due to the women’s poor physical and social status in some Asian countries, which results in small mothers giving birth to small babies (who suffer from malnutrition in the womb), who then are exposed to unsanitary environments and sub-optimal feeding practices and care during early infancy (mothers may have insufficient breast milk or milk of inadequate quality due to malnutrition, and may lack the means to purchase adequate complementary foods for their young children). These factors are compounded by social norms that may lead to girls being less likely than boys to be fed adequately or to be taken to preventive or curative health care services and less likely to go to school and by girls being likely to marry and start having children during adolescence (which affects their own growth and health). All these factors lead to a cycle of poor physical growth and ill health transmitted from one generation to another, which is unlikely to be resolved by economic growth alone and requires specific actions to enhance women’s social status, decision-making power, and access to?and control over?resources.
Hartwig de Haen and other participants stressed the need for making data and indicators more widely available, possibly creating a portal with an on-line inventory. Over the long term the improved transparency and accessibility could lead to improvements in national level data and provide possibilities for more research and quantitative analysis.
Senauer
Muth, M. K., S. A. Karns, S. J. Nielsen, J. C. Buzby, and H. F. Wells. 2011. Consumer-Level Food Loss Estimates and their Use. The ERS Loss-Adjusted Food Availability Data. Technical Bulletin 1927. Washington, DC: USDA Economic Research Service.
Smith, L. 1998. Can FAO’s measure of chronic undernourishment be strengthened? Food Policy 23(5):425-445.
Svedberg, P. 1999. 841 Million undernourished? World Development 27(12):2081-2098.
Neufeld
Arimond, M., C. Hawkes, and M. T. Ruel. 2011. Agricultural interventions and nutrition outcomes: lessons from the past and new evidence. Combating Micronutrient Deficiencies: Food-based Approaches:41-75.
Caulfield, L. E., M. de Onis, M. Blossner, and R. E. Black. 2004. Undernutrition as an underlying cause of child deaths associated with diarrhea, pneumonia, malaria, and measles. American Journal of Clinical Nutrition 80:193-198.
Kerac, M., H. Blencowe, C. Graijalva-Eternod, M. McGrath, J. Shoham, T. J. Cole, and A. Seal. 2011. Prevalence of wasting among under 6-month-old infants in developing countries and implications of new case definitions using WHO growth standards: a secondary data analysis. Archives of Disease in Childhood doi:10 (1136/adc)191882.
Khashan, A. S., and L. C. Kenny. 2009. The effects of maternal body mass index on pregnancy outcome. European Journal of Epidemiology 24(11):697-705.
Nandy, S., M. Irving, D. Godron, S. V. Subramanian, and G. D. Smith. 2005. Poverty, child undernutrition and morbidity: new evidence from India. Bulletin of the World Health Organization 83(11):210-216.
Rose, S. A. 1994. Relation between physical growth and information processing in infants born in India. Child Development 65(3):889-902.
Tomkins, A. 2000. Malnutrition, morbidity and mortality in children and their mothers. Proceedings of the Nutrition Society 59:135-146.
United Nations. 2010. The Millennium Development Goals–Report 2010. New York: United Nations.
WHO (World Health Organization) Multicentre Growth Reference Study Group. 2006. WHO child growth standards: length/height-for-age, weight-for-age, weight-for-length, weight-for-height and body mass index-forage: methods and development. Geneva, Switzerland: WHO:312.
WHO/CDC (Centers for Disease Control and Prevention). 2007. Assessing the Iron Status of Populations, 2nd edition. Geneva, Switzerland: WHO.
Uauy
WHO Expert Consultation. 2004. Appropriate body-mass index for Asian populations and its implications for policy and intervention strategies. The Lancet 363:157-163.
This page intentionally left blank.


