
MEASURES OF NATIONAL AND GLOBAL POVERTY AND THEIR USE IN POLICY MAKING: WORLD BANK POVERTY MEASURES1
Martin Ravallion, The World Bank
Martin Ravallion described the World Bank’s approach to measuring global poverty, explained the progress that had been achieved in various parts of the world to reduce poverty, and then discussed some the challenges ahead. He explained the difficulties inherent in defining a single global measure of poverty. He added that most of the World Bank’s poverty measurement and analysis activities are, in fact, done at a country level to inform local government policies and programming decisions by the World Bank.
He noted that it is difficult to talk meaningfully about global income poverty, since poverty lines across countries vary in terms of their purchasing power, and there is a strong economic gradient with richer countries adopting higher standards of living for defining poverty. In the poorest countries, poverty lines tend to reflect “absolute poverty,” with minimal requirements for food and non-food needs. In richer countries they reflect a measure of “relative poverty,” with more generous allowances for consumption needs; these lines are often set at some percentage of the country’s mean or median income.
Ravallion explained that the $1 a day global poverty measure was an attempt to measure poverty in the world as a whole and to assure that two people with the same purchasing power over commodities are treated the same way even if they live in different countries. He suggested that focusing on the standards of the poorest countries gives a salience to the world’s poorest people that would not exist if higher poverty lines were used.
Based on the World Bank’s level poverty assessments and the results of the 2005 international comparison project, new poverty rates were recalculated. Overall the percentage of people falling below a poverty line of $1.25 a day was halved between 1981 and 2005 from 52 to 26 or a numerical decline from 1.9 billion to 1.4 billion (Figure I 2-1). However, there are stark regional differences, with huge progress in China and substantial progress in India. Poverty rates have also fallen in Latin America, the Caribbean, the Middle East, and North Africa; however, the total numbers of those in poverty in these regions have not declined. And in Eastern Europe
____________
1 The presentation is available at http://sites.nationalacademies.org/PGA/sustainability/foodsecurity/PGA_060826, presentation by Martin Ravallion (February 16, 2011).
and Central Asia, poverty rates and numbers of poor people have increased, although there have been signs of progress since the late 1990s.
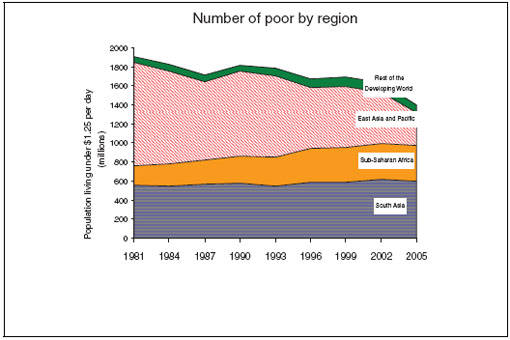
FIGURE I 2-1 The regional picture: Uneven progress.
SOURCE: Presentation by Martin Ravallion, The World Bank, February 16, 2011.
The situation in Sub-Saharan Africa stands out with little change in poverty rates and substantial increases in the number of people deemed poor using the $1.25 a day poverty line for 1981–2005. The number of poor has almost doubled between 1981 and 2005, increasing from 200 million to 380 million. Furthermore, Ravallion noted that there is a greater depth of poverty in Sub-Saharan Africa, with the mean consumption of the poor estimated at only 70 cents a day, making it the lowest in the world. However, he also noted that there have been encouraging signs of greater progress against poverty in Africa since the mid-1990s.
Challenges Ahead
Household surveys. During the last 10 to 20 years, there has been a huge expansion in the coverage of household surveys, expanding from just 22 countries in 1990 to 116 countries in 2011. Coverage is especially good in East Asia, South Asia, Eastern and Central Europe, and Latin America, but lagging in the Middle East and North Africa and Sub-Saharan Africa. Furthermore, in the Middle East and North Africa region there is no public access to the data,
unlike in other regions. Despite the increase in coverage, there are continued concerns about lags in data availability and public access, comparability over time and across countries, and underreporting and selective compliance.
Ravallion explained that market exchange rates generally are not useful in assessing real incomes in developing countries, in that they tend to equate purchasing power with traded goods. Therefore the International Comparison Project has developed more realistic estimates of purchasing power parity exchange rates. The latest ICP data were released in 2005 with a new one scheduled for release in 2011. Despite improvements in the ICP process since the 1970s, serious issues remain in that they tend to be urban biased under representing rural areas, which is a particular concern in China, where only 11 cities were surveyed.
Ravallion also discussed the arguments in favor of relative poverty lines. He noted that many Organization for Economic Cooperation and Development countries have relative poverty lines, that is, a fixed proportion of the country’s mean or median income. He suggested that one way to allow for relative poverty is to have a poverty line that is constant at very low incomes?representing absolute poverty—and then increasing at somewhat higher incomes.
Ravallion concluded by noting that in most instances there is no need to form a single composite poverty index that includes data on nutrition, child mortality, schooling, and violence, as these indicators are too disparate to combine into a single measure. The ultimate goal should be to create a set of multiple indexes that looks at these non-consumption factors and can usefully guide policy makers, rather than develop a single multidimensional index.
OXFORD MULTIDIMENSIONAL INDEX2
James E. Foster, The George Washington University
James Foster described the recently released Oxford Multidimensional Poverty Index (MPI). He explained that this type of index was needed because conventional measures of poverty capture only an income or consumption dimension of poverty, when in fact there are many other aspects of poverty. He suggested that such a measure must be understandable and easy to describe as well as conform to common-sense notions of poverty. It must also be technically solid and data must be available. While such indexes have been talked about for some time, one impetus for the new index came from Mexico, where a government law mandates that poverty be measured multidimensionally.
The new index provides a dual cutoff approach to measuring poverty. Within each dimension there is a deprivation cutoff, and then across the dimensions there is a poverty cutoff. That is, if someone is deprived in enough dimensions or in enough breadth, they are considered poor. Foster described the approach as being intuitive, transparent, and flexible. He emphasized its use in country applications, where one can target and evaluate policies. He also said that it was participatory, in that country stakeholders could determine cutoff and weights rather than having a one-size-fits-all index. The three specific dimensions included in the MPI are education, health, and standard of living, and there are 10 associated indicators (Box I 2-1).
____________
2 The presentation is available at http://sites.nationalacademies.org/PGA/sustainability/foodsecurity/PGA_060826, presentation by James Foster (February 16, 2011).
BOX I 2-1
Multidimensional Poverty Index Indicators
Education (Each indicator is weighted equally at 1/6)
- Years of Schooling: Deprived if no household member has completed 5 years of schooling
- School Attendance: Deprived if any school -aged child is not attending school in years 1 to 8
Health (Each indicator is weighted equally at 1/6.)
- Child Mortality: Deprived if any child has died in the family Nutrition: Deprived if any adult or child for whom there is nutritional information is malnourished
Standard of Living (Each indicator is weighted equally at 1/18.)
- Electricity: Deprived if the household has no electricity
- Drinking Water: Deprived if the household does not have access to clean drinking water or clean water is more than 30 minutes walk from home
- Sanitation: Deprived if they do not have adequate sanitation or if their toilet is shared
- Flooring: Deprived if the household has a dirt, sand, or dung floor
- Cooking Fuel: Deprived if the household cooks with wood, charcoal, or dung
- Assets: Deprived if the household does not own more than one of the following: radio, TV, telephone, bike, motorbike, or refrigerator, and does not own a car or tractor
SOURCE: http://www.ophi.org.uk/wp-content/uploads/MPI-One-Page-final.pdf.
Marco Ferroni opened the panel discussion, encouraging participants to focus on four key issues:
- How important are global numbers for hunger, malnutrition, and poverty? For whom?
- Do measures of poverty, food security, and malnutrition move in the same direction? If not, why not? Is this a problem with the measures or does it highlight more complex issues?
- Are numbers comparable between countries and over time?
- What information do decision makers really need and for what?
Stephan Klasen began the session by focusing on three points. First he noted that the $1 a day measure of global poverty is not a direct measure of food or nutritional security. In fact, the relation between income and nutrition is not clear. Second, the dollar a day measure was revised upward in 2005 resulting in dramatic increases in poverty in both China and India despite substantial economic expansion in both countries. He noted that this may have been the result of changes in the way purchasing power parity numbers were calculated rather than any real change in poverty rates. Third, he suggested that poverty measures and food security measures are closely related at a country level, even if they are not at a global level. That is, national level poverty lines are often nutritionally based. In addition, Klasen suggested that if there was enough trust in the data generated through household surveys it would be possible to actually compile a more accurate global poverty number?basically, the sum of the country level numbers. Even in this case, though, such a measure does not reflect intrahousehold issues, that is, how food supplies are allocated within a household. This is an important consideration, in that we can often find malnourished children in a household with well nourished adults. Klasen also talked about the usefulness of the MPI in shifting discussions about poverty beyond simply income and consumption. He noted that it was easy to criticize the MPI?how the weights were chosen, cutoff points, aggregations, and even what was included?but it has started a valuable debate.
Martin Ravallion added that he agreed that poverty is multidimensional, but argued against a single index, suggesting that a composite index masks the real data that are needed to take action and that one of the first things a decision maker is likely to do with the MPI is to unpack the data.
Workshop participants discussed household surveys and the extent to which they could be made more comparable across countries and the degree to which these surveys could be expanded to include questions on food security and nutritional status. While some participants suggested that the surveys should be expanded, Ravallion stressed the need to identify a basic core set of data requirements that can be implemented well in all developing countries, with the possibility of conducting other more specialized ad hoc surveys.
Other participants suggested that it might be possible to more directly link poverty and nutrition measures in household surveys, but that it would require substantially increased training for the enumerators and that in some countries?India and China were specifically mentioned— it would be very difficult, as the survey instruments are already considered too long and response rates are declining sharply, limiting the usefulness of the survey data. Lynnette Neufeld suggested that it was important to understand what the indicators would be used for in order to determine local priorities. Rather than try to stretch a survey or multiple surveys and expect that they will be used in the same manner across all countries, she said that data requirements need to be based on a clear understanding of the national policies and decisions that will be driven by the data.
Other workshop participants expressed concern about the timeliness of the poverty data and the inability to measure transitory poverty, both critical inputs for policy makers.3
____________
3 An extensive bibliography of articles assessing an array of global poverty measures is included at the end of Part I of the report.


