
NATURAL RESOURCES AND AGRICULTURAL PRODUCTIVITY
Chapters 1 and 2 looked at metrics related to the demand side of food security?poverty and food consumption and outcome measures. This chapter changes course and looks at supply-side aspects of sustainable food security, summarizing presentations and discussions about measuring agricultural productivity and natural assets, examining composite indicators for sustainable production and natural resource use, and the effect on the environment of achieving food security.
MEASURING AGRICULTURAL PRODUCTIVITY AND NATURAL ASSETS
This first section examines a variety of metrics associated with changes in agricultural productivity and natural assets. Richard Perrin describes two standard productivity measures— single and multiple factor productivity and then links these to projects of future food demand to illustrate the extent to which productivity must expand in the coming decades. A second presentation links spatially explicit measures of agricultural productivity and eco-system services. Steve Polasky then describes approaches to measure changes in the value of eco-system services resulting from land use changes. The final presentation talks about various metrics associated with the supply and use of water resources for agriculture.
APPROACHES FOR MEASURING PRODUCTIVITY AND NATURAL ASSETS PRODUCTIVITY METRICS VERSUS FOOD SECURITY1, 2
Richard K. Perrin, University of Nebraska–Lincoln
Productivity
Richard Perrin explained that the basic definition of productivity is output divided by input. He noted that the growth of productivity is more important than any particular level itself. Single-factor productivity, such as tons of wheat per hectare, is conceptually straightforward. A more comprehensive measure is multiple-factor productivity (MFP), defined as an index of
____________
1 Prepared jointly with Lilyan E. Fulginiti, University of Nebraska–Lincoln.
2 The presentation is available at http://sites.nationalacademies.org/PGA/sustainability/foodsecurity/PGA_060826, presentation by Richard Perrin (February 16, 2011).
outputs over an index of inputs. MFP is complex and subject to many different measurement approaches. The productivity numerator includes only measurable outputs that contribute to human welfare, and the denominator considers only measureable inputs that we think are important.
Productivity growth can help gauge progress toward future food security, given the limited potential for increasing resources. For the food producing sector, Perrin noted, these basic resources include land, water, and natural resources and critical factors such as climate and ecological resilience. The supply of other inputs, including labor and chemicals, seems to be in sufficiently elastic that they would not hinder food security in the future. It is the basic resource productivity that will matter.
Growth in Food Demand versus Growth in Productivity
Comparing projected growth in food demand with growth of productivity is one useful way to frame the issue of food security. A commonly accepted estimate of the increase in food demand by 2050, developed by the United Nations Food and Agriculture Organization (FAO), is 70 percent (Table I 3-1).
TABLE I 3-1 World Food Demand Growth, 2010-2050
| Source of Growth | Total Increase (%) | Annual Rate of Increase (%) |
| Population growth | 32 | 0.7 |
| Income growth | 38 | 0.8 |
| Total increase | 70 | 1.34 |
SOURCE: Presentation by Richard Perrin, University of Nebraska–Lincoln, February 16, 2011.
Conceptually, a productivity growth rate of 1.34 percent is not a necessary condition for achieving the 70 percent goal. But this growth rate implies that 70 percent more could be produced by 2050 with the current resources devoted to agriculture. If the growth rate were lower, additional resources would be required if demand growth were to be met.
Trends in Measured MFP versus a Goal of 1.34 Percent
World agricultural productivity growth rates, both single factor productivity (grain yields) and multifactor productivity have been relatively stable for the past 15 years, at a rate very near the 1.34 percent goal. Though the MFP growth rate has increased since the 1960s, the rate of growth for grain yields has declined since the 1960-1980 period, as shown in Figure I 3-1.
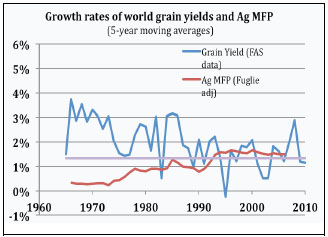
FIGURE I 3-1 Crop yields versus MFP—world.
SOURCES: Authors’ calculations from USDA FAS data, Fuglie (2008).
If the 1.34 percent growth target for productivity alone is not met, additional resources will be required. Such resources can be attracted into agriculture only if food prices rise, jeopardizing food security for some. Growth trends for cropland and irrigation do not encourage optimism for new resources.
Conclusions
Perrin stated that world agricultural productivity growth rates are perhaps declining slightly, but in recent years they appear to have been sufficient to provide security in 2050 if they were to persist. He also noted that it is not certain that these rates will persist, and unfortunately, the available measures of MFP are not measures of the productivity of those resources that are most likely to be limiting—land, water and natural resources.
EXPANDING AGRICULTURAL PRODUCTIVITY MEASURES AND LINKING TO ECOSYSTEM SERVICES—A SPATIALLY EXPLICIT APPROACH3
Stanley Wood, International Food Policy Research Institute
Stanley Wood described a new project, HarvestChoice,4 which is developing a set of spatially explicit measures of agricultural productivity and ecosystem services, as well as indicators of poverty and hunger. The goal of the project is to examine the links between hunger, poverty, and agricultural productivity measures and ultimately to improve long-term agricultural productivity, increasing human welfare. The project focuses on Sub-Saharan Africa and South Asia, where productivity increases have stagnated over the past decades.
Wood described some of the key variables included in the project, beginning with the agricultural base: slope, aspect, drainage, and elevation; location of settlements, ports, and markets; and basic infrastructure, such as roads and information and communications technology. This layer is then overlaid with data on the incidence of pests and diseases as constraints to agricultural productivity and the incidence and severity of droughts and surface runoff. This collection of data provides a way of understanding and characterizing the production environment, which can then be combined with data illustrating the biophysical suitability of different types of crops.
The project also includes detailed information on the location and extent of human welfare metrics, which can be analyzed together with the agricultural productivity information described above. Wood showed a map of Africa illustrating the extent to which rising rural population density is increasing stress on critical natural resources (Figure I 3-2).
In summary, he noted that spatially explicit variables have a key role to play in understanding the where and why of hunger, poverty, and productivity measures. They provide a way to understand the interplay of human welfare, agricultural production, and ecosystem services as well as to evaluate specific interventions.
Wood acknowledged that there are a number of spatial data issues. For example, maps give the illusion of precision and accuracy, and the reliability of remotely sensed data is not always strong. However, the data may be good enough—fit for the purpose of strengthening the evidence base to make key decisions.
____________
3 The presentation is available at http://sites.nationalacademies.org/PGA/sustainability/foodsecurity/PGA_060826, presentation by Stanley Wood (February 16, 2011).
4 Funded by the Bill and Melinda Gates Foundation and conducted by the Institute for Food Policy Research (IFPRI) and the Center for International Science and Technology Practice and Policy at the University of Minnesota.
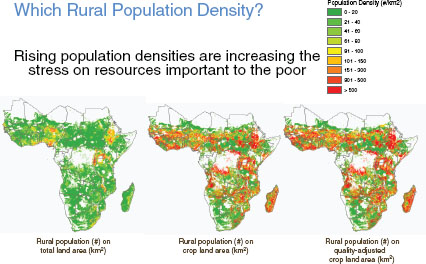
FIGURE I 3-2 Which rural population density?
NOTE: White-masked areas include inland water bodies, protected areas, urban areas, irrigated areas, closed forest, and land not suited for pasture or rainfed crops.
SOURCE: HarvestChoice, 2010.
MEASURING PRODUCTIVITY AND NATURAL ASSETS: MEASURING AND VALUING NATURAL ASSETS5
Stephen Polasky, University of Minnesota
Steve Polasky explained that ecosystems, including agricultural systems, provide a wide variety of goods and services to people. Examples include food, water quantity and quality, carbon sequestration, recreation, and aesthetics. Land use and land management decisions result in both intentional and unintentional affects on the bundle of services provided. However, these effects are generally not factored into decision making, because monetary values are not assigned to most ecosystem services. This can result in the loss of services valuable to the environment and human society. He stressed the importance to sustainability of being able to make good decisions about future land use and the need to look at trade-offs. He noted that relying on the market system is not sufficient; it is necessary to pay attention to ecosystem services that are not valued in the market place. Furthermore, the ecological data necessary to value ecosystem services are very limited.
____________
5 The presentation is available at http://sites.nationalacademies.org/PGA/sustainability/foodsecurity/PGA_060826, presentation by Steve Polasky (February 16, 2011).
Polasky described activities undertaken through the Natural Capital Project’s InVEST6 to develop a set of tools integrating the value of ecosystems services and highlighting potential trade-offs. The tool is based on a set of computer-based models, including biodiversity and other ecosystem services. It is spatially explicit and driven by future scenarios. It is also flexible and transferable. Polasky noted that the tool is data intensive and that ecological data are limited. He remarked that eco-data collection is much less advanced than the poverty and nutrition data cited in the earlier workshop sessions.
The InVEST tool has been used in Minnesota to compare impacts on ecosystem services and biodiversity from actual changes in land use between 1992 and 2001 with alternative scenarios. For example what would have been the likely impacts if there was no agricultural expansion or urban expansion etc. The analysis focused on the following: ecosystem services— water quality and carbon sequestration; biodiversity—grassland bird habitat, forest bird habitat, and general biodiversity; and return to landowners from agricultural production, timber production, and urban development. He presented a series of slides illustrating how alternative land-use scenarios affect each of these key variables and the need to have a complete set of metrics (e.g., Figure I 3-3).
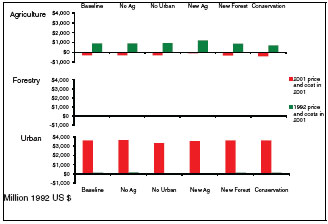
FIGURE I 3-3 Change from 1992 to 2001 by scenario: Market returns to agriculture, forestry, urban areas.
SOURCE: Presentation by Steve Polasky, University of Minnesota, February 16, 2011.
In summarizing the presentation, he noted that incorporating the value of ecosystem services in land use decisions can result in a higher level of services being provided as well as a higher value of total goods and services. He also noted that agricultural land use changes have a far bigger effect on ecosystem services and biodiversity than do changes in urban land use.
____________
6 See http://www.naturalcapitalproject.org/InVEST.html. Accessed on March 30, 2011
WATER, AGRICULTURAL PRODUCTIVITY, AND ENVIRONMENTAL SERVICES7, 8
Peter G. McCornick, Duke University
Peter McCornick stated that food security is inherently dependent on the availability of water resources, whether it is reliable rainfall (green water) or irrigation from surface or groundwater sources (blue water). Competition for water from urban areas, industry and higher value agricultural products will require that lower value, staple crop production rely more heavily on rainfall or depend increasingly on less reliable blue water sources or both. Projected population growth, expanding demand for a diet higher in animal products and fish, and the increased need for non-food crops, including those for bioenergy, will continue to increase the demand for water from agriculture. McCornick noted that the quantity of water from rainfed and irrigated sources required by the agricultural sector is expected to as much as double by 2050, further disrupting ecosystems.
Agricultural Water Productivity
To achieve food security and yet mitigate the negative effects on water resource systems requires that water productivity be increased. However, saving water is not enough if there is not a system for allocating it appropriately to achieve both productivity objectives and distributional objectives. Therefore, effective governance systems and institutions must be developed. Not all water apparently saved can be reallocated. Moreover, McCornick stated that effective governance mechanisms are required to reallocate any gains that are made.
Trade-offs and Scale
McCornick explained that the rice-wheat systems in the Indus and Ganges basins provide an example of intensified use, trade-offs, and unintended consequences. The yields in the relatively water short Punjab portion of the basin are already high. Efforts to improve water conservation in this area through various water resource conservation technologies (i.e. zero tillage for wheat, direct seeding, bed planting, laser land leveling and crop residue management) improved the field level water productivity. However, this “saved” water at the field scale resulted in the expansion of irrigated crop-land in the immediate area, while the available supply downstream declined highlighting the potential for unintended tradeoffs, especially critical in increasingly water scarce basins in the developing world, such as the Indus.
Food security is a function of water security, especially in terms of water availability and reliability. Disrupting this relationship are flood and drought events, which are expected to become more frequent and severe as agricultural production expands and intensifies in flood
____________
7 Prepared in collaboration with David Molden, Deputy Director General of Research, International Water Management Institute, Colombo, Sri Lanka.
8 The presentation is available at http://sites.nationalacademies.org/PGA/sustainability/foodsecurity/PGA_060826, presentation by Peter McCornick (February 16, 2011).
prone areas, while other regions suffer from a paucity of rainfall. Climate change further complicates the situation. Decision making related to food security must carefully consider water resources, especially to identify regions where there is the opportunity to increase agricultural productivity without further stressing water resources (i.e., more crop-per-drop). McCornick noted that this is especially critical in an increasing number of major agricultural producing areas, where water is already relatively scarce. While most experts are optimistic that there is scope for water productivity gains, such gains are difficult to realize and require a holistic view of water management. Water allocation and reallocation processes are required in addition to farm scale practices to realize gains of water productivity. To mitigate these consequences, an essential tool in food security enhancement is accounting for water resources and management, including actual water use in irrigated and rainfed areas, and the impact on available water resources downstream. Unfortunately, many of these challenged regions are relatively data scarce, the quality of information that does exist varies, and many of the data sets have been developed as part of specific projects and are often not accessible at the national and sub-national scales, which are crucial to water related decision making. Fortunately, technological advances are presenting opportunities to better assess crop water use and groundwater levels.
Hartwig de Haen began the discussion by questioning the extent to which agricultural productivity must be increased in order to meet increases in population and food demand by 2050. He suggested that some of the assumptions underlying the projection that would require a 70 percent increase in production of food and feed would depend on other factors and drivers of total future need for agricultural commodities. For example, he questioned whether future food consumption trends will include increasing shares of animal protein as in recent years, whether the amount of crops used for non-food uses such as biofuels will continue to grow, and whether levels of post harvest losses and excessive food use will continue. He suggested that scenarios should also be considered to explore the implications if these assumptions shifted: The required production increases could be lowered, and the stress on natural resources could be reduced. Bill Jury encouraged the group to consider long term demographics changes, such as increases in urban populations in attempting to assure sufficient food supplies where they are needed.
Phil Pardey noted that the discussion on metrics for poverty and food security was retrospective, not spatial and not forward looking, whereas the discussion on agricultural productivity was forward looking and spatial.
COMPOSITE INDICATORS FOR SUSTAINABLE PRODUCTION
The panel examined composite indicators for sustainable production and natural resource use and reviewed their use in promoting sustainable practices and in providing information to consumers and policy makers.
OVERVIEW OF METRICS AND INDICATORS, DIFFERENT APPROACHES, AND STRENGTHS AAND WEAKNESSES9
Greg Thoma, University of Arkansas
Greg Thoma provided a brief description of some of the agricultural sustainability metrics currently available. He explained that sustainable agriculture can be defined as (a) meeting the needs of the present while enhancing the ability of future generations to meet needs, (b) increasing productivity to meet future food demands, (c) decreasing harmful effects on the environment, (d) improving human health, and (e) improving the social and economic well-being of agricultural communities.10 However, the definition is not tied to any specific metrics and therefore does not provide a basis for action. He suggested that it is necessary to measure the
outcome of agricultural production in order to reduce environmental impacts. He identified a set (not exhaustive) of variables critical to understanding agricultural systems, which are listed in Table I 3-2.
TABLE I 3-2 Examples of Agricultural Sustainability IndicatorsCategory
| Category | Emissions | Drivers | |
| Water Quality | Nutrients Ammonia | Livestock: | |
| Sediments Metals | Manure management & application | ||
| Pesticides Hormones | Storm water management | ||
| Antibiotics Pathogens | Land management (tillage, etc) Crop protection and fertilization | ||
| Water Use | Groundwater scarcity | Livestock: | |
| Reduced stream flows impact aquatic habitats | Drinking water and facility maintenance Irrigation | ||
| Air Quality | Particulate matter (1° & 2°) | Manure management | |
| Odor | Animal emissions | ||
| Ozone precursors | Combustion | ||
| Greenhouse gasses | |||
| Land Use / Biodiversity |
Land occupation and conversion Habitat degradation / fragmentation | Land management (Tillage, riparian zone management, etc.) |
|
| SOURCE: Presentation by Greg Thoma, University of Arkansas, February 17, 2011. | |||
Thoma then explained that these metrics need to be built into a framework that will help in understanding the broader agricultural system as well as impacts and trade-offs. One such framework or tool is life cycle assessment. This allows us to (a) think broadly from cradle to next life; (b) think deeply about the impacts and endpoints; (c) think quantitatively throughout the
____________
9 The presentation is available at http://sites.nationalacademies.org/PGA/sustainability/foodsecurity/PGA_060826, presentation by Greg Thoma (February 17, 2011).
10 As defined by the Keystone Alliance: Field to Market.
supply chain, accounting for inputs, outputs, and emissions; and (d) think comparatively to understand expectations and make a positive change. He noted that life cycle assessment is a useful but far from perfect tool, in part because it does not yet include spatial or temporal dynamics very well. He mentioned some newer tools, such as InVEST, that can assess the impacts of ecosystem services, but those methods are not yet ready for incorporating into life cycle assessment
Thoma provided a brief overview of some ongoing efforts to develop sustainability metrics, sustainability indicators, and software tools (Box I 3-1).
In conclusion, Thoma emphasized that sustainability metrics should be outcome based and technology neutral so that creative innovators can do whatever makes the most sense in their specific location. Life cycle assessment is a useful tool in that it provides information and understanding, enabling engagement of procurement officers and consumers so that market signals and incentive can be communicated to farmers and other primary producers.
BOX I 3-1
Ongoing Efforts
Sustainability Metrics (Quantitative)
- Field to Market—The Keystone Alliance for Sustainable Agriculture: Focuses on commodity agriculture; metrics are outcomes based and technology neutral; natural and regional in scale.
- Stewardship Index for Specialty Crops: Focuses primarily on vegetables and fruits; metrics are outcomes based and technology neutral; regional and local in scale.
- Solutions from the Land: Focuses on linking crop, forestry, and conservation land-management; metrics into a harmonized approach; sponsored by the United Nations Foundation, Conservation International, the Nature Conservancy, and the Farm Foundation.
Sustainability Indicators (Qualitative)
- Unilever Sustainable Agriculture Code: Mandatory program for Unilever agriculture suppliers; for example, it requires recordkeeping for pest and nutrient management; some simple metrics are included.
- SAI Platform: Focuses specifically on agriculture; provides guidance on best management practices; more practice than outcomes driven.
- People 4 Earth: Broadly looks at supply chains; uses more than 300 qualitative questions that span sectors other than agriculture.
Software Tools
BASF Eco-Efficiency Analysis; GaBi, SimaPro, SALCA (Swiss Agricultural Life Cycle Assessment); carbon footprint calculators (e.g., Cool Farm Tool); Fieldprint Calculator (Field to Market); Global Water Tool; InVEST; and HarvestChoice.
INDUSTRY PERSPECTIVE ON USE OF METRICS11
Jennifer Shaw, Syngenta
Jennifer Shaw noted that there is wide agreement that agricultural systems need to be sustainable to ensure long-term food security. The challenge, she said, is in trying to define and measure what this really means. For Syngenta, one of the most important sustainability initiatives in North America is Field to Market (FTM), a diverse stakeholder group facilitated by the Keystone Center in Keystone, Colorado. FTM represents organizations with a common interest in focusing on sustainable outcomes for production agriculture. The philosophy behind FTM is to (a) focus on a key set of outcomes, (b) establish science-based metrics for measuring progress against those outcomes, and then (c) “let the chips fall where they may.” With respect to technology, the initiative takes a neutral position, neither promoting nor obstructing it. The presence or absence of a given technology is not the key. The important thing is the performance of the whole system and the tool is being used to develop precise metrics to assess changes in agricultural systems. For example, “How are we doing today, and are we heading in the right direction?”
Field to Market Indicators of Sustainability
- Environmental Indicators
- Land Use
- Water Use
- Soil
- Energy
- Climate
- Water Quality
- Biodiversity
- Productivity Indicators
- Grower Economic Index
- Social Indicators
- Health Indicators
- Ability to Meet Global Demand
FTM has developed metrics for five of the environmental efficiency indicators listed above (energy, water, climate change, soil and land use/productivity). These metrics are being piloted in cropping systems across the United States. Syngenta has been part of this process.
____________
11 © 2011 Syngenta Crop Protection, LLC 410 S. Swing Road, Greensboro, NC 27409. The presentation is available at http://sites.nationalacademies.org/PGA/sustainability/foodsecurity/PGA_060826, presentation by Jennifer Shaw (February 17, 2011)
Guiding Principles and Urgency
Syngenta’s sustainability team is working with a set of key principles developed in collaboration with other stakeholders and growers. Important among these principles are that metrics should be:
- Science based & validated
- Transparent & open sourced
- Pragmatic & focused on what matters
- Value creating for the grower (must exceed the cost & disruption)
- Respectful of confidentiality
- Verifiable concerning improvements
- Not disruptive to efficient product movement & relationships
- Focusing on decisions in the control of the grower
- Recognizing & addressing land tenure relationships in creating incentives
- Phased & realistic
- Move with value creation, not in front of it
- Improve over time
The lack of certainty concerning metrics is beginning to hold up adoption both at the producer level and among downstream players. Producers do not know how to think about metrics: opportunity or threat? Downstream companies do not know what is possible: are significant improvements within supply chains really feasible? The path to resolving this uncertainty is not clear, but the urgency is growing.
Framework
Shaw described how Syngenta visualizes the sustainability journey in three basic steps (Figure I 3-4):
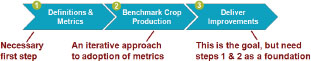
FIGURE I 3-4 Three basic steps for the sustainability journey.
SOURCE: Presentation by Jennifer Shaw, Syngenta, February 17, 2011.
The first and most important step is the establishment of definitions and metrics. After metrics have been developed and a degree of consensus forms among producers and downstream users, the next step will be to benchmark production regions.
The benchmarking process may take several years to compete. Both temporal and spatial variability will be significant. A broad view (many areas over multiple years) will likely be needed to develop a clear understanding of what really drives the system and how best to make meaningful improvements. Some “low hanging fruit” can be expected in the early years, especially in making efficiency improvements (e.g., less energy, water, carbon, etc. per unit). Other more complex metrics will take time to understand and interpret.
Insights from Sustainability Pilots
Shaw explained that Syngenta incorporated the FtM metrics into one of their leading on-farm management systems, Land.dbTM, and introduced the metrics to growers during the last growing season. The TLand.dbTM tool allowed growers to run scenarios with the FTM metrics, testing the impact of various cropping decisions on their environmental indicator score as it compared to neighbors as well as the state and national averages. They expressed great interest in this feature. Growers also liked having the metrics integrated with the farm management tool they had already deployed.

In addition, Shaw noted that the tool also highlighted previously non-obvious areas of potential improvement (e.g. energy associated with use of certain farm practices). Two major issues were also highlighted during the pilot process: (1) the time required to enter quality data were significant (3-4 hours per farm even when facilitated by an expert) and (2) the perception of value varied greatly among growers (significant suspicion exists about the future impact of the metrics, and data privacy was a prevalent & significant concern). Shaw stated that these issues will need to be addressed before things will move forward on a meaningful scale. Most importantly, strong grower incentives will need to be in place from the outset. The costs and potential disruption to the grower are significant. If value does not exceed costs, resistance can be expected.
Concluding Remarks
In summary, the important insights include:
- Leveraging existing systems and relationships are possible.
- Significant effort is required to gather data (esp. at field level).
- If readily usable, the FtM metrics would inform operational decisions on a routine basis (field by field).
- Aggregated data will help support the environmental benefit of certain production practices over time.
- Going forward, data can be used to support life-cycle inventories for crop production on a regional and local basis.
- Grower time & costs are significant—adequate incentives are essential.
- Many of the basic insights are likely applicable to other regions.
- Certainty around metrics is critical to get things moving.
EXPERIENCE ON GATHERING MEANINGFUL DATA FOR LIFE CYCLE ANALYSES: THE BASF ECO-EFFICIENCY TOOL IN INDIAN AGRICULTURE12
Dirk Voeste, BASF Crop Protection
Dirk Voeste presented details on how key indicators and data can be used to effectively measure sustainability over an entire life-cycle. He shared information gleaned from a unique case study carried out in India to assess soybean production.
While soybean is a key source of edible oil in India, overall productivity is low in comparison with the world average. Initiated in 2007 as a BASF farmer training project in the Indian Guna region, Samruddhi is a holistic business approach to help farmers and their communities to improve productivity and become more sustainable. The idea, Voeste said, is simple: educate farmers and demonstrate good agricultural practice, find ways to boost farm yields and profitability, show how product stewardship programs can be implemented, and offer hands-on advice. By 2009, over 100,000 farmers had successfully participated in the program.
To assess the sustainability impact of the Samruddhi program, BASF conducted a detailed Eco-Efficiency Analysis looking at two pillars of sustainability, namely, the economic and ecological factors. Voeste noted that some of the data also related to social aspects of sustainability. As he explained, the initial step in any such study is to set the correct system boundaries. In this case, boundaries for comparing Samruddhi with traditional farmer practice
____________
12 The presentation is available at http://sites.nationalacademies.org/PGA/sustainability/foodsecurity/PGA_060826, presentation by Dirk Voeste (February 17, 2011).
focused exclusively on the production of soybeans. The Eco-Efficiency Analysis included indicators on energy consumption, land use, resource consumption, emissions, toxicity potential, and occupational diseases and working accidents. The life-cycle assessment13 used average data points, collected from farmer surveys, eco-profiles from BASF proprietary and commercial databases, and farmer occupational risk data from an Internet search of publicly available information. Data on toxicity and eco-toxicity potential were sourced from Material Safety Data Sheets (MSDS) and additional factor calculations based on publicly available data sources.
In a study of this kind, for weighting purposes, the relevance of each indicator is fully assessed, using statistics and relevant data points from publicly available sources. Societal factors are then applied, gleaned from public polls and expert studies. To further illustrate the study results, the final report summarizes the main findings by showing each indicator as well as the relative impact of each indicator category, clearly represented through diagrams.
The results of this study, Voeste noted, validate that Samruddhi’s cultivation of soybeans is significantly more eco-efficient (greater than 5 percent) for both the economy and the environment, when compared to traditional farmers practices in India. The program delivered higher yields (double the Indian average), lower cultivation costs, and lower environmental impacts in comparison with traditional farming practices. Apart from water emissions and toxicity potential, Samruddhi scored better on all the key indicators?yield, cost, energy consumption, air emissions, land use, and risk potential to farmers. In terms of identifying measures to improve sustainability, the study indicated the negative potential of the fertilizer being used, which led to a search for a new solution. Voeste also acknowledged that there is scope for further yield improvement, as the soybean yield for Samruddhi still remains significantly lower than the world average.
At a macro level, the study demonstrated that it is possible to objectively measure sustainability. Importantly, a number of different parameters can be tested and the consequences assessed. Voeste emphasized that these scenarios are a very valuable methodology to support informed decision making and drive positive change towards an improvement in sustainable agriculture. While the study highlighted that BASF’s methodology had the potential to become a valuable decision tool for politicians and the entire food chain, the company also recognized the tool’s limitations. As Voeste pointed out, the current set of indicators in the Eco Efficiency Analysis, used for the Samruddhi study, do not support the measurement of biodiversity, specific soil indicators, or other indicators being of high importance for agricultural production systems. This has encouraged BASF to work on an enlarged indicator set specifically for applications in agriculture. The testing phase for the new method, called AgBalance, is nearly closed?BASF is currently running a first demonstrator study. Other studies will follow by summer 2011.
Voeste pointed out the critical importance of incorporating practical scenarios. He argued that this type of analysis highlights improvement potential and facilitates effective decision making. For credibility and acceptance, the tool has to be validated by recognized institutes as well as stakeholders.
____________
13 A life-cycle assessment (LCA) is a technique that is used to assess the environmental aspects and potential impacts associated with a product, process, or service, by: compiling an inventory of relevant energy and material inputs and environmental releases; evaluating the potential environmental impacts associated with identified inputs and releases, and interpreting the results to help people make more informed decisions. http://www.epa.gov/nrmrl/lcaccess. Accessed on June 6, 2011.
Voeste closed his presentation by outlining key points. In his view, the fundamental principle has to be science-based analysis. A holistic and multicriteria approach is necessary to demonstrate the impact on all aspects of sustainability. Researchers cannot rely on a single indicator or a small group of indicators. Instead, a comprehensive set of robust and relevant indicators are essential, together with reliable and quality data sources. Otherwise, the study runs the risk of drawing incorrect conclusions or conclusions that do not cover all the relevant aspects. To correlate the used indicators, publicly acceptable weighting factors have to be used, and the results need to be quantitative and replicable.
Voeste emphasized that the improvement of relevant indicators?used to assess and monitor progress in sustainability?will be vital in the global effort towards sustainable food security. Robust measurement and practical scenarios will facilitate governance and drive appropriate change.
FOOD SECURITY AND THE ENVIRONMENT
Jason Clay of the World Wildlife Fund set the stage for this session by stating that in the next 40 years (i.e., by 2050), we will have to produce as much food as has been produced in the last 8,000 years, and we are already exceeding the carrying capacity of the planet’s resources. He noted that water is a critical concern going forward and that we need to find ways to address increasingly scarce and variable water resources. Agriculture is also a large polluter (air, water, and greenhouse gas emissions), which has more negative impacts on the planet than any other human activity. He suggested that another noticeable factor is food waste—from the farm level to consumers and beyond. Therefore, one of the most efficient ways to increase food availability is to reduce waste. Clay also suggested that in this context, nature, not government, is the single largest source of subsidies for agriculture. Furthermore, we need to account for environmental externalities in costs and prices to send the right signals to producers and consumers. Finally, Clay suggested that whatever the sustainability challenges have been to date, they will increase significantly by 2050, when we have more than 9 billion people, with an average of 2.9 times as much income, a doubling in consumption, and an increase in the consumption of animal protein. This is the challenge going forward.
FOOD SECURITY AND THE ENVIRONMENT: FOOD SECURITY AND LAND CROPPING POTENTIAL14
Jonathan Foley, University of Minnesota
Jon Foley began by emphasizing the role of agriculture on the planet, noting that about 40 percent of our global land area, 70 percent of our global water withdrawals, and 30 percent of our greenhouse gas emissions come from land use and agriculture. It is also the single largest driver of biodiversity decline. Therefore, it will be a major challenge to meet future food demands while at the same time minimizing environmental impacts.
____________
14 The presentation is available at http://sites.nationalacademies.org/PGA/sustainability/foodsecurity/PGA_060826, presentation by Jon Foley (February 17, 2011).
Foley noted that there are two ways to meet these growing demands: expand the area under production that grows food or intensify production per unit area of land (or both). Each has serious environmental consequences. Expansion has significant implications for carbon, climate change, and biodiversity. Intensification, on the other hand, requires the increasing use of water resources, nutrients, pesticides, and fossil energy.
Foley described the Global Landscapes Initiative,15 based at the University of Minnesota, which has developed approaches to examine these environmental implications and trade-offs. The initiative provides spatial data on yields, fertilizer use, and irrigation rates of more than 175 crops. Foley’s presentation also focused on global production patterns for maize and wheat, suggesting potential areas for agricultural expansion and intensification. He noted that further cropland expansion is possible, but that many of the most likely areas are in the tropics or other sensitive ecosystems, often with lower rates of productivity, so that carbon debt and the biodiversity implications are enormous (Figure I 3-5).
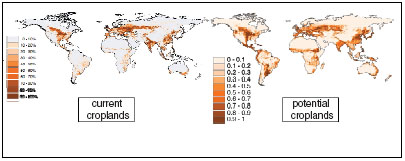
FIGURE I 3-5 Further expansion is possible.
SOURCE: Presentation by Jon Foley, University of Minnesota, February 17, 2011. Ramankutty et. al. 2002.
The map in Figure I 3-6 shows maize yields around the world to help identify areas where more intensive cultivation could result in large productivity gains. The green areas are places where close to maximum yields have been achieved (e.g., U.S. Upper Midwest and Spain). In many places (colored yellow and brown), productivity could be increased by 25–50 percent without genetic improvement. He singled out Eastern Europe as a region with significant potential for increased yields with improved management and infrastructure. Current production is now just 25 percent of what would be projected based on its climate and soils.
Foley identified water and nutrient availability as the most significant short term factors limiting production growth. Over the longer term, genetic improvements would be necessary.
____________
15 See http://environment.umn.edwateru/gli. Accessed on June 6, 2011.
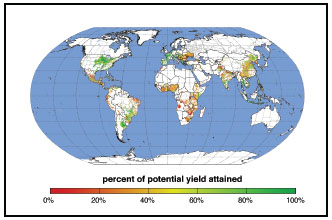
FIGURE I 3-6 Maize yield attainment.
SOURCE: Presentation by Jon Foley, University of Minnesota, February 17, 2011. Data from Mueller et. al., in preparation.
In conclusion, Foley noted that freezing the footprint of agriculture; sustainably intensifying land; optimizing the trade-offs between yield, water, and nutrients; and dramatically improving the efficiency of the entire food system will be important steps. He emphasized the need not only to look at food production as an end point but also to look at the net nutritional contribution resulting from our agricultural practices.
THE ENERGY AND CARBON CONUNDRUM IN SUSTAINABLE AGRICULTURAL PRODUCTION16
Paul Vlek, University of Bonn
Paul Vlek noted that growth in population and income in the developing world is driving an increase in demand for food and agricultural production, calling for more land to be converted or existing agricultural land to be used more intensively. This pressure has led to an increase in land dedicated to agriculture in its various forms of around 20 percent over the last 40 years of the past century with more than 50 percent of the tropical regions suffering from land degradation and half of this area also showing serious soil degradation. Projections show that
____________
16 The presentation is available at http://sites.nationalacademies.org/PGA/sustainability/foodsecurity/PGA_060826, presentation by Paul Vlek (February 17, 2011).
another 20-30 percent of the original biomes in the tropics will be converted to agricultural land by the middle of this century. As a result of land conversion it is estimated that about 2,250 106 metric tons of carbon dioxide (CO2) are emitted in the tropics alone. Thus, land conversion is an environmentally costly means of securing food for a growing population.
Since the early 1960s, agricultural intensification has been an increasingly important means for meeting food demand. In fact, Vlek stated, this approach is credited with sparing 1.1 billion ha of land that would have been converted if intensification options had not been available. However, intensification of agriculture has been based largely on the deployment of fossil energy in the sector. As annual primary energy use worldwide climbed from 9,000 to 10,000 106 toe17 during the 1990s, fossil energy use in agriculture went up from 197 to 222 106 toe, with most of that increase occurring in Asia. As agricultural systems become more intensive, the energy efficiency of these systems decreases. As a result, the United States and Europe produce 1.1 and 1.7 calories of food, respectively, for every calorie of fossil energy used, whereas this ratio is nearly 5 in developing countries. If human energy is taken into account, the efficiency of transforming energy into food calories is widely different, varying from 16.5 for mixed root-crop-based systems in New Guinea to 1.3 for intensive rice cultivation in Surinam. Thus, intensification has led to a great dependence of agricultural production on fossil fuels, a rather disconcerting dependency when sustainability of agriculture is increasingly called for, given the finite amounts of fossil fuels. The annual CO2 emission associated with this fossil energy use is estimated to amount to 200 106 t, or one-tenth of what is emitted as a result of land conversion, two-thirds of it associated with fertilizer use and one-third associated with the use of mechanization. Thus, though less costly in greenhouse gas emissions, the long-term prospects of relying on fossil energy for food production are risky.
Vlek explained that, overall, the contribution of agricultural operations to greenhouse gas emissions is fairly small. It is the clearing of native ecosystems for agricultural use in the tropics that is the largest (non-fossil fuel) source of CO2 input to the atmosphere. The use of farm machinery, irrigation, fertilization, and chemical pesticides amounts to merely 4 percent of commercial energy use in developing countries. Of this, 70 percent is associated with the production and use of chemical fertilizers. In the absence of fertilizer use, the developing world would have converted even more land for agriculture, most of which is completely unsuitable for long-term cultivation. The dynamics of land appropriation by agriculture and pastures is driven by increasing food demand, but also by the loss of productive land due to degradation. The need to curtail encroachment on new, often less suitable land comes at a great cost, both in loss of ecosystem services and CO2 emission, and should be avoided. However, the land that is threatened to be abandoned due to degradation may make a contribution in mitigating greenhouse gas emissions. Current expectations are that reforestation on such land can sequester large quantities of carbon to mitigate excessive emissions elsewhere. But any program that aims to set aside marginal land for the purpose of sequestering carbon must do so without threatening food security in the region. The best option to liberate the necessary land for carbon sequestration would be the intensification of agricultural production on some of the better lands by increased fertilizer inputs while, at the same time afforesting some of the non- or less-productive land. The validity of this concept has been demonstrated in experiments in Uzbekistan, where as much as 120 metric tons of carbon were sequestered over 4 years by trees planted on highly salinized agricultural land.
____________
17 Tons of oil equivalent.
Vlek explained that his calculations show that the sequestration of carbon through afforestation far outweighs the emissions that are associated with the production of the extra fertilizer needed to maintain agricultural output. Increasing the fertilizer use on cereals in the developing world (excluding China) by 20 percent would offer an overall net benefit in the carbon budget of between 80 and 206 106 t per yr-1, depending on the carbon sequestration rate assumed for the re-growing forest. In those regions, where current fertilizer use is low, the relative benefits are the highest, as yield response would not yet exhibit diminishing returns. Thus, more land can be set aside without harming food security. In Sub-Saharan Africa, a 20 percent fertilizer increase, which amounts to 0.14 106 t of extra fertilizer, can liberate land to tie up somewhere between 8 and 19 106 t of CO2 per year (average: 96 t CO2 per 1 t fertilizer). In the Near East and North Africa, with a 20 percent increased fertilizer use of 0.4 106 t yr -1, between 10 and 24 106 t of CO2 could be sequestered on the land that is set aside (40 t CO2 per 1 t fertilizer). In South Asia this is 22–61 106 t CO2 yr -1, with an annual additional input of 2.2 106 t of fertilizer (19 t CO2 per 1 t fertilizer).
In summary, Vlek said that modern agricultural production world-wide is fossil fuel dependent and carbon intensive. There is a high demand for agricultural land, especially in developing countries, but the cost in CO2 release in land conversion is substantial. The alternative is intensification, which is cheaper in CO2 loading, but increases dependency on limited fossil fuel supplies. Sequestration of carbon on marginal land with afforestation would far outweigh the emissions associated with the production of the extra fertilizer (12 106 t yr-1). In the long run, however, Vlek emphasized that alternative energy sources are needed to sustain agriculture.
FOOD SECURITY AND THE ENVIRONMENT: ANIMAL PROTEIN PRODUCTION IMPACTS AND TRENDS18
Judith L. Capper, Washington State University
Jude Capper stated that in 1800, each U.S. farm could produce only enough food to feed one other family. In the wake of considerable improvements in efficiency and productivity, each farmer currently produces, on average, enough food to feed 125 other people. However, there is a global food crisis, with the number of food-insecure people in the world increasing from 820 million in 2004–2006 to 1,020 million in 2009 (FAO, 2009b). The global population is predicted to increase to approximately 9.5 billion people by 2050. This will increase total food requirements by 70 percent compared with today (FAO, 2009a), as a function of both population size and the augmented demand for milk and meat protein resulting from more widespread global affluence. If the present competition for energy, land, and water supplies continues, Capper noted, resources available for agricultural production are likely to decrease concurrently with increased population growth. The global livestock industries, therefore, face the challenge of producing sufficient nutritious, safe, affordable animal protein to meet consumer demand, using a finite resource base.
____________
18 The presentation is available at http://sites.nationalacademies.org/PGA/sustainability/foodsecurity/PGA_060826, presentation by Judith Capper (February 17, 2011).
Sustainability is defined by the U.S. Environmental Protection Agency (U.S. EPA, 2010) as “meeting society’s present needs without compromising the ability of future generations to meet their own needs.” Capper noted that popular perceptions of sustainable agriculture are often directed towards extensive low-input: low-output systems or systems that supply only the local geographic area. This is reinforced by the growing trend within the media and Internet sites of promoting an agrarian idyll of a population growing their own food in back yards or through community cooperatives. Although animal proteins are considered as staple foods in many diets, concern over the perceived environmental impact of conventional animal production may threaten social license to operate in the future.
In any agricultural or industrial sector, improving productivity allows system fixed costs to be diluted out over greater units of production, thus reducing the economic cost per unit. The same concept can be applied to environmental costs, with carbon, the fundamental unit of energy in living systems, as the currency. Capper explained that all animals require a basal daily quantity of feed nutrients to maintain vital functions and minimum activities (maintenance requirement). This can be considered to be the fixed cost of animal production that must be met for every animal within the population. The level of animal protein production (milk yield, growth) then determines the additional variable costs of the system. Nutrient energy use is a valid proxy for natural resource use (land, water, fossil fuels) and greenhouse gas emissions. Management practices that improve efficiency reduce the size of the animal population required to produce a set quantity of animal protein and thus decrease the total associated maintenance nutrient requirement, and will therefore reduce resource use and waste output per unit of food produced (Table I 3-3).
Proof of this concept is demonstrated by the improvements in efficiency seen in the U.S. dairy industry over the past 60 years. As described by Capper et al. (2009), the size of the U.S. dairy herd peaked in 1944 at 25.6 million cows, with a total milk yield of 53.0 billion kg produced through an extensive pasture-based system. By comparison, the 2007 dairy herd contained 9.2 million cows producing 84.2 billion kg of milk. The four-fold increase in milk yield per cow and consequent improvement in efficiency was facilitated by improvements in management, nutrition, and genetics. Analyzing the environmental impact of the U.S. dairy industry in 1944 compared with 2007 revealed that to produce an equivalent amount of milk, only 21 percent of the dairy population (lactating cows, dry cows, heifers, and bulls), 23 percent of the feedstuffs, 10 percent of the land, and 35 percent of the water were required, and only 24 percent of the manure was produced. Consequently, the total greenhouse gas emissions (carbon footprint) per unit of milk were reduced by 63 percent, and the carbon footprint of the entire dairy industry was 41 percent lower in 2007 compared with 1944.
Productivity has also improved substantially in the U.S. beef industry, with average beef-carcass yield per animal increasing from 274 kg in 1977 to 351 kg in 2007 (USDA, 1978; USDA/NASS, 2008). Management advances over this time period facilitated an increase in growth rate, reducing the total days from birth to slaughter and thus the total maintenance resource cost and waste output associated with beef production. Between 1977 and 2007, increasing growth rate meant that the age at slaughter was reduced from 609 days to 485 days. In combination with the increased beef yield per animal, this reduced animal numbers by 30 percent, feed use by 19 percent, water use by 14 percent, land use by 34 percent, manure production by 20percent, and the carbon footprint per unit of beef by 18 percent (Capper, 2010b).
The FAO (2006) concludes that it is essential to continue to intensify livestock production in order to maintain the efficiency gains that improve environmental sustainability. By contrast, consumers often assume that extensive, pasture-based beef systems where cattle are finished on grass are more environmentally friendly than conventional corn-based systems. It is important to note, Capper said, that between one-half and two-thirds of conventional beef animals’ lives are spent on pasture and that intensive corn-based finishing only occurs in the final growth period within the feedlot. Growth rates are considerably lower in animals finished on grass, and it is difficult to achieve high slaughter weights; therefore, grass-finished cattle are usually slaughtered at around 486 kg at 679 days of age, compared with 569 kg at 453 days of age in a conventional system (Capper, 2010a). As a consequence of the reduced slaughter weight, 4.5 total animals (slaughtered animals plus the supporting population required to produce calves for rearing) are required to produce 363 kg of beef carcass in the grass-finished system compared with 2.6 total animals in the conventional system. When combined with the increased time required to grow animals to slaughter weight, this increases the carbon footprint per 363 kg of beef by 74 percent, land use by 83 percent, and water use by 326 percent (Capper, 2010a).
TABLE I 3-3 Productivity Improvements and Associated Impacts on Resource Use and WasteManagement in U.S. Animal Protein Production
| Protein System | Efficiency Improvement | Impacts |
| Dairy | Increased milk yield Increased component (fat and protein) yield |
To produce an equivalent amount of animal protein from an improved system compared with an unimproved system: Smaller total animal population - Productive animals (lactating, growing) - Supporting population Reduced total maintenance requirement Reduced resource use per unit of food Reduced waste output per unit of food Reduced greenhouse gas output per unit of food |
| Beef | Increased slaughter weight Increased growth rate Reduced time from birth to slaughter |
|
| Swine | Increased litter size Increased number of litters per year Reduced time from birth to slaughter |
|
| Poultry | Reduced mortality Increased slaughter weight Reduced time from birth to slaughter |
|
Compared to ruminant production, swine and poultry industries are generally considered to be less environmentally threatening to climate change, because monogastric animals produce considerably less enteric methane than ruminants. Nonetheless, given the increase in poultry and swine consumption predicted to occur from now to 2050, further efficiency improvements are necessary within these industries to continue to reduce overall environmental impact. As shown in Table I 3-3, improving sow productivity (i.e., litter size, number of litters), animal growth rates, poultry mortality, and slaughter weights minimizes losses within the system, thus reducing the size of the total animal population, the resources required, and the waste output from producing a set quantity of animal protein.
The challenge of producing more animal protein to fulfill human population requirements while minimizing resource use and waste output is not confined to future scenarios, Capper explained. A recent FAO report on greenhouse gas emissions from global dairy production differentiated the results by region and demonstrated a decrease in the carbon footprint per kg of fat and protein-corrected milk at the farm gate for industrialized nations (1-2 kg CO2-equivalent
per kg milk) compared with developing areas (3-5 kg CO2-equivalent per kg milk). When carbon footprint data are compared with the underlying data on regional milk production, a negative association is shown; that is, as milk production per cow increases, carbon footprint per unit of milk decreases. In 2007 the Chinese government announced that the human recommended daily intake of dairy products should be increased from 100 to 300 g. Given the size of the Chinese population, this would require an additional 65 million dairy animals at current daily milk yields (11 kg per day). If productivity was improved to that of the average U.S. dairy cow (29 kg per day), this would still require an increase in the dairy population, yet this increase would be confined to 23 million animals with concurrent comparative reductions in total maintenance requirements, resource use, and greenhouse gas output.
Debate continues as to the most suitable metric for assessing the sustainability of animal protein production. Various possibilities exist, including resource use per unit of food (e.g., beef, milk, cheese), acre of land or gallon of water; calories or protein output per acre; income per unit of food; labor per acre, etc. The purpose of the animal agriculture industry is to produce animal protein; therefore, it seems appropriate to use food output as a metric, yet differing regions may have environmental challenges that bring other metrics (e.g., output per unit of water in drought-stressed areas) into play. Capper noted that it is important to recognize that there is no “one-size-fits-all” management practice or system to reduce environmental impact. As the FAO (2010) report demonstrates, less-developed countries reliant on extensive production have increased greenhouse gas emissions per unit of milk, yet the economic and social value of livestock ownership is considerable. Capper emphasized that to move the global livestock industry further towards sustainability, it is necessary to consider the balance between environmental, economic, and social indexes.
The livestock industry faces a considerable challenge in producing sufficient animal protein to feed the growing population while continuing to improve sustainability. As demonstrated by improved efficiency in the U.S. livestock industry over the past 60 years, this challenge may be partially met by making productivity gains that reduce resource use and cut greenhouse gas emissions from livestock production. However, Capper noted, the metrics by which this is assessed may differ between systems, just as the management practices put into place to improve productivity will vary widely between regions. Rather than focusing on one single metric, true sustainability within the livestock industry can only be achieved by a balance between environmental impact, economic viability, and social responsibility.
Following the presentations, participants asked for clarification on some of the information. Emmy Simmons started the discussion by asking how the farm level analyses described by Shaw and Voeste could be scaled up for use by policy makers. Greg Thoma said that this was an important issue and that the Sustainability Consortium was building a modeling infrastructure that uses linkages with other efforts, such as Field to Market, which would allow the aggregation of farm level analyses to regional or national levels. Steve Polasky suggested that it would be useful to link these farm level models to the life-cycle work being done under InVEST as well as to the spatial modeling done through HarvestChoice. Many participants voiced their support for this idea, but Thoma said that there remain challenges in doing this. For
example, it is difficult to calculate water sustainability along a supply chain that includes both water stressed and nonstressed areas. Hartwig de Haen asked how the indicators being developed related to those used in the Millennium Ecosystem Assessment. This led to discussion about the need to tailor indicators to specific locations. For example, a bird index may be a useful measure of biodiversity in the United States or Europe, but probably not in many other parts of the world. Finally, it was noted that indicators related to the sustainability of livestock production were much less well developed than those for other agricultural products.
Perrin
Alston, J., M. Anderson, J. James, and P. Pardey. 2010. Persistence Pays: U.S. Agricultural Productivity Growth and the Benefits from Public R&D Spending. New York: Springer.
Lobell, D. B., K. G. Cassman, and C. B. Field. 2009. Crop yield gaps: their importance, magnitudes, and causes. Annual Review of Environment and Resources 34:179-204.
Choices Magazine, Feb 9, 2010. Available at http://www.choicesmagazine.org/magazine/issue.php?issue=18
Fulginiti, L. E, and R. K. Perrin. 2005. Productivity and welfare. The Journal of Productivity Analysis 49(2):133-155.
Monsanto. 2008. Press Release. Available at http://monsanto.mediaroom.com/index.php?s=43&item=607
Fuglie, K. 2008. Is slowdown in agricultural productivity growth contributing to the rise in commodity prices? Agricultural Economics 39:supplement 431-441.
Polasky
Johnson, K. A. 2011. The impact of land-use change on ecosystem services, biodiversity and returns to landowners: a case study in the state of Minnesota. Environmental and Resource Economics 48:219-242.
Polasky, S., E. Nelson, D. Pennington, and K. A. Johnson. 2010. The impact of land-use change on ecosystem services, biodiversity, and returns to landowners: a case study in the state of Minnesota. Environmental and Resource Economics 48(2):219-242.
McCornick-Molden
Molden, D, ed. 2007. Water for Food, Water for Life: A Comprehensive Assessment of Water Management in Agriculture. London: Earthscan and Colombo, Sri Lanka: IWMI (International Water Management Institute):645.
Molden, D., T. Oweis, P. Steduto, P. Bindraban, M. A. Hanjra, and J. Kijne. 2010. Improving agricultural water productivity: between optimism and caution. Agricultural Water Management 97:528-535.
Sadoff, C., and M. Muller. 2009. Water Management, Water Security and Climate Change Adaptation: Early
Impacts and Essential Responses, Technical Committee Background Paper No. 14. Stockholm, Sweden: Global Water Partnership.
Sharma, B., U. Amarasinghe, X. Cai, D. De Condappa, T. Shah, A. Mukherji, L. Bharati, G. Ambili, A. Qureshi, D. Pant, S. Xenarios, R. Singh, and V. Smakhtin. 2010. The Indus-Ganges: river basins under extreme pressure. Water International 35(5):493-521.
The World Bank. 2006. Ethiopia: Managing Water Resources to Maximize Sustainable Growth: Country Water Resources Assistance Strategy. Washington, DC: The World Bank.
Venot, J. P., H. Turral, M. Samad, and F. Molle. 2007. Explaining Basin Closure through Shifting Waterscape in the Lower Krishna Basin, South India, Research Report 111. Colombo, Sri Lanka: IWMI.
Vorosmarty, C. J., P. B. McIntyre, M. O. Gessner, D. Dudgeon, A. Prusevich, P. Green, S. Glidden, S. E. Bunn, C. A. Sullivan, C. R. Liermann, and P. M. Davies. 2010. Global threats to human water security and river biodiversity. Nature 467:555-561.
Clay
Clay, J. 2010. Agriculture from 2000 to 2050—The Business as Usual Sscenario. Washington, DC: The Global Harvest Initiative.
WWF (The World Wildlife Fund). 2010. The Living Planet Report-2010. Gland, Switzerland: WWF.
Foley
Monfreda, C., N. Ramankutty, and J. A. Foley. 2008. Farming the planet. Part 2: geographic distribution of crop areas, yields, physiological types, and net primary production in the year 2000. Global Biogeochemical Cycles 22(1):1-19.
Ramankutty, N., J. A. Foley, J. Norman, and K. McSweeney. 2002. The global distribution of cultivable lands: current patterns and sensitivity to possible climate change. Global Ecology and Biogeography 11(5):377-392.
Vlek
Friedlingstein, P., R. A. Houghton, G. Marland, J. Hackler, T. A. Boden, T. J. Conway, J. G. Canadell, M. R. Raupach, P. Ciais, and C. Le Quéré. 2010. Update on CO2 emissions. Nature Geoscience 3:811-812.
Grainger, A. 2009. Measuring the planet to fill terrestrial data gaps. Proceedings of the National Academy of Sciences 106:20557-20558.
Khamzina, A., J. P. A. Lamers, and P. L. G. Vlek. 2009. Nitrogen fixation by Elaeagnus angustifolia in the reclamation of degraded croplands of Central Asia. Tree Physiology 29(6):799-808.
MEA (Millennium Ecosystem Assessment). 2005. Living beyond Our Means: Natural Assets and Human Well-Being. Washington, DC: Island Press.
Rudel, T. K., L. Schneider, M. Uriarte, B. L. Turner II, R. DeFries, D. Lawrence, J. Geoghegan, S. Hecht, A. Ickowitz, E. F. Lambin, T. Birkenholtz, S. Baptista, R. Grau. 2009. Agricultural intensification and changes in cultivated areas, 1970-2005. Proceedings of the National Academy of Sciences 106:20675-20680.
Smith, P., D. Martino, Z. Cai, D. Gwary, H. Janzen, P. Kumar, B. McCarl, S. Ogle, F. O’Mara, C. Rice, B. Scholes, O. Sirotenko, M. Howden, T. McAllister, G. Pan, V. Romanenkov, U. Schneider, and S. Towprayoon. 2007. Policy and technological constraints to implementation of greenhouse gas mitigation options in agriculture. Agriculture, Ecosystems and Environment 118:6-28.
Vlek, P. L. G., G. Rodriguez-Kuhl, and R. Sommer. 2004. Energy use and CO2 production in tropical agriculture and means and strategies for reduction or mitigation. Environment, Development and Sustainability 6:213-233.
Capper
Capper, J. L., R. A. Cady, and D. E. Bauman. 2009. The environmental impact of dairy production: 1944 compared with 2007. Journal of Animal Science 87:2160-2167.
Capper, J. L. 2010a. The Environmental Impact of Conventional, Natural and Grass-Fed Beef Production Systems. Proceedings of the Greenhouse Gases and Animal Agriculture Conference 2010. Banff, Canada.
Capper, J. L. 2010b. The Environmental Impact of U.S. Beef Production: 1977 Compared with 2007. Proceedings of the Greenhouse Gases and Animal Agriculture Conference 2010. Banff, Canada.
FAO (Food and Agriculture Organization of the United Nations). 2006. Livestock’s Long Shadow— Environmental Issues and Options. Rome, Italy: FAO.
FAO. 2009a. How to Feed the World in 2050. Rome, Italy: FAO.
FAO. 2009b. The State of Food Insecurity in the World 2009. Rome, Italy: FAO.
FAO. 2010. Greenhouse Gas Emissions from the Dairy Sector: A Life Cycle Assessment. Rome, Italy: FAO.
Rischkowsky, B. and D. Pilling. 2007. The State of the World’s Animal Genetic Resources for Food and Agriculture. Rome, Italy: Commission on Genetic Resources for Food and Agriculture.
U.S. Environmental Protection Agency. 2010. What is Sustainability? Available at http://www.epa.gov/Sustainability/basicinfo.htm. Accessed March 2010.
USDA (U.S. Departmentment of Agriculture). 1978. Livestock Slaughter Annual Summary 1977. Washington, DC: USDA.
USDA National Agricultural Statistics Service. 2008. Livestock Slaughter 2007 Summary. Washington, DC: USDA.


