
METRICS FOR FOOD INSECURITY AND MALNUTRITION
Hartwig de Haen, Stephan Klasen and Matin Qaim1
Paper presented at the workshop on Measuring Food Insecurity and Assessing the Sustainability of Global Food Systems, February 16-17, 2011, Keck Center of the National Academies, Washington, DC.
1. INTRODUCTION
Recently, the International Food Policy Research Institute (IFPRI) published an estimate of hunger in 12 sub-Saharan African countries. Based on an analysis of household surveys the authors found that in the late 1990s 59 percent of the population was food energy deficient (Smith et al., 2006). This result was in stark contrast to estimates by the Food and Agriculture Organization of the United Nations (FAO), based on food balance sheets for the same countries, the same period and using the same criterion of energy deficiency as an indicator of undernourishment. The FAO prevalence estimate was 39 percent (Smith et. al., 2006, p 45), hence significantly lower. Not only did the two methods differ with respect to the mean level of undernourishment, the ranking of the 12 countries differed as well. In other words, there is not even a close correlation between the two estimates. This example of divergent estimates of hunger, measured with the same criterion, namely food energy deficiency, suffices to raise interest in a thorough comparative assessment of the various methods used to estimate hunger.
Numerous statistics are published reporting on the food security and nutrition situation at global, country, household and individual levels. A comprehensive overview of available or conceivable indicators can be found under the FAO-led Food Insecurity and Vulnerability Information and Mapping Systems initiative, FIVIMS, (http://www.fivims.org). FIVIMS was established, initially as an inter-agency initiative following the World Food Summit (WFS) in
____________
1 The authors are Professors at the Georg-August-University of Göttingen. H. de Haen and M. Qaim are, respectively, Emeritus and Chair, International Food Economics and Rural Development, at the Department of Agricultural Economics and Rural Development. S. Klasen is Chair, Theoretical Economics and Development Economics at the Faculty of Economic Sciences. The authors would like to thank Mark Smulders, FAO, and participants at the workshop for helpful comments and suggestions.
1996, which determined that food security exists when all people, at all times, have physical and economic access to sufficient, safe and nutritious food to meet their dietary needs and food preferences for an active and healthy life (WFS Plan of Action, 1996). This widely accepted definition underlines the multidimensional nature of food security, comprising level and stability of food access and availability, adequacy of food use and food consumption and nutritional status. Conversely, it explains that food insecurity, i.e. the absence of food security, can be the result of very diverse factors.
The equally broad and overlapping concept of nutrition security determined by dimensions of food, care and health, can be assessed through a number indicators, including those measuring undernutrition as well as overnutrition. Per Pinstrup-Andersen talks about the triple burden of malnutrition, differentiating between (i) food energy deficiency, (ii) deficiency in specific nutrients, especially micronutrients, which are also key for an active and healthy life, and (iii) excessive net energy intake leading to overweight and obesity (Pinstrup-Andersen, 2007). In view of this multi-facetted character of food insecurity and malnutrition, it is not surprising that—when indicators measure different dimensions—the conclusions may also be different from one indicator to another. However, where different methods are used to measure the same phenomenon, one would expect only little, if any differences. The comparative assessment provided in this paper intends to discuss the reasons for differences between methods and indicators in more detail. While we recognize that the obesity problem is increasing, including in developing countries, we concentrate primarily on measures of food deprivation and undernutrition.
Obviously, before a specific food insecurity information and mapping system is set up, clarification is needed, as to which aspect of food insecurity is to be measured in each particular situation and by which indicator. Expressed in simple terms, people are deemed food insecure when their consumption of food is insufficient, insecure and/or unsustainable (Maxwell and Frankenberger, 1995). They live in hunger or fear of starvation. Although hunger is commonly understood as a sensation of not having enough to eat, its definition and measurement are not at all trivial. On the one hand, the extent of hunger can be measured as a lack of essential nutrients in the diet. A widely used indicator for this is food energy deficiency. On the other hand, hunger may also be the result of humans’ inability to absorb and use food energy and specific nutrients for body functions, implying that the overall nutritional status may also be affected by people’s health. Accordingly, the combined effects of access to food and of food absorption and use are best measured through outcome indicators that inform about people’s actual nutrition status such as undernutrition or overnutrition.
Before proceeding to discuss the advantages and disadvantages of these various approaches to the topic, it is necessary to clarify the purpose of measurement. Two quite different purposes can be distinguished. One is to be informed about the extent and consequences of an actual food emergency caused by a sudden drop in supply or access to food. In such situations, indicators must provide information about people’s immediate needs of essential nutrients to ensure survival. Indicators must be easy and quick to measure and useful for the design of humanitarian aid action. The second purpose relates to chronic food insecurity, caused by long term food deprivation linked to structural poverty and poor nutrition. One such indicator is “undernourishment”, a measure of ‘chronic food insecurity, in which food intake is insufficient to meet basic energy requirements on a continuing basis’ (FAO, (SOFI, 1999), p. 11). Information about chronic food insecurity is needed for an assessment of level, geographical
distribution and trends of hunger and/or for the design and implementation of anti-hunger policies, strategies and investment that seek to reverse undesirable trends. This paper focuses on indicators of chronic food insecurity.
To be useful for a comprehensive assessment, indicators of food insecurity should provide answers to at least three questions, namely: Who are the food-insecure? How many are they? And where do they live? If the purpose of the measurement goes beyond assessment and includes the design of policy responses, the indicators should also help answering the more ambitious question: Why are people food insecure, what are the underlying causes and hence, what should be done?
Numerous methods are in use to measure certain aspects of food insecurity. They can be summarized as follows:
- Indicators derived from food balance sheets
- indicators based on household consumption surveys
- indicators derived from anthropometric measurements
- indicators derived from medical assessments
- Composite indicators.
Methods (1) to (3) currently represent the principal tool kit. Both the first and the second compare levels of nutrient consumption with levels of nutrient requirements. While both use science-based nutritional norms as requirement standards, they differ in the source of information about people’s food consumption. The first, used by FAO, calculates food available for human consumption from national food balance sheets (FBS) and uses different information sources for a statistical measure of dispersion to approximate the distribution of food consumption levels within countries. The second derives the estimates of mean as well as dispersion of food consumption from household surveys, asking respondents to recall food consumption during a reference period. The third method relies on physical measurements of people (principally weight and height measurement, often concentrating on children) as indications of their nutritional status.
The fourth method provides additional data from medical analysis. This can include clinical assessments, such as the observation of physical signs on the body that are symptomatic of nutritional disorders (e.g., loss of skin pigment, edema) or biochemical assessment through the examination of blood or urine. At the population level, health indicators such as child mortality or low birth weight are also sometimes used as proxies for nutritional status. Finally, a number of efforts have been undertaken recently to combine specific indicators into composite indicators seeking to capture several critical dimensions of food insecurity and malnutrition at the same time. The Global Hunger Index published jointly by IFPRI and the German Welthungerhilfe is such an example designed for cross-country comparison. While they do not as such generate additional measurements, composite indicators aim to facilitate communication of the comprehensive nature of food insecurity and malnutrition.
To date, a consensus among experts on the reasons for discrepancies between the results obtained from different methods is still elusive. The mentioned case of contradicting estimates of undernourishment in countries of Sub-Sahara-Africa is one such example. The apparent contradictions between only moderate estimates for the prevalence of undernourishment in the overall population of India versus the much higher rates of undernutrition among India’s children that result from anthropometric measurements are another example (see below). It is hoped that
the following discussion, which particularly examines the first three of the mentioned methods in detail, will contribute to some progress towards a consensus regarding the most realistic measurements.
We critically review the three principal methods with regard to their measurement approach, the accuracy of the underlying data, and their usefulness for policy decisions, including projections and the simulation of nutritional impacts of shocks. The intention is not to describe the real food security situation but rather to describe and compare methods and indicators and make some suggestions for improvement and future research.
As part of a focus on sustainable global food security, the National Research Council’s Roundtable on Science and Technology for Sustainability is planning a workshop to examine these indicators, reviewing the approaches used in developing the indicators and assessing their strengths and weaknesses. This paper is a background paper for this workshop.
2. THE FAO INDICATOR OF UNDERNOURISHMENT
Definitions, Assumptions and Main Sources of Empirical Evidence
FAO estimates the prevalence of undernourishment, expressed as the share of people in a national population not meeting their minimum food energy requirements. It is assumed that food energy deficiency is the most critical indicator of hunger. The method is based on three key parameters: the mean quantity of calories available for human consumption per person, the rate of inequality in access to those calories within the population and the minimum amount of kilocalories required by that population on average, based on the gender and age structure.
The graph in Figure I A-1 illustrates the methodological procedure for estimating the proportion of the population whose food energy availability is below requirement, i.e., who are undernourished. The function f(x) depicts the proportion of the population corresponding to different dietary energy consumption levels (x), µx the mean dietary energy intake per person and rl the minimum acceptable dietary energy requirement (MDER). The area under the curve left of rl represents the proportion of the population not reaching the minimum level of dietary energy requirement, i.e. the prevalence of undernourishment, pU. Multiplied with the size of the population for the respective period it gives the number of undernourished.
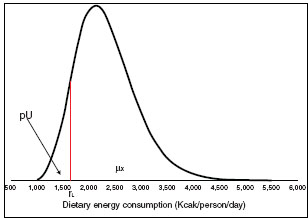
FIGURE I A-1: The FAO method of estimating undernourishment
NOTE: Distribution of dietary energy consumption
The amount of food available for human consumption is calculated from national FBS, compiled as the balancing item after considering production, trade, stock changes, non-food uses and extra-household waste. The per capita Dietary Energy Supply (DES) is obtained by aggregating all food items, converting the quantities into energy values and dividing the aggregate volume by the total population. It is noted that the indicator measures food available for human consumption at the household level, and not actual food intake. However, FAO considers it to be a close enough approximation of actual dietary energy consumption.
The inequality of access to food is estimated assuming a log-normal distribution function (Figure I A-1). This function with its short lower and longer upper tail was chosen because it reflects ‘the fact that wastages, food fed to pets etc. are likely to be confined to the upper tail representing the richer and more affluent households’ (FAO, 2003, p.12). The function is defined by the mean level of dietary energy consumption per person and the Coefficient of Variation (CV). The mean is assumed to equal the DES from the FBS. The CV is derived from the sample distribution of kilocalorie consumption per person as measured from available household surveys. Where food consumption information is not directly available from household surveys, survey data on food expenditure or income are used to derive estimates of dispersion. Where no survey data are available at all, data from comparable neighboring countries are used.
The third principal parameter needed for the FAO method is the aggregated Minimum Dietary Energy Requirement per person (MDER). This is the amount of food energy needed to balance energy expenditure in order to maintain an acceptable minimum body-weight, body composition and a level of minimum (‘sedentary’) physical activity, consistent with long-term good health. This includes the energy needs for optimal development of children, deposition of tissues during pregnancy and secretion of milk during lactation consistent with the good health of
mother and child. The recommended level of dietary energy consumption for the average of a population is the mean energy requirement of the healthy, well-nourished individuals who constitute that population.2
Who Uses the FAO Indicator and for What?
FAO has been publishing estimates of undernourishment in irregular intervals in its World Food Surveys since the 1960s. While scope and contents have been kept broadly similar, the country coverage as well as details of the methodology have been gradually adjusted over the years. Since 1999, the indicator is being published annually as a three-year average in the flagship publication ‘The State of Food Insecurity in the World’ (SOFI). Beginning with the 2009 edition, SOFI is published jointly by FAO and the World Food Program (WFP).
According to the latest edition (SOFI, 2010), covering the period 2005-2007, the total number of undernourished worldwide was estimated at 847 million people, of whom 835 million were living in developing countries. The number has hardly changed since 1990-1992 (the base year for the WFS goal and of the hunger target of the first Millennium Development Goal (MDG-1) aimed at halving, respectively, the number and the percentage of undernourished by 2015. On the other hand, the prevalence of undernourishment declined from 16 to 13 percent worldwide and from 20 to 16 percent in the developing countries. Since 2008, FAO has also published a preliminary estimate of undernourishment for the respective current year, using a simplified ex-post projection (see below). According to this method, the number of undernourishment was estimated at 925 million in 2010, down from 1,02 billion that had been estimated for 2009 using the same ex-post projection method (SOFI, 2009).
The main purpose of publishing the indicator regularly for a very large number of countries is to inform the global community about levels and trends of undernourishment (chronic hunger) in the world and thus facilitate global and regional governance of food security, while also advocating for stepped up efforts in hunger reduction. The indicator measures chronic food insecurity at national levels. It does not inform about the actual distribution of the number of hungry within countries nor is it the intention to provide actionable information for policy responses at sub-national levels. The estimates are therefore primarily of interest for international comparisons and for assessments of changes over time.
The publication is receiving wide attention by the media and the wider public and clearly fulfills its purpose to advocate action against hunger. The indicator is also used by food security analysts. FAO and its governing bodies, in particular the Committee on World Food Security (CFS) as well as many other international and national organizations concerned with development cooperation, refer to the estimates regularly. Presumably, various donors use the indicator also as one key information source for the ranking of priorities for aid allocations. The FAO Undernourishment estimates also serve as one of the two official indicators of progress towards target 2 of Millennium Development Goal One (“Halve, between 1990 and 2015, the proportion of people who suffer from hunger”). The other indicator is ‘Prevalence of underweight children under five years of age’ using anthropometric assessments (see below).
____________
2 The norms have been defined by the FAO/WHO/UNU Expert Consultation on Human Energy Requirements in 2001, which established energy standards, published in 2004, for different sex and age groups performing sedentary physical activity and with a minimum acceptable body-weight for attained heights.
Since a number of years, IFPRI has used the FAO estimates of the prevalence of undernourishment as one of three equally weighted indicators to construct its Global Hunger Index (GHI), with the other two being the prevalence of underweight in children under the age of five and the mortality rate of children under five years of age.
Governments of developing countries do take note of FAO’s undernourishment estimates as an indicator of the extent of hunger and of progress or retreat over time. Severe levels of undernourishment in any one country provide justification for appropriate policy measures to be put in place to remedy the situation. However, the indicator does not, and is not meant to, provide directly actionable information for policy design at sub-national level,
Sources of Funding – Past and Future
As informing the world about the scale, geographical distribution and implications of food insecurity belongs to the core functions of FAO, work in basic statistics as well as the preparation of the undernourishment indicator and its publication are normally funded from FAO’s core budget. However, funding of FAO’s statistics program has been rather tight for a number of years. The problem was recognized and a reform project launched, but its implementation is still ongoing. This may have critical implications for the quality of the data base and for the expert capacity in FAO to conduct the compilation of the undernourishment indicator.
Strengths and Weaknesses of the FAO Indicator
Undoubtedly, the main strength of the FAO method is its world-wide coverage with estimates for more than 100 countries, which enables the monitoring of national trends and tracking of progress and setbacks using the same methodology and criteria for all. The main weakness is the fact that it relies on national statistics compiled in FBS for the estimation of the dietary energy supply, so that the accuracy of the method depends critically on the quality of the statistical data obtained from member states and stored in FAOSTAT following a quality check. One can therefore not rule out that both levels of undernourishment between countries as well as changes in the indicator from one year to another within a country are determined by erroneous data rather than a real change in the number of undernourished. The short (yearly) intervals between publications of the indicator make such ‘over-interpretation’ more likely. Various authors have also criticized methodological issues, including the focus on food energy, the compilation of the dispersion of the intra-national distribution of food consumption and the standards used for calculation of minimum dietary requirements. In the following, some of these points will be discussed in more detail.
Mean Dietary Energy Supply per Person (DES)
FAO compiles the DES from FBS and uses it as an indicator of food energy consumption. The quantities of food commodities available for human consumption are calculated after deducting the net exports, stock increase, non-food use and extra-household waste from domestic production. This raises several questions. The first is whether food energy
deficiency is an adequate indicator of food insecurity; the second is whether dietary energy supply is a good approximation of food energy intake; the third concerns the accuracy of the FAOSTAT data base.
(1) Is average food energy deficiency an adequate indicator of food insecurity? Obviously, an adequate, healthy diet must satisfy human needs for energy and all essential nutrients. In fact, according to the Report of a Joint FAO/WHO/UNU Expert Consultation on Human energy requirements (FAO, 2001) “dietary energy needs and recommendations cannot be considered in isolation of other nutrients in the diet, as the lack of one will influence the others.” Adequate intake of food energy is essential for the metabolic and physiological functions of humans, and in this sense FAO focuses on the key indicator. However, as very often other nutrients are lacking in the diet, in particular micronutrients such as iron, vitamin A and zinc, comprehensive assessments of people’s nutritional status should ideally not be limited to the food energy deficiency indicator. In principle, the food balance sheet data can also be used to assess the level of micronutrient consumption and adequacy (Wuehler et al., 2005), but the level of commodity group aggregation is relatively high, which is a drawback that weighs more heavily for micronutrients than for calories. The use of three year averages generates other uncertainties. In a country where the fluctuations within the three years are very large, food insecurity is arguably a much more serious problem than in a country where the three year average is the same but caloric availability is much more stable.
(2) Is dietary energy supply a good approximation of dietary energy intake? As the dietary energy supply includes foods, which are subsequently lost or wasted at the retail and household levels, the method by definition overestimates the actual food energy intake.
(3) How accurate are the FAO food balance sheet data? FAO has been criticized by various authors for a lack of accuracy of the data inputs used to calculate the mean per caput DES. Svedberg suggests that “food availability is underestimated (by FAO) in most parts of the developing world, although less so elsewhere than in Africa” (Svedberg, 2002). He suggests that often the substantial share of food produced for subsistence tends to be underestimated in official statistics, leading to an overestimation of undernourishment. Deviations from FAO’s estimates have also been found in the IFPRI study of 12 African countries mentioned in the Introduction, although in this case, the critique is that FAO’s measure underestimates hunger.
Testing the validity of these claims is not easy. Conceptually, the FAO method does capture all components of supply and utilization, including subsistence production; however the estimates are obviously subject to possible errors. In particular, assumptions regarding post-harvest losses are often not transparent and there is very little hard data available on its level (let alone its country-by-country distribution and trends over time). Moreover, it must be noted that, although the FAO Statistics Division has to fill in missing data, in particular for stock changes, non-food use and wastage, or use data from other sources, e.g., on trade, a major part of the data input originates directly from countries. The case of India is worth mentioning here, as FAO’s estimates of rising numbers of undernourished in spite of the country’s strong economic growth are rather surprising. Whereas one would assume that economic growth in recent years should have increased per capita food consumption significantly, the statistics used to estimate undernourishment do not confirm this. FBS data show India’s per caput consumption stagnating around 2300 kcal/person/day between 1999/01 and 2005/07. India’s own surveys even show a
steady decline of per caput consumption during this period (Chattapadhyay and Chowdhury, 2010). A thorough analysis to explain this paradox is urgent, also because the development in India is of great significance for global trends (see also Deaton and Drèze, 2008; SOFI, 2008; and discussion below).
Inequality of Food Energy Consumption at National Level
FAO’s approach to compile the coefficient of variation (CV) of the intra-national distribution of dietary energy supply has been subject to intensive debate among experts. The debate has been centering around two questions, one regarding the realism of the CV estimate, the other regarding the assumptions for changes of the distribution over time.
Is the CV parameter realistic? The critical arguments raised by experts are not all consistent and partly contradictory. Svedberg suggests, for example, that “FAO must have overestimated the variance in the calorie-availability distribution across households, because the ensuing habitual intakes in the lower tail are impossibly low for living households” (Svedberg, 2003, p. 25). The mentioned IFPRI study of 12 African countries comes to the opposite conclusion. Based on household expenditure surveys, Smith et al. (2006) estimate an average CV of energy availability of 0.62 for the 12 African countries, whereas the FAO estimate for the same countries is 0.3, hence much lower. Other household surveys result in similar high dispersion parameters for food intake (Ecker et al., 2010).
FAO itself recognizes that the coefficient cannot be completely specified even without considering problems associated with survey practices, measurement errors and sample design (FAO, 2003, p. 23) The reason given relates to the (realistic) hypothesis that people’s food consumption is not only influenced by income, but also by their age/sex specific energy requirement. The following formula is used to calculate the CV:
![]()
where CV(x) is the total CV of the household per capita dietary energy consumption, CV(x |v) is the component due to household per capita income (v), and CV(x |r) is the component due to other sources of variation, in particular energy requirement (r). CV(x |r) is considered to be a fixed component and is estimated to correspond to about 0.20. CV(x |v) is, however, estimated on the basis of household survey data (FAO, 2003, p. 38).
According to FAO, the CV resulting from the analysis of survey data using the formula above is occasionally further corrected to remove components of variation that are considered not plausible. Moreover, as the log-normal distribution would not exclude energy intake levels below the absolute minimum for survival or above possible maximum food intake levels, lower
and upper bounds for the range of the CV have been set at 0.2 and 0.35.3 The IFPRI study suggests that due to these adjustments the FAO CVs may be biased downward (Smith et al. 2006, p. 50). However the empirical evidence for such a conclusion is limited.
Is it realistic to assume no change of the CV over time? FAO has so far kept most CVs constant over time. Adjustments of the CVs have been limited to a few cases. FAO justifies this by a lack of available survey data, but suggests also that “there has been little, if any, change in the inequality of income/expenditure in most countries” (FAO, 2003, p. 16). The implications of this procedure for the estimates of undernourishment could indeed be significant. Firstly, empirical evidence suggests that, especially since the 1990s when structural adjustment programs began to take effect in more developing countries, income distributions do change as economies grow. In fact, there is evidence that income and expenditure inequality in a majority of developing countries increased (at least slightly) between the early 1980s and the mid 1990s; since then trends are more heterogeneous.4 Secondly, even if the relative income distribution remains unchanged while average incomes grow, the food demand will grow faster in the lower income brackets due to their higher demand elasticity. This alone would make it likely that the CVs of food consumption would decline as average incomes and food consumption grow; similarly, one would presume that drastic rise in global food prices, as witnessed in 2007/08 and again 2010 would have a differential impact on food consumption patterns of different income groups, thereby affecting the CV.
More generally, fixing the CV also means that changes in measured hunger across the world will be driven by changes in the DES. This gives the erroneous impression that changes in hunger over time are largely a problem of ‘food availability’, rather than changes in entitlements (Sen, 1984) of different groups in the population to access to food. Situations where hunger in a population goes up despite stable or rising DES (e.g., due to a regional national catastrophe, rising food prices, conflicts, etc.) are ruled out by definition this way; any change in entitlements across population groups would immediately imply a change the CV. Thus to study hunger, one needs to examine entitlements of groups which can be affected as much by food prices, employment, and wages as by food availability in the country; such assessments would lead to a changing CV.
Lastly, a more technical issue is whether the CV is actually the best measure of dispersion to estimate and apply in this case. As is well-known, the CV is particularly sensitive to the distribution of calories in the upper parts of the caloric distribution. The use of the CV is consequently problematic for two reasons. First, it is not ideal to use a distributional indicator that will be heavily influenced by the distribution of calories among the ‘non-hungry’. Second, as a result of the sensitivity to high levels of caloric consumption, any measurement error among that group of ‘non-hungry’ will have an important impact on the resulting CV and the hungry. There are ready alternatives to the CV, including the Atkinson inequality measure (see Atkinson, 1970) or the Theil family of inequality measures which are both sensitive to the distribution of calories at the bottom end of the distribution, which is of interest here.
____________
3 This ‘plausible range’ is based on the analysis of realistic variances of food intake levels within hypothetical populations with highest and lowest food energy supplies per person.
4 See, for example, Gruen and Klasen (2003) for an analysis of these trends.
Minimum Dietary Energy Requirement (MDER)
The third key parameter of the FAO method, the minimum requirement of dietary energy, is defined as the consumption level that will balance energy expenditure. Questions raised regarding the approach concern the assumptions determining the dietary energy requirements of different age-sex groups and the rationale for a singular country-specific cutoff point.
(1) Are the assumptions determining the dietary energy requirements of different age-sex groups correct? Components of energy expenditure comprise the basal metabolic rate (BMR), i.e. the energy expended for the functioning of an individual in a state of complete rest; the energy needed for digesting food, metabolizing food and storing an increased food intake; and the energy required for performing light physical activities, both work and non-work. The BMR ranges between 1300 and 1700 kcal/day for adults, depending on age, sex, height and body weight, to which 55 or 56 percent are added for light activity of male and female adults, respectively. For children, the energy required for growth is taken into account. An allowance is also for children below age two from developing countries for the energy needed to recover from frequent infections. For women during pregnancy and lactation, the energy required for the deposition of tissue and secretion of milk is considered. As FAO specifies these dietary energy requirements in accordance with the recommendations by the Joint FAO/WHO/UNU Expert Consultation on Human energy (FAO, 2001), it is assumed that the assumptions are realistic. However, further research is needed to examine the realism of the assumptions in the light of various critical reviews.5
(2) Is a singular cutoff point a good approximation of a population’s minimum dietary energy needs? The minimum per capita dietary energy requirement is derived by aggregating the estimated sex-age-specific minimum dietary energy requirements, using the relative proportion of the population in the corresponding sex-age groups as weights. As the sex-age distribution of the population changes over time, this so-called cutoff point is being regularly adjusted to demographic change (FAO, 2003). Svedberg suggested that this method has a “built-in flaw that leads to biased estimates” (Svedberg, 2002, p. 6) because it fails to consider that even after taking into account the effects of age, sex, activity and body weight, individuals differ in their energy requirements due to differences in the efficiency of energy use. He suggests therefore replacing the singular cutoff point by a bivariate distribution according to which the probability of an individual not meeting the food energy requirements is not only determined by the distribution of food intake but also by the covariance between food energy intake and requirements. According to Svedberg, following this approach would as such result in a notably higher incidence of undernourishment. Responding to this criticism, FAO experts showed that if
____________
5 According to Svedberg, FAO uses a BMR that is unrealistically high for countries in the tropics, thus overestimating undernourishment (Svedberg 2002). In contrast, Smith et. al. (2006, p. 48) use energy requirements that are higher than those used by FAO, averaging 2050 kcal per day as compared to 1800 by FAO. This in itself could explain why Smith et. al arrive at higher estimates of undernourishment than FAO. While both approaches assume the same light activity level, they make different assumptions regarding the level of the requirements for given age-sex groups. FAO classifies a person as undernourished that consumes less than the minimum dietary energy requirement (MDER) for the respective age-sex group, whereas Smith et. al. classify all people as undernourished who consume less than the average requirement.
intake is indeed correlated with requirement, all intake levels falling within the range of variation of requirement are expected to match requirements so that the bi-variate formula reduces the cutoff point (FAO, 2003, p. 31). This discussion underlines the importance of further research on the best way of accounting for the non-determinate nature of food energy requirements.
Ex-Post Projections to the Current Year
Due to the delays in the availability of complete FBS data the FAO estimates are published with a considerable delay of three years. For example, SOFI 2010 covers the three-year-average of 2005-2007. Beginning with the 2008 edition of SOFI, FAO started publishing preliminary estimates that extend up to the year of publication. These estimates are based on ex post projections using recent data covering cereals, oils and meats available for human consumption. These commodities cover 80 percent of dietary energy supplies. The effect on undernourishment is projected using the historical statistical relationship between the quantities of those commodities and past estimates of undernourishment. The estimates are published at global and regional levels, not for individual countries.
This extension of the FAO method is a welcome response to demand for timely information and concerns about the impacts of recent developments, e.g. the soaring food prices on food security. However, an assessment of the methodology is not yet possible as a full documentation is not available. To which extent these ex-post projections anticipate the regular FAO estimates, can only be seen when the data for 2008 will be available in FAOSTAT. This will be the case for the first time in SOFI 2011.
Ex-Ante Projections Using The FAO Method
Occasionally, FAO also publishes ex-ante projections of undernourishment as part of its occasional long-term perspective studies for world agriculture. Basically, these projections derive the number of undernourished from projected per caput consumption, intra-national inequality of food availability, dietary requirements and population, using the same method as for the regular measurements.
In its latest long-term perspective study, FAO projected further increases of consumption levels for 2030 and 2050 (FAO, 2006). In spite of increasing energy requirements due to rising shares of adults in total populations and to growing body weights and heights a further reduction of the coefficients of inequality of food availability and a slowdown of population growth, a decline in the number of undernourished was projected. This positive trend is in obvious contrast to FAO’s own monitoring of recent developments, which show the number of undernourished on the increase in spite of growing per caput consumption. Alexandratos (2009) has recently undertaken an evaluation of the reasons for this discrepancy. After revising the earlier projections using all data and parameter revisions which FAO had to introduce due to adjustments of country reports (including higher population growth) up to 2003/2005, the revised projections came indeed rather close to FAO’s estimates for that three-year period, implying that the main reasons for false projections were subsequent parameter and data revisions. However, as both FAO’s ex-post estimates and ex-ante projections use the same concept, it is not really possible to draw conclusions for the real quality of projections As Alexandratos (2009, p. 20)
also states, “We cannot avoid posing the question whether the most recent estimates indicate a real reversal of the trend towards gradually and slowly declining numbers of undernourished or is it just data noise? “
Overall Assessment of the FAO Method
The best way of evaluating the accuracy of the FAO method is by way of examining the scientific soundness of the various assumptions and parameters, verifying the correctness of the data inputs and comparisons with other methods. The latter will be done in the subsequent parts of this paper.
The basic problem associated with the FAO method is presumably not the choice of the theoretical approach, but uncertainties and gaps in the data base and parameters. This is indeed a serious point as one can show that the global estimates react rather sensibly to even small changes in the key parameters (DES, CV, MDER), which could well lie within the range of normal confidence intervals. Figure I A-2 shows the results of some simulations, using the spreadsheet of the data inputs for the latest estimate of undernourishment in 2005/2007. As the Figure shows, the global number of undernourished responds particularly sensitively to variations in the key parameters, in particular the DES and MDER values. The elasticities of the global number of undernourished with regard to changes in the national DES, CV and MDER parameters are, respectively, 4.8, 1.6 and 4.7. As stated before, one conclusion so far is that more care should be taken in interpreting the year to year changes of FAO’s estimates.
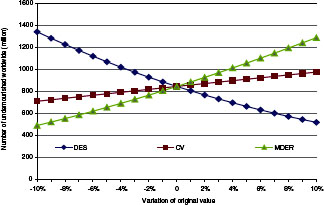
FIGURE I A-2: Sensitivity analysis of the three key parameters of the FAO method for 2005-2007.
The only comparable institutionalized system estimating food security of 70 developing countries is the regular Food Security Assessment by the USDA. Like FAO it compares food energy consumption with food energy requirements. While the estimates are based on FAO’s production assessments, the nutritional standards for food energy requirements are less differentiated and the cutoff points generally higher than those calculated by FAO. A full comparison of the two approaches is not possible due to different scenarios and assumptions. However, it is interesting to note that the USDA estimates of undernourishment in the 70 countries tend to be higher than those by FAO. (http://www.ers.usda.gov/Publications/GFA21/GFA21.pdf).
3. HOUSEHOLD CONSUMPTION SURVEYS
Survey Format Useful for Nutritional Analyses
Surveys conducted with the purpose of measuring household living standards usually contain a module on household expenditures. The reason is that expenditures are considered a more reliable indicator of living standards than income (Deaton, 1997). The World Bank also uses the expenditure modules for compiling its poverty statistics. Often, the general World Bank format for Living Standards Measurement Surveys (LSMS) is followed. But details of the survey instruments still vary between countries and situations. Nationally representative household surveys are usually planned and carried out by the individual countries’ statistical offices, sometimes supported by other national and international organizations. Depending on the size of the country and the resources available, they contain from a few thousand up to more than 100,000 household observations. For many developing countries, surveys are available for individual years, either through the national statistical offices or the World Bank (http://www.worldbank.org/lsms). In some countries, living standard surveys are carried out regularly, so that data sets exist for several years, while for other countries no data are available at all.
When the expenditure module of some living standard surveys only considered monetary values spent on broad aggregates of purchased goods (e.g., food, housing, transportation, education), these data can hardly be used for detailed nutritional analysis. This is the case for some countries, especially in older surveys. However, the survey formats have generally improved over time. Since poor people tend to spend a significant part of their total budget on food, expenditure modules of recent living standard surveys often comprise a relatively detailed breakdown of food expenditures, including food quantities and monetary values. In most cases, expenditures are defined broadly; in addition to market purchases, self-produced foods as well as food gifts and transfers are captured. Hence, all food that enters the household over a certain recall period is measured, so that a reasonable indicator of household food consumption can be
derived. This is also the reason why we use the term “household consumption surveys” here to refer to all living standard surveys that contain detailed information on food quantities consumed at the household level, regardless of the source.6
Summary Description of the Assessment Method
Data on the quantity of different food items consumed can be converted to calories and divided by the number of household members to obtain per capita calorie consumption estimates. Alternatively, consumption per adult equivalent can be calculated through weighting household members by age and sex. Comparison of these consumption estimates with energy requirement cutoffs allows one to identify households in which members are undersupplied with calories. In so far as surveys are nationally representative, the share of households in the sample falling under the cutoff can be interpreted as the prevalence of undernourishment in the country. This method has been used in the literature, mostly concentrating on individual countries (e.g., Dowler and Ok Seo 1985). It has not yet been used for providing a global overview of hunger and food insecurity.
The mentioned IFPRI study by Smith et al. (2006) has used such household consumption surveys to calculate the prevalence of undernourishment in 12 African countries. Smith et al. also proposed to use this approach to replace or improve the FAO method. Unlike FAO, which starts from macro level FBS, the survey based approach measures calorie deficiency at the micro level where it actually occurs. As fewer assumptions have to be made, and the micro data are more reliable in principle, the household survey approach has clear advantages over the FAO method. However, the approach is also not without its problems. In the following, we will discuss related advantages and disadvantages.
Advantages of the Consumption Survey Based Approach
When using household level data from high-quality and nationally representative surveys, the information on calorie consumption and deficiency of people is more accurate than when macro level data are used. The reasons are fourfold. First, food consumption is measured where it actually occurs, so that fewer assumptions about lacking data on agricultural production, trade, post-harvest losses and non-food uses have to be made. Commonly, household consumption surveys use 14 or 30 day recall periods for food items. Longer recall periods can lead to unacceptable inaccuracies. There are also a few consumption surveys that use a 7-day recall period, which is preferable from a nutritional perspective.7
____________
6 Other authors use the term “household expenditure surveys” in this connection (e.g., Smith et al. 2006). We prefer “consumption” over “expenditure”, because the term “consumption” makes more explicit that data on physical quantities of food are included and that self-produced and other non-purchased goods are also captured.
7 Another survey format is a 24-hour recall, which does not measure the food entering the household but the food actually eaten by household members during the past one day (Gibson 2005). Therefore, actual food intake is measured, which is more accurate than food consumption from a nutritional point of view. Twenty-four-hour recalls are often broken down by the different meals and snacks taken; sometimes, food intakes are also disaggregated by individual household members, so that issues of intra-household distribution can be analyzed (Haddad and Kanbur 1990). However, 24-hour recalls are usually carried out for specific nutritional purposes and are not included as part of standard living standard surveys.
Second, in household food consumption data—as opposed to FBS—the foods considered better reflect what is actually consumed (e.g., milled rice vs. unmilled paddy). Some consumption surveys consider more than 150 different food items, although there are also other surveys where the number is below 50. A high disaggregation of food items is generally preferable, because the conversion of food quantities into calories can be made with greater precision. This also allows one to go beyond calories and analyze the degree of dietary diversity or the prevalence of micronutrient deficiencies (Stein, 2006; Ecker and Qaim, 2010).
Third, unlike FAO, which calculates mean dietary energy supply at the country level and then assumes a distribution within the population to derive the prevalence of undernourishment, distributional assumptions are not necessary when household survey data are used. The reason is that the analysis is carried out for all households in the sample, so that the data themselves determine the distribution. This is also the reason why the household survey approach is sometimes referred to as a non-parametric method (Ricardo et al., 2007).
Fourth, while FAO uses data on the average population structure at the country level to derive minimum dietary energy requirements, the survey-based approach takes the actual demographic structure of households into account. This is one reason why the mean energy requirements may differ between the approaches.8
Beyond data accuracy, another big advantage of the survey based approach is that it allows a disaggregation of food insecurity by geographic areas or socioeconomic groups within countries. Such “hunger mapping” provides actionable information for policy responses at sub-national levels. Moreover, in addition to merely describing the situation of food insecurity, causes and determinants of undernourishment can be analyzed, because consumption and living standard surveys also include data on a multitude of socioeconomic household characteristics, such as educational levels, occupation, ethnicity, and infrastructure conditions, among others. Likewise, food consumption data can be used to determine the income and price responsiveness of food energy and nutrient consumption, which is crucial in order to predict nutritional impacts of policies and external shocks (Behrman and Deolalikar, 1987; Ecker and Qaim, 2010).
Disadvantages of the Consumption Survey Based Approach
While household surveys may achieve a higher data accuracy in general, there are also some weak points and disadvantages of the household survey method with respect to measuring energy and nutrient consumption. First, surveys that are carried out in a single round may not properly capture seasonal variation in food consumption.9 This can be a particular problem in rural areas where seasonal fluctuations in consumption are more pronounced than in urban areas. It should be stressed that many surveys account for this problem by collecting data in seasonal waves or by extending the survey over a 12 months period (Smith et al., 2006). If household surveys are evenly spread over the year, unbiased estimates of mean consumption levels may indeed be obtained, but the individual household data may still be biased.
____________
8 Other possible reasons include different assumptions about people’s physical activity levels and body mass index (FAO/WHO/UNU 1985, Svedberg 2000). Such assumptions have to be made irrespective of the underlying measurement approach.
9 As noted above, the FAO method is also not able to capture this variation.
Second, while food entering the household is captured relatively well, food eaten away from home is often not properly accounted for. In a survey, it may be relatively easy to elicit the value of outside meals consumed, but details about the exact food items consumed away from home, which are needed for converting into calories, are much more difficult to obtain. This can be of particular importance for households where members eat regular meals at work or in school. In such cases, actual calorie consumption will be underestimated (Bouis et al., 1992).
Third, and related to the previous point, in so far as consumption surveys measure the total food entering the household, they do not capture waste, losses and non food use within households. As some amounts might be fed to pets, wasted, or given to guests or hired laborers, one cannot rule out an overestimation of actual food intakes, especially in richer households (Bouis, 1994).
And finally, there may be non-sampling errors caused by general issues of misreporting and mis-recalling, un-completed questionnaire forms, retroactive corrections by enumerators etc. The risk of mis-recalling by survey respondents usually increases with the length of the recall period chosen in the survey format.
Some authors have also voiced more general criticism related to nutritional assessment studies based on household survey data, especially in terms of determining the prevalence of deficiencies using general cutoff levels (e.g., Gibson, 2005; Svedberg, 2000). Reference levels for energy requirements are defined for the average daily need over a reasonable – but usually unspecified – period of time that might not be properly reflected in a food recall. Moreover, they are defined for groups of individuals of the same sex, age, and physiological status and refer to intake levels required to maintain good health and development in healthy and well-nourished people on average (FAO/WHO/UNU 2001). Thus, the requirements are recommended to be applied to population groups rather than to individual persons or households. Therefore, when using survey data, results on the food energy status of individual households should be interpreted with caution, although results for the sample as a whole, or for certain sub-samples, should not be affected. Indeed, Smith et al. (2006) showed that summary results of household level analyses hardly differ from the results of more aggregate analyses for population groups.
Overall Assessment of the Consumption Survey Based Approach
The household survey based approach has several advantages over the FAO method, especially in terms of the micro level data being used, which captures household food availability and access much better than is possible with food balance sheet data and distributional assumptions. Analysis based on household consumption surveys also yields more actionable information, because the results can be presented in a disaggregated way and used for policy analysis and predictions of nutritional impacts of shocks and policy changes at sub-national levels. Another plus is that the household data are collected and owned by national statistical offices, so that a bigger degree of national ownership is likely when these data were to be used for a global food security assessment by international organizations. However, a clear limitation for using household consumption surveys for regular global food security assessments is the bigger amount of data required as well as its timeliness. While the availability of living standard surveys has improved significantly over the last 10 years, there are still many countries for which no nationally representative food consumption data are available at all, let alone a
series of updated surveys in regular intervals. Until all countries can afford to conduct representative national household surveys on a periodic basis, this approach to measuring hunger cannot substitute but merely provide a complementary perspective to the FAO approach based on FBS.
4. ANTHROPOMETRIC MEASUREMENTS
While the first two approaches to measuring food insecurity and malnutrition essentially measure inadequate food consumption at household level as a proxy of poor nutritional status of a population, anthropometric measures assess the nutritional outcomes at the level of the individual. The schematic diagram below illustrates these linkages. It shows that one need not presume that measuring food consumption or nutritional outcomes will produce similar results. There are range of intervening factors that affect the transformation of food availability and food purchases into nutritional status. Among them are intra-household losses, unequal intra-household distribution, and, most importantly, heterogeneity at the household level in transforming food intake into nutritional status which will depend on the difference in disease exposure, activity levels, and individual heterogeneity in metabolism and food processing. Also, the anthropometric approach is non-specific with regard to which particular nutrients might be lacking (or in excess supply). Thus these approaches are essentially measuring different concepts that may, however, complement each other. In this section we will discuss the methods and advantages and disadvantages of anthropometric indicators. The section will draw heavily on Klasen (2008) where these issues are discussed in some more detail.
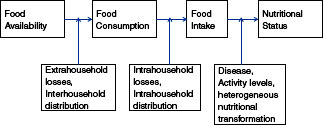
FIGURE I A-3: Levels of measuring different aspects of food and nutrition insecurity.
Indicators of Anthropometric Measurement
While there is a very broad range of anthropometric measures that can be used for an assessment of nutritional status (see WHO 1995), the most commonly used indicators all relate to height and weight of individuals. Given that height is unchanged for adults but changing for children, anthropometry has different indicators for both groups. In fact, the greatest consensus
as far as assessing anthropometric status is concerned, exists using anthropometric indicators of children aged 0-5; they will therefore be the focus of the discussion here. The three different most commonly used indicators, stunting, wasting, and underweight offer insights on different dimensions of nutritional problems. Wasting (low weight for height) is an indicator of acute undernutrition particularly relevant in famines and to monitor acute food shortages. Stunting (low height for age) is an indicator of chronic undernutrition focusing on persistent nutritional deficiencies, and underweight (low weight for age) is a summary indicator combining both facets.
These indicators are usually determined with the help of a Z-score, which is calculated by dividing the difference between the age-and sex-specific anthropometric indicator of an individual child (e.g., height of a girl aged 38 months) and median of the same indicator from a reference population by the standard deviation of that indicator in the reference population.10 What this indicator thus measures is the distance (expressed in standard deviations) of the anthropometric performance of the child from the median of the reference population. If the Z-score is less than -2, moderate undernutrition is assumed, if the Z-score is less than -3, severe undernutrition is held to exist (UNICEF, 1998).
Two points are worth noting. First, the cut-offs are chosen with a probabilistic interpretation. A Z-score of -2 suggests that, given genetic variability, there is a roughly 95 percent chance that the individual child is indeed suffering from undernutrition. If this interpretation is used, the type II error of this assessment is huge, i.e., most children with a Z-score of between 0 and -2 (and quite a few with a Z-score above 0 but with genetically tall or heavy parents) could well be suffering from undernutrition which would systematically underestimate childhood undernutrition at the population level. An alternative interpretation of the choice of these cut-offs is that only serious nutritional deficiencies relative to the standard should be counted as undernutrition, and thus children with a Z-score between 0 and -2 should not be included.11
Second, the calculation of the Z-score critically depends on the reference standard. Until 2006, the recommended reference standard had been constructed using two sets of children from the US. For a number of conceptual and technical reasons (see WHO, 1995), this standard was seen as problematic and in 1994 WHO decided to undertake a multi-center child growth study to derive a new reference standard (WHO, 1999).
Such a new international standard was recently published in 2006 (de Onis and Garza, 2006). It is based upon the growth and weight development of children in six countries (Brazil, Oman, Ghana, India, USA, and Norway) where a sample of children was monitored that followed WHO feeding guidelines and were not constrained by inadequate access to nutrition or health care. In the four developing countries, this involved selecting children from extremely well-to-do backgrounds to ensure that they were not in any way hampered in their growth potential (WHO, 2006b).
____________
10 This was the exact procedure when the old reference standard was still being used; since the new reference standard is not exactly normally distributed, the calculation of the Z-score is a bit more complicated to reflect the deviation from normality.
11 In addition, interpreting a Z-score of an individual child generates further problems as there clearly are genetic influences of the parents on weight and height of their children. Thus individual children might be falsely identified as well nourished or undernourished. Thus using these cut-offs can only usefully be applied at higher levels of aggregation where presumably these inter-individual genetic differences cancel out.
Two further points are worth noting. First, in contrast to the previous standard which was based on the descriptive height and weight development of two samples of U.S. children, the new standard is explicitly constructed as a ‘normative’ standard of ‘optimal’ child growth and weight development (de Onis and Garza, 2006). To achieve this, only children were enrolled in the study where parents were of high socio-economic status, were non-smokers and (largely) followed the WHO recommendations on infant and child feeding (including particularly the use of exclusive breast-feeding). In addition, children that fell ill, were obese, or strongly fell behind in growth and weight gain were dropped from the final calculation of the standard. Second, since the growth and weight charts of the children in the six countries looked very similar, a decision was taken to pool them to create a single new growth standard from the pooled data (WHO, 2006a).12
As a result of using different populations and these various changes in the approach to generating a standard, the switch from the old to the new growth standard has typically meant that rates of stunting and wasting have gone up while rates of underweight have gone down (e.g., Misselhorn, 2010; Drèze and Deaton, 2008).
For children beyond five years of age and adolescents, there is no similar consensus on a growth reference standard. Also it appears that genetic differences and, in the case of girls, the age at menarche which varies across populations makes it quite difficult to design a universal growth standard (e.g. WHO, 1995; Butte et al., 2007).
For adults, there is also not such a clear consensus on what anthropometric status constitutes undernutrition. Generally, recourse is made to the body mass index (BMI), defined as the weight (in kg) divided by the square of height (in meters). Usually a BMI below 18.5 is seen as indicating undernutrition (and one below 17.5 is severe undernutrition) but generally the heterogeneity across age, gender, body composition, climate and populations make it difficult to use them as definitive measures of undernutrition. Also, it is not clear to what extent undernutrition using the BMI in adults and undernutrition using wasting and underweight among children are comparable (WHO, 1995; Klasen, 2003).
A final general note is on data availability. Data for childhood anthropometry are collected at regular intervals across the developing world using the highly standardized and high quality Demographic and Health Surveys (DHS, supported by USAID and implemented by MACRO Inc. and national agencies in the respective countries) and related Multiple Indicator Cluster Surveys (MICS, implemented by UNICEF, often in collaboration with national agencies). These surveys use a standardized protocol to measure and weigh children, they are always based on national random (clustered) samples, sample sizes vary from some 3000 to over 100,000 children and they are done at rather regular intervals (usually every five years). Virtually all of these data are freely available in the public domain and are usually published 6-18 months after the field work is completed. Now there are several hundred surveys available for about 100 developing countries, in some cases spanning 6-8 time periods (particularly if the earlier World Fertility Surveys are also included). In fact, childhood anthropometric data are thus much more broadly available (using comparable methods and procedures) than household survey based assessments of food consumption discussed above. Unfortunately, DHS and MICS cannot be
____________
12 The complete and selected sample of micro data is not yet available beyond the research team that contributed to the new sample so that one cannot precisely identify possible biases that might have arisen from the selection procedures.
merged with data from household consumption surveys, because the two survey approaches are implemented separately by different organizations and based on different samples. There are only very few nationally representative surveys in individual countries that contain both anthropometric and food consumption data.
Advantages of Using Anthropometry Measurements
The use of anthropometry in general, and childhood anthropometry in particular, for the measurement of food insecurity and undernutrition has much to recommend.
First, it is measuring directly what we are essentially interested in: how malnutrition affects the health and well-being of individuals. There is overwhelming evidence that malnutrition that generates poor anthropometric outcomes is a causal factor in leading to higher morbidity and mortality (Pelletier, 1998; Osmani, 1990; Drèze and Deaton, 2008). As children’s development (physical and mental) is particularly vulnerable to malnutrition, it is also quite appropriate to focus on childhood anthropometry as a particularly important indicator of undernutrition.
Second, the availability of three different measures gives a good sense of chronic as well as acute undernutrition. It is therefore no surprise that relief organizations regularly use childhood anthropometry to monitor the success of relief operations in emergencies across the (developing) world.
Third, as the data also come from household surveys (mostly DHS and MICS), it has the great advantage that one can (if sample sizes allow) immediately disaggregate undernutrition by groups and regions and thus identify the groups and localities particularly affected by undernutrition.
Fourth, the base in household surveys also allows a direct use for analyzing the causes of undernutrition. The surveys include a wide variety of other variables that can be (and have been) used regularly to assess the factors driving undernutrition. In fact, there is a vast literature that has developed as a result of the wide availability of these indicators of undernutrition using the DHS and MICS (e.g. Smith et al., 2003; Foraita et al., 2009; Kandala et al., 2010). Correspondingly, these surveys can then also be used to design and monitor interventions to reduce undernutrition.
Fifth, the data availability on childhood anthropometry is unusually good with broad and relatively timely coverage for nearly all countries of the world. The use of standardized procedures of the two survey programs (and their policy to make data available free of charge) have made anthropometric data particularly widely available in a highly standardized format so that monitoring of childhood anthropometry using these indicators is feasibly across space and time in ways that is currently not possible using household food consumption-based methods.
Disadvantages of Using Anthropometric Measurements
Despite these advantages, there are a range of issues and problems associated with the use of anthropometry as indicators of childhood undernutrition. Some can potentially be remedied, others are somewhat harder to address.
First, while it is useful to track nutritional outcomes, poor anthropometric status can be the result of things that are unrelated to food security, such as presence of diseases. So we cannot be sure that a country or region with poor anthropometric indicators is necessarily an area where there are food security problems. So depending on what we are interested in, this can be a disadvantage (see first advantage above for a different perspective).
Second, while coverage is wide and timeliness quite impressive, anthropometric indicators are usually only generated every 3-5 years in a country, in some countries even only every 10 years. They can therefore only be used for medium-term assessment of nutritional problems, not for identification of short-term crises or reliable annual statistics on global hunger.13
Third, the focus on children neglects, of course, problems of food security among adolescents and adults which may be more or less severe in particular country contexts.
Fourth, small sample sizes often preclude careful disaggregation of anthropometrics by sub-groups or regions or make them statistically unreliable. Related to that are the usual problems of household surveys including the problems of drawing adequate samples in countries where census counts are often not reliable (and lead to great revisions from census to census) so that different samples can lead to incomparability over time (e.g. Drèze and Deaton, 2008).
Fifth, while the surveys used to measure anthropometric shortfalls are quite comprehensive, they lack some critical covariates to better analyze the determinants of food insecurity and undernutrition. Most serious is that neither the DHS nor the MICS include an income or expenditure module. As a result, most studies using these surveys use an asset index as a proxy for income, which partly remedies this issue but does not enable a link to food consumption patterns (e.g. Filmer and Pritchett, 2001). While these are all serious issues and drawbacks, possibly the most serious issues are the following last two we mention here:
Sixth, changes in nutritional practice, often referred to as the nutrition transition, might affect the reliability of anthropometry as indicators of nutritional status. In particular, the worldwide move towards food with a high content in starch, fats, and sugar may affect the way one ought to measure undernutrition. In particular, weight-based measures might be affected by this shift. In the new growth standard, overweight and obese children were excluded as they are not deemed ‘well-nourished’; this procedure has the advantage to be able to more easily identify children suffering from overweight and obesity (including children that are simultaneously stunted and overweight) in the new standard But it can generate problems of interpretation when identifying underweight children. Due to the nutrition transition, many children who have poor access to nutrition and are malnourished still gain sufficient weight as the calories they receive have a high starch, fat, and sugar content. These children, when compared to the WHO growth standard (which excluded overweight and obese children) appear as adequately nourished even though they might not be. As shown by Misselhorn (2010), it appears that underweight indicators, currently the only anthropometric indicators included in the monitoring of MDG One, are improving over time more rapidly than other anthropometric indicators due to this effect and might suggest greater progress in reducing undernutrition than is warranted; stunting, on the
____________
13 Of course, one can use extrapolation and intrapolation to generate more up to date estimates with broader coverage, as is done for the global poverty counts (e.g. Ravallion and Chen 2008). But a range of possibly debatable assumptions would be required.
other hand, moves much more slowly and might therefore be a preferred indicator of undernutrition that is less affected by the biases introduced by the nutrition transition.
Lastly, there is the question whether one single growth standard is really appropriate for the measurement of children all over the world. The claim that one standard would suffice was backed up by a variety of individual studies and the editorial opinion of major medical journals (e.g., Lancet 1984, Graitcer et al., 1981; Habicht et al., 1974).14 This view of one reference standard for all children in the world has influenced the development of the new international reference standard (WHO, 1995 and 1999), but it has never been fully accepted by everyone (e.g., Davies, 1988; Eveleth and Tanner, 1990; Bogin, 1988; MacFarlane, 1995). While all agree that environmental factors are much more significant than genetic differences in explaining differences in anthropometric shortfall between populations, quite a few studies suggested that genetic differences are important enough to be considered, particularly for international comparisons of anthropometric shortfalls. Also, it is widely accepted that genetic differences affect the growth and weight development of children beyond 6 and adolescents (e.g., Butte et al., 2007; WHO, 1995).
In this context, it should be pointed out that the preferred measure for international comparisons, the share of children below a Z score of -2 or -3 is highly sensitive to even small differences in the reference standard.15 In a population such as South Asia’s, where about 50 percent of the population were stunted or underweight in 2000, a difference of only 1 percent in the reference standard would lead to an 8 percentage point drop in the share of underweight children. If we believed the difference is 3 percent, South Asia’s rate of undernutrition in 1990 would have been below the rate observed for Sub-Saharan Africa in that year, where there is little evidence of a similar genetic difference in the growth of children, compared to the USA.16 Thus a large share of the South Asian undernutrition enigma would simply disappear if the reference standard differed by just a minor amount.17 The data used to create the new standard shed an interesting light on possible inter-population differences in child growth, suggesting that (small) genetic differences appear to exist but which needs further research.18 For example, from
____________
14 This was supported by studies showing that the difference in growth and weight gain between privileged children from developing countries and the US reference standards were very small (Martorell et al. 1988, Habicht et al. 1974, Graitcer et al. 1981, WHO 1995, Ramalingaswami et al. 1996, Bandhari et al. 2002).
15 For example, even those who favor one standard suggest that genetic differences between South Asian and US children amount to about 1 cm of height difference by age five (WHO 1995). Other researchers believe that the difference is a bit larger, on the order of 1-3 cm between well-to-do children in the USA and in South Asia (Bogin 1988, Davies 1988, Eveleth and Tanner 1990, MacFarlane 1995). One cm constitutes less than 1% of the median height at age 5 for boys (109.9 cm), and even 3 cm would be less than 3% (WHO 1983).
16 In fact, there is some evidence suggesting that African children grow faster (e.g. Martorell 1988, MacFarlane 1995) than US children; others suggest that the variability of growth and weight gain in Africa is much larger than elsewhere, related to the higher genetic diversity of Africa’s populations, which in turn is consistent with humanity’s origin in Africa (Kidd et al. 1996). This would make a single standard from the USA not suitable to assess undernutrition in the genetically more diverse African context.
17 The reason for this surprising sensitivity of the undernutrition rates to small changes in the reference standard is related to the fact that in a country with high undernutrition rates, the mode of the Z-score distribution is close to the cut-off of -2.
18 Even though the selection procedure of enrolling children was such that it would minimize and possibly bias downward inter-population differences, it nevertheless remains the case that small differences between the countries considered are found. As shown in WHO (2006c), mean heights in India and in Oman are between 0.5-2% smaller than in the pooled sample at different ages, and the differences are about twice as large compared to children in
Bandhari et al. (2002), who assess the Indian sample of children, one can deduce that the children in the sample used for the new reference standard had an average Z-score of -0.45 (compared to the old reference standard). This would be roughly equivalent to a 3.5 percent lower weight for age of these children compared to the new standard, thus confirming a genetic difference of about 3 percent in weight.
These pieces of evidence suggest that the consensus in the literature of about 1-3 percent lower growth potential of South Asian children compared to children in the US, Europe, or Africa continues to hold. Applying one reference standard might therefore, in a comparative sense, overestimate undernutrition in South Asia by between 8-20 percentage points.19
Overall Assessment of Anthropometric Measurement Approaches
Despite the mentioned disadvantages, it is clear that anthropometric evidence provides critical insights into the prevalence and development of undernutrition across the world. Particularly childhood anthropometry is well developed with clear methods, indicators, and available data that can be used for studying the prevalence and drivers of undernutrition, and also to assess the impact of policies on undernutrition outcomes. It is eminently possible and useful to use these indicators to measure and analyze undernutrition.
At the same time, data availability and timeliness, the issues regarding the nutrition transition, and the question of genetic differences pose some difficult questions regarding comparisons across space and time of these indicators. On the availability, timeliness and completeness of the survey instruments, improvements are feasible. The most obvious improvement would be to regularly link household surveys that contain income and expenditure (consumption) modules with anthropometric surveys. Currently these survey programs run separately and some integration would clearly be possible. Regarding the other issues, more research is needed to assess to what extent one can remedy the possible biases introduced by the nutrition transition (where recourse to the stunting indicator might be the preferred solution) and genetic differences across populations.
5. COMPARING THE THREE METHODS
Contradictions and Complementarities between Indicators
We already commented above on the apparent incongruence between assessment of food insecurity based on the FAO method and food expenditure/consumption based methods for a sample of Sub-Saharan African countries. The IFPRI study showed higher rates of food
____________
Norway and Brazil, the tallest group in the sample. Particularly is also that 5 year old children in India were about 2% shorter than in Ghana.
19 To be sure, this would not suggest that undernutrition is not a problem in South Asia; nor would it be able to account for the puzzling finding that undernutrition rates are falling very slowly there despite high economic growth. On this, see Drèze and Deaton (2008) for a discussion.
insecurity using household consumption surveys and a different ranking of countries (Smith et al. 2006).
Similar problems appear when comparing the FAO method with indicators of childhood anthropometric shortfall. While one would, for reasons discussed above, not assume a perfect congruence, the divergence in the regional distribution of undernutrition using these two approaches is staggering. Figure I A-4 below shows a scatterplot of undernourishment rates using the FAO method and the prevalence of underweight children for a sample of countries around the year 2000. The correlation is quite weak. Of particular note are the remarkably high rates of underweight in countries of South Asia, compared to their much better performance in terms of the FAO undernourishment indicator. Conversely, in many Sub-Saharan African and some Caribbean countries, undernourishment is high but underweight comparatively moderate.
The problem is compounded when one confronts childhood underweight rates with under five mortality rates for the same sample of countries (see Figure I A-5). Given the health problems associated with undernutrition, one would expect a fairly strong correlation, but again the correlation is not as strong as one would expect. Of particular note is that now the South Asian (and some East Asian) countries stand out with particularly high childhood undernutrition but comparatively low under five mortality rates.
The puzzle of the high childhood undernutrition indicators in South Asia has commonly been referred to as ‘the South Asian enigma’ (e.g. Ramalingaswami et al. 1996). Some have suggested that it is related to low status of women there, leading to the poor anthropometric outcomes for children. Yet even the most careful assessment of this factor available to date (Smith et al. 2003) was unable to explain the high rates of childhood undernutrition there, even once women’s status was explicitly accounted for. In fact, Klasen (2008) has shown that crosscountry models of explaining undernutrition regularly fail to explain the high rates of undernutrition in South Asia, corroborating the suggestion that comparability issues associated with the reference standard might be empirically relevant as well. 20
Thus major unanswered questions remain regarding the actual regional distribution of food insecurity and undernutrition and much may be related to the shortcomings of the various indicators which we discussed above.
____________
20 As already mentioned above, there is a second South Asian enigma referring to the very slow improvements in anthropometric indicators despite rapid economic growth and poverty reduction. This cannot be due to possible problems with anthropometric standards and is similarly puzzling as the already reported decline in per capita food consumption referred to above. See Drèze and Deaton (2008), among others, for a discussion.
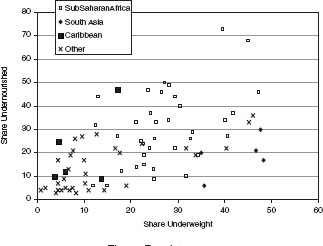
FIGURE I A-4: Undernourishment and childhood underweight rates in 2000. SOURCE: Klasen (2008)
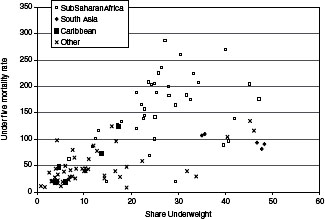
FIGURE I A-5: Childhood underweight and under five mortality rates 2000. SOURCE: Klasen (2008).
The Three Key Methods in Comparison
All three indicators discussed—the FAO approach, the household food consumption survey based approach, and the anthropometric approach—have their strengths and weaknesses, but the evaluation also much depends on the specific purpose in mind. Table I A-1 tries to summarize how each approach performs with respect to different criteria that we consider important. The assessment is based on the indicators as they are currently being used and on present data availability. As can be seen, the different approaches are complementary. Each approach, as well as data availability, can be improved, which might change the performance related to some, but not all, criteria. Such possible improvements are discussed in section 6.
TABLE I A-1: Performance of three assessment approaches as currently in use with respect to different criteria
| Criterion | Undernourishment (FAO approach) | Consumption survey | Anthropometry |
| Ability to draw a regular picture for total global, regional and national populations | ++ | - | + |
| Ability to draw a regular picture for special population groups at global level | - | - | ++ |
| Usefulness to assess inequality of food consumption within countries | -- | ++ | -- |
| Usefulness to assess consumption consistent with national supply and demand | ++ | - | -- |
| Accuracy in terms of measuring the adequacy of food intake | + | ++ | -- |
| Accuracy in terms of measuring and identifying determinants of nutritional status at a point in time | - | + | ++ |
| Accuracy in comparing nutritional status across space and over time | -- | + | ? |
| Ability to assess dietary diversity and micronutrient status | -- | ++ | - |
| Ability to portray regional and socioeconomic heterogeneity within countries | -- | ++ | ++ |
| Ability to portray seasonal variation | -- | - | - |
| Ability to inform global governance | ++ | - | ++ |
| Usefulness to guide national policy decisions (e.g., targeting) | -- | + | ++ |
| Usefulness to simulate nutritional impacts of policies and shocks at country level | -- | ++ | - |
| Notes: + and - signs indicate whether or not the approach is suitable. Double signs indicate very suitable or very unsuitable. | |||
As can be seen, none of the three approaches has a clear advantage in meeting all criteria. In particular, there is no conclusive evidence regarding the accuracy of the three approaches in assessing the prevalence of undernourishment or undernutrition. The consumption survey and anthropometric approaches have clear advantages over the FAO method in several criteria, especially in terms of measuring diversity and heterogeneity within countries. Although currently hardly done, they could potentially serve to generate even more information that is important for a complete assessment. For example, household consumption surveys are potentially very useful to assess dietary diversity and micronutrient status.
While the analysis so far leads to the conclusion that there are several reasons to suspect that the FAO method generates biased estimates, the direction of the likely biases cannot currently be conclusively stated. On the other hand, the approach has the advantage of drawing a regular picture, consistent with national aggregate food production and trade statistics, of undernourishment for the population as a whole at national levels and above, which may be useful for global governance and discussions on hunger and ways to combat it.
6. OPTIONS FOR IMPROVING FOOD SECURITY AND NUTRITION INDICATORS
In 2002, FAO organized an International Scientific Symposium on Measurement and Assessment of Food Deprivation and Malnutrition, which considered all major methods including qualitative methods for measuring people’s perception of hunger. There was wide consensus that “no single method can capture all aspects of hunger while at the same time providing policy-makers with relevant and timely information in a cost-effective manner” (FAO, 2003, p. XV). Accordingly, the Symposium concluded that a ‘suite’ of indicators was needed to cover the different dimensions of food security. We believe that this conclusion is still valid.
One of our central suggestions for improving and broadening the empirical data base is running more surveys. In the longer term, a regular availability of results from representative surveys could greatly enhance the worldwide information on food insecurity and malnutrition and reduce the need for additional indicators derived from macro food balance sheets. However, even if this suggestion is followed, data availability would only improve gradually. Moreover, the possibility of inconsistent and non-representative household data could still not be ruled out. Therefore, our recommendations are twofold. First, the FAO method should be improved through better data and more transparent science-based assumptions. Available data from household consumption surveys can be used to improve the FAO parameter assumptions. In this connection, lessons about how to deal with missing data through interpolation can be learned from the World Bank, which uses living standard surveys to compile global poverty statistics and updates in certain intervals. Second, household consumption survey and anthropometric approaches should be further improved, both conceptually and through improved data bases. These recommendations are further elaborated in the following.
Improving the FAO Indicator
At the outset it should be noted that the experts in the FAO Statistics and Agricultural Development Economics Divisions are currently fully aware of the weaknesses in the methodology for estimating undernourishment. Work is underway to improve both the data base and part of the methodology. Many critical points need to be addressed of which several are currently under consideration in FAO. Of importance are in particular the following:
Food consumption: Continuing the overall reform of FAOSTAT with the view to improve the quality and consistency of all data inputs for the FBS. The aim should be to improve the estimates of daily dietary food energy supplies. Whereas consumption has so far mostly been compiled as the balance of supply-utilization accounts (SUA) for the various commodities and foods, efforts should be promoted, working with national authorities, to reconcile the estimates with survey data. Improved estimates will also be needed for other significant components of the FBS, namely food waste and losses inside households and commercial kitchens. Given the overwhelming importance of the DES estimate for the FAO hunger measure (and many other important uses of these data), improvements in the accuracy of these estimates is a top priority.
Intra-national inequality of food consumption: Examining the validity and updating of the coefficients of variation (CV) of food consumption. Efforts currently underway in FAO to improve the measures of inequality using household surveys are to be supported. Close cooperation with national and international organizations conducting such surveys is recommended so as to ensure consistency of the foods included and possibility of regular updates to reflect change of CVs over time.
Minimum dietary energy requirements. Continuing inter-agency cooperation to determine best science based estimates of MDERs. Regular updates are needed to reflect the effects of changing age structures (in particular rising shares of adults in populations) and changing heights and weight standards.
Moving Beyond the FAO Indicator
Even with the suggested improvements, the FAO method would not satisfy all information needs with regard to food insecurity, nor would it suffice to provide policy makers with actionable information needed to address the main obstacles to overcoming hunger and malnutrition through effective food security strategies at country level. For these purposes, consumption surveys and anthropometric measurements are much more useful, but there is also substantial scope for improvement of these approaches. In our view, the most important ones are the following:
Data availability: Improvements are required, especially with respect to nationally representative household consumption surveys, which are usually integrated in more comprehensive living standard surveys. Such living standard surveys with sufficiently disaggregated food consumption modules should be carried out more frequently, and in a larger number of countries, to improve the micro level information base. This will require additional
resources, but such data can be used for a variety of purposes. Beyond the food security context, nationally representative household surveys can be used for tracking all sorts of developments at the micro level and for planning and evaluating policy interventions. To the extent possible, the survey formats should be standardized internationally.
Anthropometric measurements: Here the data base is much better, but anthropometric surveys contain little other socioeconomic variables and no information on food consumption. As nutrition, health, consumption, and income are so closely related, we propose linking anthropometric surveys with household living standard surveys. This will not only help improve the understanding of food security issues, but will also constitute a precious resource for broader micro level research related to food, nutrition, health, demography and overall welfare.
Research: There are a variety of conceptual issues related to appropriate assumption for minimum energy requirements, anthropometric standards etc., which need further research. Integrated research that compares food intake and nutritional outcome indicators, controlling for other health-related aspects, would be particularly useful to better understand the existing contradictions and complementarities and improve the methodologies. This requires the proposed link between (or integration of) anthropometric and household living standard surveys.
Dietary diversity: More research is also required beyond a calorie focus, to better understand the role, determinants, seasonality and appropriate measurement of dietary quality and diversity. A simple count of different food groups consumed by households (food variety score) has been proposed as a good indicator of nutritional status and even of food security more generally, but questions remain on advantages, drawbacks and limitations of such dietary diversity measures in particular situations (Ruel, 2003). Such research would also benefit a lot from a wider availability of nationally representative linked anthropometric and food consumption data.
Depth of hunger: In SOFI (2000) FAO had published estimates of ‘depth of hunger’, defined as the extent to which consumption levels of the undernourished fall below requirements. For example, it was shown that, in 1996-1998, 46 percent of countries in Sub-Sahara Africa had an average depth of more than 300 kcal per person per day, whereas this depth was only found in 16 percent of countries of Asia. Publication of this measure was not continued in later issues of SOFI. Indeed, while information on the depth of hunger is of great interest for comprehensive assessments of the state of food insecurity, compiling such an indicator can only add value if the estimates are derived from empirical data with regard to people’s real consumption and not from assumptions about the intra-national inequality of food consumption. More research is needed in this field and a resumption of depth of hunger compilations could be considered once the compilation and regular updating of empirically reliable CVs of food consumption has been completed.
Policy impact simulations: Concerning the simulation of nutritional impacts of policies and shocks at country level, household food consumption data currently seem to constitute the best starting point. Since these surveys also contain information on food prices and household incomes or total expenditures, calorie price and income elasticities can be estimated for the population as a whole as well as for population subgroups. These elasticities, together with the results on household food security, can then be used to predict changes in the prevalence of undernourishment due to price and income changes. Ecker and Qaim (2010) have recently developed such an approach, which beyond calories also captures micronutrient deficiencies and
related price and income elasticities. Anriquez et al (2010a and b) have also used household survey data to assess the possible effects of staple food price increases on households’ food consumption and undernourishment. Of course, there is scope for improvement, but in general the approach seems useful to simulate micro level nutrition effects of food price spikes or economic crises to identify short-term problems that cannot wait for the assessment based on a new household survey. If living standard surveys were linked with anthropometric surveys, as proposed, then such analyses could be extended to also simulate impacts of policies and shocks on the prevalence of child underweight, wasting, and stunting.
7. CONCLUSIONS
Improvements in the metrics of food insecurity and malnutrition are not only urgently needed, but also possible. This assessment of available methods has shown various entry points for improvement. A consistent and fully transparent process is recommended, comprising additional research and stepwise updating of the various indicators. The aim would be to develop an “Integrated Suite of Indicators,” in line with the recommendations already made by the International Scientific Symposium on Measurement in 2002. Such a suite would eventually use an improved data base to calculate a reformed FAO hunger indicator, combined with survey and simulation-based estimates of hunger using household expenditure surveys, linked with anthropometric surveys. The proposed process could involve the following three steps:
The agencies involved in the collection of relevant data and compilation of relevant indicators should collaborate through active networking. An example for an appropriate institutional framework for such networking could be the emerging global Food Security Information Network (FSIN), which is currently being developed by FAO, WFP and IFPRI. It links the past FAO FIVIMS work with the new FAO corporate strategy on Information Systems for Food and Nutrition Security (ISFNS). This is a promising initiative which could eventually be expanded to include agencies like WHO, UNICEF, World Bank and the EU Commission.
A complete inventory of estimates of relevant national indicators of food insecurity and malnutrition should be established, published, and regularly updated. This could not only include the main indicators, the food balance sheet approach of FAO, household surveys and anthropometry, but also, as available, other useful indicators such as micronutrient deficiency and dietary diversity. The inventory would contribute to greater transparency and enable more comprehensive comparative assessments, identification of complementarities and contradictions between indicators and areas requiring further research and data improvement. An appropriate online portal would have to be found. One possible location of such a Portal for consideration by the relevant agencies could be FSIN mentioned above.
A major and coordinated effort is also recommended towards enhancement of the empirical data base, comprising all data relevant for measuring food insecurity and malnutrition. More specifically, the following steps towards improving the quality and the accessibility of the database are recommended:
- Continue the current review of the food balance sheet data base in FAO. This will play a major role in efforts to improve the accuracy and reliability of aggregate food consumption data. The FBS approach has the advantage of generating consumption data consistent with
- Reconcile data on food consumption derived from FBS and from household surveys. In principle, mean levels of consumption per person derived, respectively, from national FBS on and from representative household surveys should be similar. It is hoped that where both types of estimates are available for the same countries, the proposed inventory of data may serve to identify major reasons for differences and entry points for resolution of those differences. Eventually, improved and representative household survey based estimates of food consumption could substitute for the use of FBS in more and more countries.
- Enlarge the country coverage and frequency of household living standard and anthropometric surveys so as to broaden the empirical base, including assessments of changes over time and comparisons between countries.
- Harmonize the formats used for household living standard and anthropometric surveys so as to facilitate comparisons over time and space.
- Coordinate the sampling frames of household living standard and anthropometric survey, or even merge both survey types, so as to facilitate comparison of different food insecurity and malnutrition indicators and enable important research on economic-nutrition-health linkages.
- Parallel to establishing an inventory and improving the data bases, a systematic improvement of methods and assumptions is recommended for all three principal indicator methods, making use of the latest findings in nutritional science and following up, inter alia, on the various suggestions made in this paper. Such an assessment should also include a careful assessment of the reliability and comparability of cut-offs currently used to determine inadequate access to calories, nutrients, as well as to determine nutritional status. Ongoing improvement efforts should be enhanced.
- More efforts should be made to use existing intergovernmental platforms for advocacy and support of work with indicators of food insecurity and malnutrition. The most prominent examples are the Committee on World Food Security (CFS) and the United Nations System Standing Committee on Nutrition (SCN).
Effective action towards such improvements requires political will of governments and governing bodies at regional and global levels, including the Committee on Word Food Security (CFS), which has just been reformed “with the aim to become the central United Nations political platform dealing with food security and nutrition”. Accurate knowledge about who is food insecure, where they live and why they are food insecure and malnourished is a central precondition for effective action at all levels.
Improving metrics of food insecurity is also a contribution to the monitoring of the realization of human rights. As stated in the background document for the World Summit on Food Security in 2009, “where the existence of hunger and malnutrition results from negligence or ignorance by responsible policy-makers, it is also a violation of people’s basic human right to adequate food and to a life in good health and dignity” (FAO, 2009).
It is encouraging to note that the weaknesses of the current metrics of food insecurity and malnutrition have been recognized by the agencies concerned, in particular the FAO, which is currently undertaking a fundamental review of the data and methods with the aim to improve them. We recommend that FAO interact closely with other relevant agencies, in particular WHO, UNICEF and World Bank, as well as with national governments to ensure broad support, consistency and mutual complementarities of the improvements.
With the current state of evidence it is safe to conclude that the available estimates of chronic hunger are inaccurate, but it is not possible to conclude whether the real number of undernourished is above or below the available estimates. It seems not even certain whether the direction of change has been correctly assessed for the different countries. Even with revised methods and more accurate data, estimates of food insecurity and malnutrition are bound to be subject to measurement errors and projections will remain uncertain. Thus the conclusion by the participants at the 2002 Symposium on Measurement and Assessment of Food Deprivation and Undernutrition remains valid that if the magnitudes of food insecurity are uncertain, at least the trends should be correctly captured. We believe that this is possible through improved data and methodological approaches. While in the short run, an improved FAO method may be used, we argue that, in the longer run, global measures of food insecurity and malnutrition should increasingly be based on household surveys that combine food consumption and anthropometric measurements.
REFERENCES
Adams, R. 2004. Economic growth, inequality and poverty: estimating the growth elasticity of poverty. World Development 32(12):1989-2014.
Alexandratos, N. 2009. World Food and Aagriculture to 2030/50: Highlights and Views from Mid-2009. Expert Meeting on How to Feed the World in 2050. Rome, Italy: FAO.
Alexandratos, N, ed. 1995. World Agriculture towards 2010. Chichester, UK: John Wiley and Sons, and Rome, Italy: FAO.
Anand, S., and M. Ravallion. 1993. Human development in poor countries: on the role of private incomes and public services. Journal of Economic Perspectives 7:133-150.
Anand, S., and Bärninghausen. 2004. Human resource and health outcomes: cross-country econometric study. The Lancet 364:1603-1609.
Anriquez, G., S. Daidone, and E. Mane. 2010a. Rising food prices and undernourishment—a crosscountry inquiry. FAO/ESA (Agricultural Development Economics Division) Working Paper No. 10-01. Rome, Italy: FAO.
Anriques, G., P. Karfakis, S. Daidone, and E. Mane. 2010b. Measuring dietary energy deficiency and the impact of food price variations at the household level. FAO/ESA Working Paper No. 10-02. Rome: FAO
Behrman, J. R., and A. B. Deolalikar. 1987. Will developing country nutrition improve with income? A case study for rural South India. Journal of Political Economy 95:492-507.
Bouis, H., L. Haddad, and E. Kennedy. 1992. Does it matter how we survey demand for food? Evidence from Kenya and the Philippines. Food Policy 17:349-360.
Bouis, H. E. 1994. The effect of income on demand for food in poor countries: Are our food consumption databases giving us reliable estimates? Journal of Development Economics 44:199-226.
Bhandari, N., R. Bahl, S. Taneja, M. de Onis, M. K. Bhan. 2002. Growth Performance of affluent Indian children is similar to that in developed countries. Bulletin of the World Health Organization 80(3):189-195.
Bogin, B. 1988. Patterns of Human Growth. Cambridge, UK: Cambridge University Press.
Bourguignon, F. 2003. The growth elasticity of poverty reduction: explaining heterogeneity across countries and time periods. Growth and Inequality, T. Eichler and S. Turnovsky, eds. Cambridge, UK: MIT Press.
Brinkmann, H., J. Drukker, and B. Slot. 1997. GDP per capita and the biological standard of living in contemporary developing countries. The Biological Standard of Living, J. Baten and J. Komlos, eds. Berlin, Germany: Springer.
Bruisma, J., ed. 2003. World Agriculture towards 2015/30. London: Earthscan.
Butte, N., C. Garza, and M. de Onis. 2007. Evaluation of the feasibility of international growth standards for school-aged children and adolescents. Journal of Nutrition 137:153-157.
Chattapadhyay, G., and A. K. Chowdhury. 2010. Review of food insecurity assessment and trends in India and the provinces. Analysis of India Consumer Expenditure Surveys 1987-2005 Draft Report. FAO/ESS
Datt, G., and M. Ravallion. 1992. Growth and redistribution components of changes in poverty measures: a decomposition with application to Brazil and India in the 1980s. Journal of Development Economics 38(2):275-295.
Davies, D. P. 1988. The importance of genetic influences on growth in early childhood with particular reference to children of Asiatic origin. Linear Growth Retardation in Developing Countries, J. Waterlow (Hrsg). New York: Raven Press.
Deaton, A. 1997. The Analysis of Household Ssurveys. Baltimore, MD: The Johns Hopkins University Press.
Deaton, A. and J. Dreze. 2008. Nutrition in India: Facts and Interpretations. Social Science Research Network Working Paper.
de Onis, M. and J. P. Habicht. 1996. Anthropometric reference data for international use: recommendations from a World Health Organization expert committee. American Journal of Clinical Nutrition 64:650-658.
de Onis, M. and S. Garza. 2006. Foreword. Acta Pediatrica Supplement 450:5-6.
Devarajan, S. 2002. Goals for Development, Policy Research Working Paper No. 2819. Washington, DC: The World Bank.
Drèze, J., and A. Sen. 1989. Hunger and Public Action. New York: Oxford University Press.
Ecker, O., and M. Qaim. 2010. Analyzing nutritional impacts of policies: an empirical study for Malawi. World Development 39(3):412-428.
Ecker, O., K. Weinberger, and M. Qaim. 2010. Patterns and determinants of dietary micronutrient deficiencies in rural areas of East Africa. African Journal of Agricultural and Resource Economics 4(2):175-194.
Eveleth, P., and J. Tanner. 1990. Worldwide Variation in Human Growth. Cambridge: Cambridge University Press.
FAO (Food and Agriculture Organization of the United Nations). 1996. Sixth World Food Survey. Rome, Italy: FAO.
FAO, WHO (World Health Organization) and UNU (United Nations University). 1985. Energy and protein requirements, report of a joint FAO/WHO/UNU expert consultation. WHO Technical Report 724. Geneva, Switzerland: WHO.
FAO, WHO, and UNU. 2001. Human energy requirement, report of a joint FAO/WHO/UNU expert consultation. FAO Food and Nutrition Technical Report 1. Rome, Italy: FAO.
FAO. 2002. Summary of Proceeding: Measurement and Assessment of Food Deprivation and Undernutrition. Internatinal Scientific Symposium. Rome, Italy: FAO.
FAO. 2003. Measurement and Assessment pf Food Deprivation and Undernutrition. Proceedings of International Symposium. Rome, Italy: FAO.
FAO. 2006. World Agriculture towards 2030/2050–Interim Report. Rome, Italy: FAO.
FAO. 2009. Feeding the World, Eradicating Hunger. Background Document of World Summit on Food Security. Rome, Italy: FAO.
FAO. 2010. The State of Food Insecurity in the World. Rome, Italy: FAO.
Foraita, R., S. Klasen and I. Pigeot. 2008. Using graphical chain models to analyze differences in structural correlates of undernturtion in Benin and Bangladesh. Economics and Human Biology 6:398-419.
Gallup, J., and J. Sachs. 2001. The economic burden of malaria. American Journal of Tropiocalö Medicine and Hygiene 64(1,2)S:85-96.
Gibson, R. S. 2005. Principles of Nutritional Assessment, 2nd ed. New York: Oxford University Press.
Gorstein, J., K. Sullivan, R. Yip, M. de Onis, F. Trowbridge, and P. Fajans. 1994. Issues in the assessment of nutritional status using anthropometry. Bulletin of the World Health Organization 72:273-283.
Graitcer, P., and E. Gentry. 1981. Measuring children: one reference for All. The Lancet:297-299.
Guilkey, D., and R. Riphahn. 1998. The determinants of child mortality in the Philippines: Estimation of a Structural Model, Journal of Development Economics 56:281-305.
Habicht, J. P., C. Yarbrough, R. Martorell, R. Malina, and R. Klein. 1974. Height and weight in preschool children: how relevant are ethnic differences in growth potential? The Lancet 303(7858):611-615.
Haddad, L., and R. Kanbur. 1990. How serious is the neglect of intra-household inequality? Economic Journal 100:866-881.
Harttgen, K., and M. Misselhorn. 2006. A Mulitlevel Approach to Explain Child Mortality and Undernutrition in South Asia and Sub-Saharan Africa. Mimeographed. Göttingen, Germany: University of Göttingen.
Kandala, N. B., L. Fahrmeir, S. Klasen, and J. Priebe. 2009. Geo-additive models of childhood undernutrition in three Sub-Saharan African countries. Population, Space, and Place 15(5):461-473.
Kidd, K. K., J. A. L. Armour, T. Anttinen, C. A. May, E. E. Vega1, A. Sajantila, J. R. Kidd, J. Bertranpetit, S. Pääbo, and A. J. Jeffreys. 1996. Minisatellite diversity supports a recent African origin for modern humans. Natural Genetics 13:154-160.
Klasen, S., and M. Misselhorn. 2006. Determinants of the Growth Semielasticity of Poverty Reduction. Mimeographed. Göttingen, Germany: University of Göttingen.
Klasen, S. 2000a. Measuring poverty and deprivation in South Africa. Review of Income and Wealth 46:33-58
Klasen, S. 2000b. Malnourished and surviving in South Asia, better nourished and dying young in Africa: what can explain this puzzle? SFB Working Paper 214. Munich, Germany: Department of Statistics.
Klasen, S. 2003. Malnourished and surviving in South Asia, better nourished and dying young in Africa: what can explain this puzzle? Pp. 283-287 in Measurement and Assessment of Food Deprivation and Undernutrition. Rome, Italy: FAO.
Klasen, S. 2008. Poverty, undernutrition, and child mortality: Some inter-regional puzzles and their implications for research and policy. Journal of Economic Inequality 6(1):89-115.
Klasen, S., and A. Moradi. 2000. The Nutritional Status of Elites in India, Kenya, and Zambia: An appropriate guide for developing reference standards for undernutrition? SFB Discussion Paper No. 217. Munich, Germany: Department of Statistics.
Lancet. 1984. A measure of agreement on growth standards. The Lancet. January 21, 1984: Editorial.
Lence, S. 2003. Household expenditure survey methods. Pp. 91-96 in Measurement and Assessment of Food Deprivation and Undernutrition. Rome, Italy: FAO.
Lipton, M., and M. Ravallion. 1995. Poverty and Policy. In Handbook of Development Economics 3b. J. Behrman and T. N. Srinivasan, eds. Amsterdam: North Holland.
Maxwell, S., and T. R. Frankenberger. 1995. Household Food Security, Concepts, Indicators Measurements: a Technical Review. New York: United Nations Children’s Fund and Rome, Italy: International Fund for Agricultural Development.
Martorell, R., F. Mendoza, and R. Castillo. 1988. Poverty and Stature in Children. In Linear Growth Retardation in Developing Countries. J. C. Waterlow (Hrsg.). New York: Raven Press.
McGillivray, M. 2005. Measuring non-economic well-being achievement. Review of Income and Wealth 51(2):337-365.
MacFarlane, S. B. 1995. A Universal Growth Reference of Fool’s Gold? European Journal of Clinical Nutrition 49:745-753.
Misselhorn, M. 2010. Undernutrition and the Nutrition Transition. Courant Research Center Working Paper No. 35. Göttingen, Germany: University of Göttingen.
Mohamed, A. J., A. W. Onyango, M. de Onis, N. Prakash, R. M. Mabry, and D. H. Alasfoor. 2004. Socioeconomic predictors of unconstrained child growth in Muscat, Oman. Eastern Mediterranean Health Journal 10:295-302.
Mosk, C. 1996. Making Health Work: Human Growth in Modern Japan. Berkeley, CA: University of California Press.
Mosley, W., and L. Chen. 1984. An Analytical Framework for the Study of Child Survival in Developing Countries. In Mosley, W. ed. Child Survival: Strategies for Research. New York: Population Council.
Naiken, L. 2003. FAO methodology for estimating the prevalence of food deprivation and undernutrition. Pp. 7-42 in FAO. ed. Measurement and Assessment of Food Deprivation and Undernutrition. Rome, Italy: FAO.
Nussbaum, M., and A. Sen. 1993. The Quality of Life. New York: Oxford University Press.
Osmani, S. R. 1990. Nutrition and the Economics of Food: Implications of Some Recent Controversies. The Political Economy of Hunger 1, J. Dreze and A. Sen, eds. New York: Oxford University Press.
Osmani, S. R. 1997. Poverty and Nutrition in South Asia, in UN Sub-Committee on Nutrition eds. Nutrition and Poverty. Geneva, Switzerland: WHO.
Osmani, S., and A. Sen. 2003. The hidden penalties of gender inequality: fetal origins of ill-health Economics and Human Biology 1(1):105-121
Pelletier, D. 1994. The relationship between child anthropometry and mortality in developing countries. Journal of Nutrition Supplement 124:2047S-2081S.
Pelletier, D. 1998. Malnutrition, morbidity, and child mortality in developing countries. In Too Young to Die: Genes or Gender? New York: United Nations.
Pelletier, D., E. Frongillo, and J. P. Habicht. 1993. Epidemiological Evidence for a potentiaing effect of malnutrition on child mortality. American Journal of Public Health 83:1130-1133.
Pinstrup-Andersen, P. 2007. Agricultural research and policy for better health and nutrition in developing countries: A food systems approach. Agricultural Economics 37(s1):189-198.
Ricardo, S., L. Naiken, and J. Mernies. 2007. The FAO Parametric Versus the IFPRI Non-Parametric Approach to Estimating the Prevalence of Undernourishment. Statistics Division Working Paper ESS/ESSG/012e. Rome, Italy: FAO.
Pritchett, L., and L. Summers. 1996. Wealthier is Healthier. Journal of Human Resources 31:841-868.
Ravallion, M. 1994. Poverty Comparisons. Chur, Switzerland: Harwood Academic Publishers.
Ramalingaswami, V., U. Jonsson, and J. Rohde. 1996. The South Asian Enigma. In The Progress of Nations. New York: UNICEF.
Ruel, M. T. 2003. Operationalizing dietary diversity: a review of measurement issues and research priorities. Journal of Nutrition 133(11):3911S-3926S.
Seckler, D. 1982. Small but healthy: a basic hypothesis in the theory, measurement and policy of malnutrition. In Newer Concepts in Nutrition and their Implication for Policy. D. Sukhatme (Hrsg). Pune, India: Maharashtra Association for the Cultivation of Science.
Sen, A. 1984. Poverty and Famines. Oxford, UK: Oxford University Press.
Sen, A. 1998. Development as Freedom. New York: Knopf.
Smith, L., H. Alderman, and D. Aduayom. 2006. Food Insecurity in Sub-Saharan Africa: New Estimates from Household Expenditure Surveys, IFPRI (International Food Policy Research Institute) Research Report 146. Washington, DC: IFPRI.
Smith, L., and L. Haddad. 2002. How potent is economic growth in reducing undernutrition? What are the pathways of impact? New cross-country evidence. Economic Development and Cultural Change 51:55-76.
Smith. L., and L. Haddad. 1999. Explaining Child Malnutrition in Developing Countries: A Cross-Country Analysis. IFPRI Discussion Paper No. 60. Washington DC: IFPRI.
Smith, L., U. Ramakrishnan, L. Haddad, R. Martorell, and A. Ndyae. 2003. The Importance of Women’s Status for Child Nutrition in Developing Countries. IFPRI Research Report No. 131. Washington DC: IFPRI.
Smith, L. 2003. The use of household expenditure surveys for the assessment of food insecurity. Pp. 57-88 in Measurement and Assessment of Food Deprivation and Undernutrition. Rome, Italy: FAO.
Stein, A. 2006. Micronutrient Malnutrition and the Impact of Modern Plant Breeding on Public Health in India: How Cost-Effective is Biofortification? Göttingen, Germany: Cuvillier Verlag.
Svedberg, P. 1991. Poverty and Undernutrition in Sub-Saharan Africa. Stockholm, Sweden: Swedish Institute for International Economics.
Svedberg, P. 1999. 841 million undernourished? World Development 27:2081-2098.
Svedberg, P. 2000. Poverty and Undernutrition: Theory, Measurement, and Policy. Oxford, UK: Oxford University Press.
Svedberg, P. 2002. Undernutrition Overestimated. Economic Development and Cultural Change 51(1):5-36.
Sukhatme, D. 1982. Measurement of Undernutrition. Economic and Political Weekly 17.
The World Bank. 1993. World Development Report 1993: Investing in Health. New York: Oxford University Press.
The World Bank. 1997. Confronting AIDS. Washington DC: The World Bank.
The World Bank. 2000. World Development Report 2000/2001: Attacking Poverty. New York: Oxford University Press.
The World Bank. 2005. World Development Indicators. Washington DC: The World Bank.
UNDP (United Nations Development Programme). 1990. Human Development Report. New York: Oxford University Press.
UNDP. 2000. Human Development Report. New York: Oxford University Press.
UNICEF (United Nations Children’s Fund). 1998. The State of World’s Children: Focus on Nutrition. New York: UNICEF.
WHO (World Health Organization). 1983. Measuring Change in Nutritional Status. Geneva, Switzerland: WHO.
WHO. 1995. Physical Status: The Use and Interpretation of Anthropometry. WHO Technical Report Series No. 854. Geneva, Switzerland: WHO.
WHO. 1999. Infant and young child nutrition: the WHO multicentre growth reference study. WHO Implementations and Resolutions EB105/inf.doc/I. Geneva, Switzerland: WHO.
WHO Multicentre Growth Reference Study Group. 2006a. WHO child growth standards based on length/height, weight, and age. Acta Paediatrica Suppl 450:76-85.
WHO Multicentre Growth Reference Study Group. 2006b. Enrolment and baseline characteristics in the WHO multicentre growth reference study. Acta Paediatrica Suppl 450:5-15.
WHO Multicentre Growth Reference Study Group. 2006c. Assessment of differences in linear growth among populations in the WHO Multicentre Growth Reference Study. Acta Paediatrica Suppl 450:56-65.
Wuehler, S. E., J. M. Peerson, and K. H. Brown. 2005. Use of national food balance data to estimate the adequacy of zinc in national food supplies: Methodology and regional estimates. Public Health Nutrition 8:812-819.


