
Chapter 5
The New Global Competitive Environment
America’s innovation system has long been the envy of the world. Now the rest of the world is racing to catch up. Virtually every important trading partner has declared innovation to be central to increasing productivity, economic growth, and living standards. They are implementing ambitious, farsighted, and well-financed strategies to achieve that end. This chapter will describe how different nations studied by the STEP Board are addressing their innovation challenge.
Indeed, just as the global movement toward free markets in the 1990s became known as the Washington Consensus, the first decade of the 21st century has seen the emergence of what could be described as the Innovation Consensus. Governments everywhere have been sharply boosting investments in research and development, pushing universities and national laboratories to commercialize technology, building incubators and prototyping facilities for start-ups, amassing early-stage investment funds, and reforming tax codes and patent laws to encourage high-tech entrepreneurialism. What’s more, these efforts are backed by intense policy focus at the highest level of governments in Asia, Europe, and Latin America.
Underlying this trend is an emerging understanding of what makes a nation globally competitive. Carl J. Dahlman of Georgetown University notes that economists traditionally have viewed competitiveness as a function of factors such as capital, the costs of labor and other inputs, and the general business climate. In a more dynamic world in which information technology and communications enable knowledge to be created and disseminated at evergreater speeds, competitiveness increasingly is based on the ability to keep pace with rapid technological and organizational advances.1
______________________
1 See presentation by Carl J. Dahlman of Georgetown University in National Research Council, Innovation Strategies for the 21st Century: Report of a Symposium, Charles W. Wessner, editor, Washington, DC: The National Academies Press, 2007.
The innovation agendas and precise policies differ from country to country, based on national needs and aspirations. In some cases, governments are implementing policies modeled after those of the United States. In others, they are borrowing from successful models pioneered in Europe and East Asia that leaders regard as more attuned to the competitive realities of the 21st century global economy. In that regard, other nations’ experiences offer valuable lessons for policymakers in the U.S. federal government, regions, and states.
To better understand global trends in innovation policy, the National Academies’ Board on Science, Technology, and Economic Policy (STEP) conducted an extensive dialogue over the past several years to compare and contrast policies of many nations. This section presents a number of case studies from those symposia and our research. While it is of course difficult to generalize, a number of common policy themes recurred through this extensive dialogue. They include:
• The paramount importance of investment in education to provide the skills base upon which an innovation-led economy is based.
• The value of increasing public and private investment in research and development, with at least 3 percent of GDP generally viewed as a desired target.
• The importance of establishing a far-thinking national innovation strategy that lays out broad science and technology priorities and a policy framework that addresses the entire ecosystem, including skilled talent, commercialization of research, entrepreneurship, and access to capital. Such national strategies require attention of top political leadership, coordination of government agencies, sustained funding, and collaboration with stakeholders at the regional and local level.
• An increasingly prominent role for public-private partnership in which industry, academia, and government pool resources to accelerate the translation of new technologies into the marketplace.
• A recognition that while universities’ primary roles are education and research, they also can serve as powerful engines of economic growth if granted greater freedom to collaborate with industry and to commercialize inventions.
• Focus on programs to encourage firms to transform basic and applied research into new products and manufacturing processes.
• Greater policy emphasis on the institutional framework needed to sustain new business creation, such as intellectual property-right protection, competitive tax codes, and an efficient and transparent regulatory bureaucracy.
This chapter will describe how different nations studied by the STEP Board are addressing these and other issues. The chapter describes the innovation policy approaches of nations at three tiers of development.
In the first tier are the emerging economic powers. We looked at China and India in some depth. Both nations have charted ambitious innovation agendas for improving living standards and moving well beyond labor-intensive manufacturing and low-skill services to high-tech and knowledge-intensive industries. They are leveraging their large domestic markets and low-cost workforces to attract foreign investment in next-tier industries and are developing globally competitive corporations. They also are making strategic choices about technologies that address domestic needs and in which they are best positioned to compete globally in the future.
In the second tier are the more mature newly industrialized economies. We focus on Singapore and Taiwan, which have extraordinarily well-educated populations and have attained world standards in industries such as high-tech electronics, biotechnology research, and chemicals. They are striving to develop innovation ecosystems that will allow them to rank among the world’s richest nations and compete head-to-head with the West and Japan in next-generation industries.
The third tier represents mature industrialized nations. We devote special attention to Germany because of that nation’s ability to remain globally competitive in advanced manufacturing exports despite wages and other costs that are higher than in the United States. Our case studies also include Japan, Finland, Canada, and the Flanders region of Belgium. Each of these nations has revamped their national innovation strategies in order to increase R&D spending, collaboration between industry and academia, and new technology start-ups.
In most cases, it is too early to offer a full assessment of whether the strategies and policy tools selected by other nations will achieve their stated targets. What’s more, not all of these policy options are appropriate for America. Yet they offer many valuable lessons for U.S. policymakers and present a picture of the changing global context as America prepares for 21st century competition.
After achieving decades of astonishing growth led by export manufacturing and heavy capital investment, China’s leadership stresses that the nation’s future as a global power rests on its ability to build an innovation-led economy.2 China has pursued that goal with substantial investment and
______________________
2 Government pronouncements on the importance of innovation began earlier. For example, thenPresident Jiang Zemin declared in the keynote address to the National Innovation Technology Conference on Aug. 23, 1999, that “the core of each country’s competitive strength in intellectual
impressive focus. National spending on R&D has risen by an average of 19 percent a year since 1998,3 and in under a decade has grown from less than one percent of GDP to 1.7 percent.4 China’s share of global R&D spending soared from 6 percent in 1999 to 12 percent in 2010.5
By virtually every conventional benchmark—successful patent applications, scientific publications, post-graduate degrees awarded, and global market share in high-tech goods—China’s progress in science and technology has been solid. China has emerged as a major exporter of everything from solar cells to high-end telecommunications equipment and has accelerated the construction of high-speed trains. As R&D Magazine noted, China’s financial commitments and record of generating intellectual property is such that it no longer can be regarded as an “emerging nation” in science and technology. 6 In 2010 alone, for example, China’s international patent filings surged by 56.2 percent, to 12,337, compared to average growth worldwide of 4.8 percent.7 The most visible manifestations of China’s innovation push are its sprawling science parks. China’s 54 major research parks average 10,000 acres, compared to around 350 acres in the U.S.8
China’s achievements are a testament to the nation’s ability over the past three decades to overhaul a dilapidated science and technology establishment, maintain policy focus at all levels of government, and mobilize immense public resources to invest in higher education, infrastructure, and R&D. That commitment continues to grow. China’s long-term plans call for boosting gross R&D spending to 2.5 percent of GDP by 2020 and for science and technology to account for 60 percent of the economy.9 The government has set an ambitious target of having 2 million patents of inventions, utility models, and designs by 2015.10
______________________
innovation, technological innovation, and high-tech industrialization.” Current President Hu Jintao has stressed the importance of innovation in numerous speeches.
3 UNESCO, Institute for Statistics Database, Table 25, Gross Expenditure on Research and Development in constant dollars. Growth rate from 1998 to 2008.
4 Ministry of Science and Technology of the People’s Republic of China, China S&T Statistics Data Book 2010, Figure 1-1.
5 Battelle and R&D Magazine, 2012 Global R&D Funding Forecast, December 2011
6 Martin Grueber and Tim Studt, “Global Perspective: Emerging Nations Gain R&D Ground,” R&D Magazine, Dec. 22, 2009.
7 Xinhua News Service, “China 2010 International Patent Filings up 56.2%,” China Daily, Feb. 2, 2011.
8 Data from Research Triangle Foundation.
9 State Council of China, National Medium- and Long-Term Program for Science and Technology Development, 2006-2020 (http://webcache.googleusercontent.com/search?q=cache:y800l0iQlS8J:www.cstec.org/uploads/files/National%2520Outline%2520for%2520Medium%2520and%2520Long%2520Term%2520S%26T%2520Development.doc+china+National+Medium-+and+LongTerm+Program+for+Science+and+Technology&cd=18&hl=en&ct=clnk&gl=us&client=firefox-a).
10 State Intellectual Property Office, “National Patent Development Strategy (2011-2020),” (http://graphics8.nytimes.com/packages/pdf/business/SIPONatPatentDevStrategy.pdf).
China’s heavy focus on absorbing foreign technology, rather than inventing it, also explains its industrial rise. The U.S. devotes 17.4 percent of its R&D spending to basic research, another 22.3 percent to applied research, and 60.3 percent to R&D development.11 China invests 82.7 percent of national R&D spending to development of products and manufacturing process, while devoting just 4.7 percent to basic research and 12.6 percent to applied research.12 [See Figure 5.1]
When it comes to creating truly innovative products, however, China still is regarded as an underachiever.13 One hurdle is weak R&D spending by Chinese companies, especially state-owned enterprises.14 Even though business enterprises in China accounted for 73 percent of R&D spending in 2009,15 a World Bank study of nearly 300,000 Chinese enterprises big and small found that the vast majority did not conduct continuous R&D and described Chinese industry as “manufacturing without innovation.”16
China’s weak protection of intellectual property rights is a serious restraint on innovation, preventing companies from enjoying the full profits of their inventions and making foreign investors wary of conducting sensitive R&D in China.17 Other often-cited weaknesses are shortages of the right kind of human resources, weak linkages between government-funded research institutions and the private sector,24 a science and technology establishment that prizes the quantity of journal publications and patents over quality and addedvalue, and over-dependence on government bureaucracy in investing R&D funds. A study by the Chinese Ministry of Science and Technology and the Organization for Economic Co-Operation faulted “deficiencies in the current policy instruments and governance promoting innovation.” As a result, the study concluded, the government’s heavy investments in R&D have “yet to translate into a proportionate increase in innovation performance.”25 As Deng Wenkui, director-general of the State Council Research Office put it: “Although China is a science and technology country with great skill, it is not a powerhouse.” He added that “without reform and innovation, China cannot develop.”26
______________________
11 National Center for Science and Engineering Statistics, National Patterns of R&D Resources: 2008 Data Update, Detailed Statistical Tables, NSF 10-314 (March 2010), Tables 1-4.
12 Ministry of Science and Technology of the People’s Republic of China, China S&T Statistics Data Book 2010, Figure 1-3 at http://www.sts.org.cn/sjkl/kjtjdt/data2010/cstsm2010.htm.
13 As a recent National Academy report concluded “China’s S&T investment strategy is ambitious and well-financed but highly dependent on foreign inputs and investments. Many of its stated S&T and modernization goals will be unachievable without continued access to and exploitation of the global marketplace for several more decades. China plays a critical role in low- and select high-tech industry production and logistics chains, but it cannot (yet) replicate these processes domestically.” National Academy of Sciences, Natural Research Council, S&T Strategies of Six Countries: Implications for the United States, Washington, DC: The National Academies Press, 2010, p.23.
14 Gruber and Studt, ibid.
15 China S&T Statistics Data Book 2010, ibid., Figure 1-2.
16 Chunlin Zhang, Douglas Zhihua Zeng, William Peter Mako, and James Seward, Promoting Enterprise-Led Innovation in China, Washington, DC: The International Bank for Reconstruction and Development/The World Bank, 2009 (http://siteresources.worldbank.org/CHINAEXTN/Resources/3189491242182077395/peic_full_report.pdf).
17 For examples of U.S. industry complaints, see John Neuffer, “China: Intellectual Property Infringement, Indigenous Innovation Policies, and Frameworks for Measuring the Effects on the U.S. Economy,” written testimony to the United States International Trade Commission Investigation No. 332-514 Hearing on behalf of the Information Technology Industry Council, June 15, 2010. (http://www.itic.org/clientuploads/ITI%20Testimony%20to%20USITC%20Hearing%20on%20China%20%28June%2015,%202010%29.pdf). See also Semiconductor Industry Association, Maintaining America’s Competitive Edge: Government Policies Affecting Semiconductor Industry R&D and Manufacturing Activity, March 2009, p.31. “Most [semiconductor] companies surveyed indicated that they would not locate their most advanced and critical R&D activities in China, despite encouragement and even pressure by the government to do so, and regardless of the
Box 5.1
Constraints on Innovation in China
China’s massive investments in technological infrastructure, science education, and research programs are key elements in laying the foundation for an innovation economy. But these investments in themselves do not mean that China will become a leading innovator in the near term. As China’s Vice Minister of Science and Technology, Ma Songde commented in 2006, “most Chinese high-tech products are copies from other countries and that original inventions are rare on the mainland.”18
In this regard, a recent report by the National Academies noted that “Although the growth in S&T funding is remarkable, there are still institutional issues that must be resolved. In particular, there is a general lack of openness and transparency in funding decisions, which negatively affects the ability of China to recruit first-rate scientists. Additionally, most R&D spending is geared toward development activities, rather than basic research. As a result, the quality and quantity of cutting-edge basic research is still small compared to that of the United States.” 19
The current World Bank report on China observes that notwithstanding China’s growing supply of skills and advanced industrial base, most R&D is conducted by the government and state-owned enterprises in a manner that is divorced from the needs of the economy. China has seen a sharp increase in patents and published papers, but few have commercial relevance.20 The report indicates that “China has relatively few high-impact scientific activities in any field,” and that the “quantity [of patents] has not been matched by the quality of the patents.”21
The centerpiece of China’s innovation effort, the so-called ‘indigenous innovation” initiative, emphasizes the exertion of commercial leverage against foreign firms to induce the transfer of technology that will be “absorbed, assimilated, and re-innovated” with Chinese intellectual property—arguably not
______________________
availability quality and size of incentives, due to concerns about the inadequacy of intellectual property protection in that country.”
18 Seminar remarks summarized in Open Source Center Report (July 24, 2006).
19 National Research Council, S&T Strategies of Six Countries, Implications for the United States, Washington, DC: The National Academies Press, 2010, page 30. The report further notes that “although China’s university system graduates hundreds of thousands of scientists and engineers each year, a critical shortage exists of highly qualified faculty, many of whom are attracted instead to opportunities in the private sector.”
20 World Bank, China 2030, Washington, DC: The World Bank, 2012.
21 World Bank, Supporting Report 2: China Grows Through Technological Convergence and Innovation. Washington, DC: World Bank, 2012, pages 177-178.
a program focused on fostering original discoveries.22 Despite these limitations, developing major new innovations is not the only source of national strength. Programs that focus on acquiring new and established technologies can help develop the technological competitiveness of the Chinese economy and provide the opportunity for commercial success, first within China and next in export markets, thus laying the foundation for steadily higher levels of commercial application of advanced technologies.
To address these challenges to its innovation system, the World Bank recommends that China concentrate on raising the technical and cognitive skills of its university graduates, building a few world-class research universities with links to industry, increasing the availability of patient risk capital for start-ups, and fostering clusters that bring together dynamic companies and universities and allow them to interact without restriction.23
______________________
22 State Council, “Guidelines for the Medium and Long Term National Science and Technology Program (2006-2020) June 2006.
23 World Bank, China 2030, op. cit.
24 See Denis Fred Simon and Cong Cao, China’s Emerging Technological Edge: Addressing the Role of High-End Talent, Cambridge: Cambridge University Press, 2009.
25 OECD Reviews of Innovation Policy, op. cit. This lack of performance is reflected in the innovation component of the World Bank’s Knowledge Economy Index (KEI), which ranks China 63rd in the world despite its large absolute spending on R&D. The innovation component of the World Bank’s index is based on total royalty payments and receipts, patent applications granted by the U.S. PTO and scientific and technical journal articles. World Bank, Knowledge Assessment Methodology at http://go.worldbank.org/JGAO5XE940.
26 Remarks by Deng Wenkui of the State Council Research Office at the Sept. 19, 2011 National Academies symposium “U.S.-China Policy for Science, Technology, and Innovation” in Washington, DC.
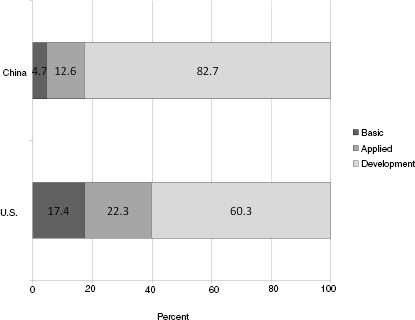
FIGURE 5.1 China devotes less that 5 percent of total R&D spending to basic research.
SOURCE: China: Ministry of Science and Technology of the People’s Republic of China, China S&T Statistics Data Book 2010, Figure 1-3; for U.S.: National Center for Science and Engineering Statistics, National Patterns of R&D Resources: 2008 Data Update, Detailed Statistical Tables, NSF 10-314 (March 2010), Tables 1-4.
NOTES: China data for 2009; U.S. data for 2008.
Determined to correct these shortcomings, the Chinese government over the past five years has launched an ambitious agenda to “transform China’s economic development pattern so that it is driven by innovation,” in the words of Ministry of Science and Technology official Yang Xianyu.27 President Hu Jintao has declared that innovation “is the core of our national development strategy and a crucial link in enhancing the overall national
______________________
27 From presentation by Yang Xianyu of the Ministry of Science and Technology in National Research Council, Building the 21st Century: U.S. - China Cooperation in Science, Technology, and Innovation, Charles. W. Wessner, editor, Washington, DC: The National Academies Press, 2011.
strength.”28 Such pronouncements have been backed with a flurry of initiatives at the central, provincial, and local levels to upgrade the nation’s innovation ecosystem. Among other things, the government is greatly increasing spending on R&D, boosting incentives for corporate R&D, urging universities and government research institutes to form stronger links with industry, building immense science parks, investing aggressively in broadband infrastructure, and vowing to improve intellectual property-right protection.
The strategy is embodied in The National Medium and Long-Term Program for Science and Technology Development, 2006-2020, a document drafted over two years and that received input from some 2,000 experts.29 The overarching goal is to make China an “overall well-off society” driven by innovation. Among the key targets for 2020 are to become one of the world’s top five generators of invention patents and published scientific papers, and to reduce China’s dependence on foreign technology to 30 percent.30 The document also lists 16 “megaprojects” that will receive heavy government financial backing.
The aspect of the game plan that has generated the most attention overseas is the government’s emphasis on “indigenous innovation.” The goal is to ease China’s dependence on imported technology and to nurture companies that can compete at home and abroad with their own intellectual technology. As outlined in the 15-year science and technology plan and numerous published rules and guidelines over the past five years, the strategy includes compelling foreign companies to transfer core technology as a price for being able to sell into China’s immense domestic market.31
In addition to generating tension with trade partners, China’s innovation strategy seems fraught with internal contradictions. Although the stated goal is to achieve an innovation-driven economy led by market forces and enterprises, the technology drive is built around large state-led projects.
______________________
28 Hu Jintao report to the 17th National Congress of the Communist Party of China, Oct. 14, 2007. See Xinhua, “Innovation tops Hu Jintao’s Economic Agenda,” Oct. 15, 2007 (http://news.xinhuanet.com/english/2007-10/15/content_6883390.htm).
29 Cong Cao, Richard P. Suttmeier, and Denis Fred Simon, “China’s 15-Year Science and Technology Plan,” Physics Today, December 2006 (http://www.levininstitute.org/pdf/Physics%20Today-2006.pdf).
30 National Medium- and Long-Term Program for Science and Technology Development, op. cit.
31 For an extensive discussion of the controversies surrounding China’s indigenous innovation policies, see James McGregor, “China’s Drive for ‘Indigenous Innovation: A Web of Industrial Policies, “U.S. Chamber of Commerce, Global Intellectual Property Center, APCO Worldwide (http://www.uschamber.com/sites/default/files/reports/100728chinareport_0.pdf). Also see U.S. International Trade Commission, China: Intellectual Property Infringement, Indigenous Innovation Policies, and Frameworks for Measuring the Effects on the U.S. Economy, Investigation No. 332514, USITC Publication 4199 (amended), November 2010 (http://www.usitc.gov/publications/332/pub4199.pdf) and Alan Wm. Wolff, “China’s Indigenous Innovation Policy,” testimony before the U.S. China Economic and Security Review Commission, Washington, DC, May 4, 2011.
Although the strategy acknowledges that China needs multinational investment and greater international collaboration, it is intends to extract technology from foreign companies to create domestic champions that will eventually compete directly against them. As an extensive study of China’s technology modernization drive by CENTRA Technologies concludes: “Caught between a tradition of state planning and the need for markets—and between an interest in foreign technology assimilation of the lure of domestically developed technology—China’s innovation system faces an ambiguous future.”32
Nevertheless, there is little question China has the raw potential—and certainly the determination—to emerge as a 21st century innovation power. China has passed Japan as the world’s second-largest spender on R&D.33 Tertiary enrollment in China rose from 2 percent in 1980 and 22 percent in 2007. As of 2008, China had 27 million post-secondary students, compared to 18 million in the U.S.34 Forty percent of those students are in engineering, math, and science.35 China’s research workforce that has tripled to some 1.6 million since 1997,36 and a pool of science and engineering Ph. D’s that swelled more than fourfold over that time to 20,000. China has extraordinarily high savings and investment rates of around 40 percent of GDP, double the rate of most other nations. China also has the world’s second largest manufacturing base [See Figure 5.2], a surplus labor pool of more than 150 million people, superb trade logistics, the world’s fast-growing market for advanced technology products, and the ability to absorb global knowledge through direct foreign investment and an extensive network of overseas Chinese.37
______________________
32 Micah Springut, Stephen Schlaikjer, and David Chen, “China’s Program for Science and Technology Modernization: Implications for American Competitiveness,” CENTRA Technology Inc., prepared for The U.S.-China Economic and Security Review Commission, 2011 (http://www.uscc.gov/researchpapers/2011/USCC_REPORT_China’s_Program_forScience_and_Technology_Modernization.pdf).
33 OECD, Main Science and Technology Indicators: Volume 2011/1, 2011, p. 18. Data comparison based on current U.S. dollars.
34 UNESCO.
35 See Carl Dahlman, World Under Pressure, op. cit.
36 UNESCO Science and Technology database.
37 See presentation by Carl Dahlman of Georgetown University in National Research Council, Innovation Policies for the 21st Century, Charles W. Wessner, editor, Washington, DC: The National Academies Press. Also see Carl Dahlman, in Building the 21st Century: U.S. - China Cooperation in Science, Technology, and Innovation, op. cit.
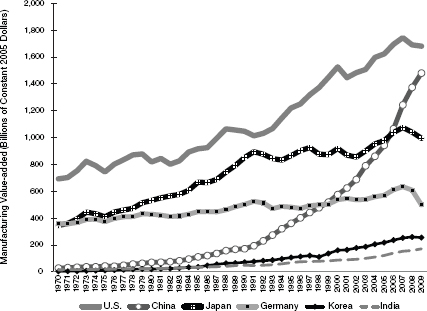
FIGURE 5.2 China is second only to the United States in manufacturing valueadded.
SOURCE: United Nations Statistics Division, National Accounts Main Aggregates Database at http://unstats.un.org/unsd/snaama/selbasicFast.asp.
China’s Evolving Innovation System
China re-entered the global economy in the late 1970s with a scientific establishment, higher education system, and industrial base that had been crippled by nearly three decades of chaotic rule under Mao Zedong. After its victory in 1949, the Communist Party implemented Soviet-style central planning. Private industrialists fled to Hong Kong and Taiwan, and state took control of the factories left behind. Millions perished in famine as the result of the Great Leap Forward, Mao’s disastrous grass-roots industrialization drive. Scientists and academics were purged in an antirightist campaign and again during the Cultural Revolution from 1966 to 1976, when educated Chinese were banished to manual work in the countryside and universities were shut to virtually all but workers, farmers, and soldiers. That 10-year period cost China a generation of top scientists and engineers whose absence is still felt.
Box 5.2
China’s Demographic Challenge
Driven by the nation’s one child policy, China’s total fertility rate has fallen over the past 30 years from 2.6, well above the rate needed to hold a population steady, to 1.56, well below that rate.38 If children of one-child families want only one child themselves, as is typical, China will face a long period of low fertility.
Moreover, China faces a rapid aging of its workforce, leading to a contraction of from 72% to 61% between 2010 and 2050. As the demographic bulge ages, the numbers of those in their early 20s, who are usually the best educated and most productive members of society, will have halved.39
As the Economist observes, “The shift spells the end of China as the world’s factory. The apparently endless stream of cheap labour is starting to run dry. Despite pools of underemployed country-dwellers, China already faces shortages of manual workers. As the workforce starts to shrink after 2013, these problems will worsen.”40
China’s innovation system, which prior to the revolution featured 210 Western-style universities and 70 research institutes, was remodeled along Soviet lines. The Chinese Academy of Sciences assumed control of basic research. Applied research was the responsibility of thousands of research institutes controlled by central ministries and provincial governments, while state enterprises developed products. Universities focused on human resource development. 41 Although China registered some major achievements, such as development of an atomic bomb and satellites, there was little connection between research and industry.
China’s current innovation system began with reforms launched by Deng Xiaoping in 1978. Universities once again admitted students based on
______________________
38 See Yong Cai, China’s Demographic Reality and Future, Asian Population Studies, Vol. 8, No. 1, March 2012. See also Ho Chi-ping, “Demography could threaten China’s lead in manufacturing,” China Daily, April 25, 2012.
39 Ada C. Mui, “Productive ageing in China: a human capital perspective.” China Journal of Social Work, Volume 3, Issue 2-3, 2010. See also The Economist, “Demography: China’s Achilles Heel,” April 21, 2012.
40 The Economist, April 21, 2012, op cit. For an analysis of the implications of shifting demographic trends around the world, see Sarah Harper, “Addressing the Implications of Global Aging,” Journal of Population Research, Vol. 23, No. 2, 2006.
41 From presentation by Lan Xue of Tsinghua University School of Public Policy and Management at June 28, 2011, Joint Seminar on Comparative Innovation Studies at the Chinese Academy of Engineering in Beijing. This symposium was co-sponsored by the National Academy of Sciences, the Chinese Institute for Strategy Studies in Engineering and S&T.
examination scores, and thousands of China’s brightest scholars were allowed to study in the U.S. and Europe. Deng also enshrined science and technology as one of the Four Modernizations, the pillars of the Party’s strategy to become a great economic power.42 The government introduced a wave of programs in the 1980s to advance science and technology and to open the doors to what became a flood of foreign direct investment. The government also shifted much of the implementation of its policies from central ministries to local and provincial authorities.43
The first wave of reforms in the 1980s included restructuring and gradual funding cuts of state-run research institutes. Instead, more research funds instead were allocated to specific projects through a competitive process. The State-High Tech Development Plan, better known as the 863 Program, was launched to ease China’s dependence on foreign technologies in key areas from satellites to computer processing.44 A program to build 153 world-class national laboratories in universities and research institutes began in 1984.45 The National Natural Science Foundation, modeled after the National Science Foundation, was established in 1986 to award peer-reviewed research grants to scientists. The Torch Program was initiated in 1988 to promote industrialization of high technology by developing work forces, organizing science and technology R&D programs to serve national goals, offering preferential access to bank credit for new product development programs, and building 53 high-technology industrial zones.46 The Spark program targeted rural development. Organizational changes also encouraged different research organizations to establish horizontal linkages and encourage scientists and engineers to become entrepreneurs.
The leadership launched a series of reforms to decentralize, depoliticize, and diversify the higher education system in 1985. Provincial and
______________________
42 The Four Modernizations were goals originally promoted by Zhou Enlai in the 1960s and adopted at the Third Plenum of the 11th Central Committee in December 1978.
43 From presentation by Thomas R. Howell in Innovation Policies for the 21st Century, op. cit.
44 The initial fields covered in the 863 program were biotechnology, space, information technology, automation, energy, and new materials. Other fields, such as telecommunications and marine technology, were added in subsequent five-year plans. An explanation of the program is found on the Ministry of Science and Technology Web site at http://www.most.gov.cn/eng/programmes1/200610/t20061009_36225.htm.
45 For a concise explanation of Chinese innovation policies over the past decade, see Can Huang, Celeste Amorim, Mark Spinoglio, Borges Gouveia and Augusto Medina, “Organization, Programme and Structure: An Analysis of the Chinese Innovation Policy Framework,” R&D Management 34, 4, 2004 (http://xcsc.xoc.uam.mx/apymes/webftp/documentos/biblioteca/analysis%20of%20the%20Chinese%20innovation%20policy.pdf). Also see Evan Feigenbaum, Chinese techno-Warriors: National Security and Strategic Competition from the Nuclear Age to the Information Age, Palo Alto: Stanford University Press, 2003).
46 An explanation of the Torch program is found on the Web site of the People’s Republic of China New York Consulate at http://www.nyconsulate.prchina.org/eng/kjsw/zgkj/t31698.htm.
local governments assumed operating control, and universities were given more management autonomy. Universities also were encouraged to become more commercially viable, compete for faculty and research funding, and cooperate with industry and government.47 They also were encouraged to form enterprises, incubate new companies, and create science parks.
A second major wave of reforms in the 1990s focused on developing China’s national innovation system. Enrollment at universities increased dramatically, and R&D programs were strengthened. Hundreds of universities were merged and restructured, and the number administered by central government ministries dropped from 367 to 120. The National Basic Research Program, better known as the 973 Program, was launched to support 175 chief scientists focusing on “strategic needs,” such as agriculture, energy, information, and health.48 The roles of government research organizations were clarified. After the central government sharply cut its funding, the Chinese Academy of Sciences launched the Knowledge Innovation Program to remake itself as the nation’s premier source of basic research and cutting-edge technology in everything from defense and agriculture to health and energy. The CAS hired hundreds of overseas Chinese scientists and consolidated its 120 institutes into 80.49 As explained further below, thousands of other research institutes controlled by ministries and local governments also were forced to compete for research funds and encouraged to become part of enterprises or go into business themselves.
The most recent innovation push began in 2003 under President Hu Jintao and Premier Wen Jiabao, who elevated innovation to the top of the nation’s economic agenda. Coordinated by the Ministry of Science and Technology—which leads development of science policy and overseas many national funding programs to implement projects—and the Chinese Academy of Sciences, the government launched a two-year project to draft a new national strategy for science and technology.50 The innovation push is part of an overarching strategy to gradually overhaul China’s economic model, which Premier Wen described as “irrational” due to its reliance on “the overproduction of low-quality goods, low rates of return, and increasingly severe constraints
______________________
47 See Lan Xue, “Universities in China’s National Innovation System,” prepared for the UNESCO Forum on Higher Education, Research, and Knowledge, 2006 (http://portal.unesco.org/education/en/files/51614/11634233445XueLan-EN.pdf/XueLan-EN.pdf).
48 The National Basic Research Program, also known as the 973 Program, was approved by the central government in June 1997 and administered by the Ministry of Science and Technology. For an explanation in English of the program, see http://www.973.gov.cn/English/Index.aspx.
49 For a good analysis of changes in the Chinese Academy of Sciences and reforms of research institutes, see Richard P. Suttmeier, Cong Cao, and Denis Fred Simon, “China’s Innovation Challenge and the Remaking of the Chinese Academy of Sciences,” Innovations, Summer 2006 (http://www.policyinnovations.org/ideas/policy_library/data/ChinasInnovationChallenge/_res/id=sa_File1/INNOV0103_p78-97_suttmeier.pdf).
50 Xue, “China’s Innovation Policy in Context of National Innovation System Reform,” op. cit.
resulting from energy and other resource scarcity and severe environmental degradation.”51 The leadership believes that China is overly dependent on export manufacturing of goods that export cheap labor but entail little Chinese valueadded. As Lan Xue, dean of Tsinghua University’s School of Public Policy and Management explained, the leadership recognized “the need for China to break away from its traditional position in the international division of labor and move up the value chain.”52
The result was the Medium to Long-Term Plan for the Development of Science and Technology. In addition to setting broad goals such as increasing R&D spending to 2.5 percent of GDP by 2020, the lengthy document contained lists of targets for catching up with advanced nations by 2020 in “frontier sciences” such as the study of life processes, earth systems, and the brain; “major scientific programs” that include protein studies, quantum regulation, and nano-scale materials; applied technologies aimed at specific industries such new-energy based vehicles, high-performance computing, sensor networks, high-definition flat-panel displays, high-speed transit, and renewable energies. The 15-year plan addresses framework conditions for a national innovation system, such as the need to put enterprises at the center of innovation, policy support for venture capital, improving protection of intellectual property rights, and investments in infrastructure, human resource development, and promoting public understanding of an innovative culture. 53
The plan also designated 16 “megaprojects” that would establish China as a global leader in key industries and be backed with significant direct central government funding, bank loans, and policy tools such as tax breaks for companies. The megaprojects include extra large-scale semiconductor manufacturing, next-generation wireless broadband, advanced nuclear reactors, control of AIDS and hepatitis, and large aircraft manufacturing. Beijing has announced more than $100 billion in investments in megaproject schemes since 2008.54 The megaproject plan had generated active debate over whether central government control over funding for such industrial projects—as opposed to competitive grants allocated through peer review—would lead to financial waste.55
A newer government industrial policy initiative calls for nurturing seven “strategic emerging industries”—new-generation information technology, energy efficiency and environmental protection, biology, high-end equipment manufacturing, new energy, new materials, and new energy automotive
______________________
51 Wen Jiabao, “Speech at the National Science and Technology Conference,” Jan., 9, 2006.
52 Xue presentation in June 28 Beijing symposium.
53 The Medium to Long-Term Plan for the Development of Science and Technology, op. cit.
54 A list of government spending announcements for megaprojects is found in Springut, Schlaikjer, and Chen, op. cit.
55 For an account of internal debates over drafting of the 15-year plan is in McGregor, op. cit.
industries.56 The goal is for these seven sectors to account for 8 percent of GDP by 2015 and 15 percent by 2020, compared to 4 percent now.57 To attain these goals, HSBC Global Research calculates that these sectors would have to grow at a compounded annual rate of 35 percent for the next five years and 29 percent over the coming decade and reach between $1.55 trillion and $2.33 trillion in revenue in 2020.58 The initiative is said to entail an overall investment of $1.5 trillion, with the government planning to account for 5 percent to 15 percent of the funds.59
Chinese government bodies offer some of the world’s most generous incentives in targeted industries. They include 10-year tax holidays for production plants, exemption from sales tax income earned through technology transferred via foreign investment, low cost or free land, direct equity stakes by government investors, and procurement regulations that favor domestic production. To spur investment in innovation in “high priority” sectors, China offers 1.5 renmenbi in tax credits for every renmenbi spent on R&D.60
TABLE 5.1 Eight Major Innovation Policy Initiatives Resulting from Adoption of the Outline of the Medium- and Long-Term Plan for National Science and Technology Development
|
• Increase investment in R&D • Tax incentives for investment in STI • Government procurement policy to promote innovation • Assimilation of imported advanced technology • Increase capacity to generate and protect IPR • Build national infrastructure and platforms for STI • Cultivate and utilize foreign talents for STI • Support indigenous innovation |
| SOURCE: UNESCO, UNESCO Science Report 2010, pp. 381-386. |
______________________
56 The State Council announced Emerging Strategic Industries initiative was released following the Communist Party’s 2010 plenary. A Chinese version of the decree, Guo-Fa 2010 No. 32 can be accessed at http://www.gov.cn/zwgk/2010-10/18/content_1724848.htm.
57 People’s Daily Online, “Strategic Emerging Industries Likely to Contribute 8% of China’s GDP by 2015,” October 19, 2010 (http://english.peopledaily.com.cn/90001/90778/90862/7170816.html).
58 Steven Sun and Garry Evans, “Emerging Strategic Industries: Aggressive Growth Plans,” HSBC Global Research, Oct 19, 2010). (http://www.research.hsbc.com/midas/Res/RDV?p=pdf&key=lg0uISbcyh&n=280786.PDF
59 Estimate in Springut, Schlaikjer, and Chen, op. cit.
60 Yang presentation, op. cit.
The cost of capital is another advantage for Chinese manufacturers. Stephen O’Rourke of Deutsche Bank Securities estimates the Chinese solar cell and module makers pay 3.5 percent interest on average to borrow from government banks. Combined with other incentives, he said, China has an “almost insurmountable” cost advantage over the U.S. as a place to build and operate a factory.61
Some government aid to industry has led to friction with trade partners. In December 2010, for example, the U.S. filed a WTO complaint accusing China of providing unfair subsidies to domestic producers of windturbines and solar equipment, allegations that China denies.62 An investigation by the European Commission in February 2011 concluded that Huawei and ZTE received massive subsidies in the form of credit lines from state-owned banks. Huawei and ZTE denied those allegations.63
Surging Chinese exports of solar panels also have triggered trade disputes. Seven U.S. manufacturers of solar panels filed an anti-dumping petition with the Department of Commerce in October 2011 alleging that billions of dollars in government subsidies enabled China’s largest photovoltaic panel manufacturers to dramatically increase capacity, enabling them to push down prices and dominate the U.S. market. The U.S. manufacturers also accused their Chinese competitors of selling at below-fair value. Chinese manufacturers deny the charges.64 The China Development Bank reportedly gave $30 billion in low-cost loans in 2010 alone to China’s top five manufacturers.65
Behind the Indigenous Innovation Push
A steady theme running through the Medium to Long-Term Plan is its emphasis on spurring “indigenous innovation.” The Chinese term zizhu chuangxin roughly translates into “self directed,” but has been understood and described in different ways. Many Western commentators have interpreted “indigenous innovation” to mean “self-sufficiency.”
Indeed, the Medium to Long-Term Plan declares that China must “master core technologies in some critical areas, own proprietary intellectual property rights, and build a number of internationally competitive enterprises.” The plan also states that core technologies “in areas critical to the national
______________________
61 From presentation by Steve O’Rourke of Deutsche Bank Securities in National Research Council, The Future of Photovoltaic Manufacturing in the United States: Summary of Two Symposia, Charles W. Wessner, ed., Washington, DC: The National Academies Press, 2011.
62 Martin Crutsinger, “U.S. Challenges Chinese Wind-Power Subsidies,” Associated Press article published in Seattle Times, Dec. 22, 2010.
63 Matthew Dalton, “EU Finds China Gives Aid to Huawei, ZTE,” Wall Street Journal, Feb. 3, 2011.
64 Keith Bradsher, “7 U.S. Solar Panel Makers File Case Accusing China of Violating Trade Rules,” New York Times, Oct. 20, 2011.
65 Stephen Lacy, “How China Dominates Solar Power,” The Guardian, September. 12, 2011.
economy and security” should not be purchased from abroad if domestic alternatives are available.66
The 15-year plan and other Chinese statements on rules and regulations have heightened fears by foreign companies that the strategy is to reverseengineer and forcibly extract technology from multinationals as a price for the privilege of selling their products in China. Other policies state that government agencies and government-funded projects—which account for the bulk of important purchases in China due to the government’s pervasive role in the economy—should favor products invented in China by Chinese-owned companies over those of foreign companies. The central government and provincial governments issued catalogues to procurement officials specifying which products meet “indigenous innovation” criteria. Few foreign products were on the lists. The indigenous innovation goals also are embedded in Chinese technology standards, anti-monopoly law, patent rules, and tax regulations, according to the U.S. International Trade Commission. “The indigenous innovation ‘web of policies’ is expected to make it difficult for foreign companies to compete on a level playing field in China,” the ITC reported.67 An American Chamber of Commerce report said “the plan is considered by many international technology companies to be a blueprint for technology theft on a scale the world has never seen before.”68
Chinese officials and economists have sought to assure foreign companies that China’s intent is not to steal foreign technology and shut foreign products out of its market. Rather, the intent is to improve China’s ability to create innovative products, add more value to what it produces, and relieve an unhealthy over-reliance on imported knowhow for a country at its stage of development. Mr. Deng of the State Council Research Office noted that in the global supply manufacturing chain, China produces mainly low- and mediumlevel goods. The core technology and crucial equipment is not made in China. “We need to develop core processes and breakthrough technologies,” he said.69 China’s enormous trade surplus with the United States is exaggerated, contended Dr. Xue of Tsinghua University, because conventional trade statistics don’t take into account the imported materials that go into exported products and
______________________
66 The Medium to Long-Term Plan for the Development of Science and Technology, op. cit.
67 U.S. International Trade Commission, China: Intellectual Property Infringement, Indigenous Innovation Policies, and Frameworks for Measuring the Effects on the U.S. Economy, Investigation No. 332-514, USITC Publication 4199 (amended), November 2010 (http://www.usitc.gov/publications/332/pub4199.pdf). Also see For an extensive examination of the implications of Chinese government “indigenous innovation” policies for foreign companies and trade, see Alan Wm. Wolff, “China’s Indigenous Innovation Policy,” testimony before the U.S. China Economic and Security Review Commission, Washington, DC, May 4, 2011.
68 McGregor, “China’s Drive for ‘Indigenous Innovation: A Web of Industrial Policies, U.S. Chamber of Commerce, Global Intellectual Property Center, APCO Worldwide (http://www.uschamber.com/sites/default/files/reports/100728chinareport_0.pdf).
69 Deng Wenkui presentation, op. cit.
the low value-added of its exports. Dr. Xue estimates that 90 percent of China’s trade surplus is in the “processing trade,” in which goods are assembled in China from imported parts and materials, and is generated by multinationals and foreign joint ventures.70
Dr. Xue said a classic example is the Apple iPhone, which is assembled in China by the Taiwanese contract manufacturer Foxconn. A study by the Asian Development Bank noted that the iPhone, although invented and designed in the U.S., contributed $1.9 billion to the U.S. trade deficit with China in 2009. That is because the $2 billion worth of iPhones shipped from Foxconn’s Shenzhen factory contained a little more than $100 million in U.S. parts. Chinese manufacturing accounted for only $73.5 million of value of those $2 billion worth of phones, however. The rest came from imported materials. America’s bigger trade deficits from the iPhone, therefore, were with Japan, which supplied $670 million in components, Germany ($326 million), and South Korea ($108 million). [See Figure 5.3] The difference between the $500 selling price of the iPhone and the $179 production cost went to Apple and retailers.71
Adding to the sense of urgency over innovation is recognition that rising wages, shipping rates, and other costs are fast eroding China’s onceformidable cost advantage as an export-manufacturing base for the world. In 2000, wages and benefits of average Chinese factory workers in the Yangtze River Delta, the nation’s leading export region, were one-20th those of comparable workers in Southern U.S. states. By 2015, Chinese wages will be one-quarter of those in the U.S., according to projections by The Boston Consulting Group. Once higher U.S. worker productivity, the actual labor content of a product, logistics costs and other factors are fully accounted for, China’s cost advantage will be negligible, BCG predicts.72 To remain competitive in the years ahead, therefore, China will increasingly have to compete in higher value-added products rather than just on the basis of low labor costs.
______________________
70 Xue presentation, op. cit. While it is true that, measured in terms of domestic value-added, China’s trade surplus with certain countries such as the United States is overstated, the domestic value-added of Chinese exports has been increasing over time. See Robert Koopman and Zhi Wang, “How Much of China’s Exports is Really Made in China? Estimating Domestic Content in Exports When Processing Trade is Pervasive,” presented at World Bank Trade Workshop, June 10, 2011.
71 Yuqing Xing and Neal Detert, “How the iPhone Widens the United States Trade Deficit with the People’s Republic of China,” ADBI Working Paper 257, Asian Development Bank Institute, December 2010 (http://www.adbi.org/files/2010.12.14.wp257.iphone.widens.us.trade.deficit.prc.pdf).
72 Harold L. Sirkin, Michael Zinser, and Douglas Hohner, Made in America, Again: Why Manufacturing Will Return to the U.S., Boston Consulting Group, August 2011. This report can be accessed at http://www.bcg.com/documents/file84471.pdf.
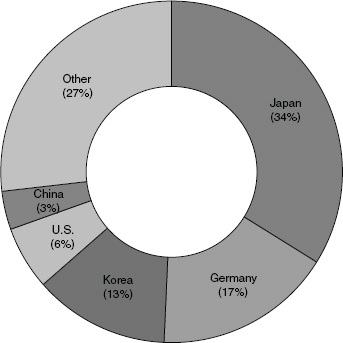
FIGURE 5.3 While trade data indicate that the United States imported $2 billion of iPhones from China in 2009, only an estimated three percent of the value-added was from China.
SOURCE: Yuqing Xing and Neal Detert, “How the iPhone Widens the United States Trade Deficit with the People’s Republic of China,” ADBI Working Paper Series, No. 257, Revised May 2011.
Strategic Priorities
China’s innovation push is regarded as integral to achieving a number of top national strategic objectives, such as national security, boosting productivity, addressing what many to believe to be a budding health-care crisis, and meeting future energy needs.
Renewable energy is an especially high priority. China’s energy consumption has nearly doubled in five years and is expected to double again in another five years. Currently, the nation relies almost entirely on fossil fuels, especially coal, to generate electricity. “Against this background, renewable energy is our inevitable choice,” explained Ren Weimin of the National
Development and Reform Commission.73 Beijing’s target is for a blend of wind, hydro, solar, nuclear, thermal, and other non-fossil fuels to account for 15 percent of consumption by 2020, 20 percent by 2030, and one-third by 2050.74 That compares to 8.3 percent now. Government also is helping build domestic markets for domestic solar and wind power, energy-efficient solid-state lighting, and electrified vehicles industries through government purchases and generous incentives for consumers. Mr. Ren said China is developing a “comprehensive policy and institutional framework” for renewable energy.
Information and communications technologies (ICT) also are strategically important, not only as promising Chinese growth industries in themselves but also as a means for modernizing the economy. China is becoming a global power in ICT manufacturing and an increasingly important market. In 2011, for example, it produced 140 million PCs and 40 billion ICTrelated chips. China has 921 million cell phone and 485 million Internet users.75 China now is investing heavily to deploy high-speed broadband infrastructure, for example. China views broadband as a catalyst for new growth industries such as software, logistical services, information technology outsourcing, and a wide range of digital devices. Government targets call for 30 percent annual growth for software and information services industry and 28 percent annual growth in software exports.76 China’s domestic electronic commerce industry is estimated to be worth $400 billion industry a year77 and is growing at around 25 percent a year.
In terms of hardware and software, China is likely to concentrate its R&D efforts on embedded systems, advanced engineering software, large-scale digital control equipment and systems for production lines, integrated IT systems, encryption, virtual reality technologies, and new materials, according
______________________
73 From presentation by Ren Weimin of the National Development and Reform Commission in Building the 21st Century: U.S. - China Cooperation in Science, Technology, and Innovation, op. cit.
74 State Council of China, “National Medium- and Long-Term Program for Science and Technology Development, 2006-2020” (http://webcache.googleusercontent.com/search?q=cache:y800l0iQlS8J:www.cstec.org/uploads/files/National%2520Outline%2520for%2520Medium%2520and%2520Long%2520Term%2520S%26T%2520Development.doc+china+National+Medium-+and+LongTerm+Program+for+Science+and+Technology&cd=18&hl=en&ct=clnk&gl=us&client=firefox-a).
75 Data from presentation by Xu Jianping of the National Development and Reform at the Sept. 19, 2011, National Academies symposium “U.S.-China Policy for Science, Technology, and Innovation” in Washington, DC.
76 China’s Eleventh Five-Year Plan (2006-2010) also calls for producing around 15 major software enterprises with sales exceeding RMB 10 billion. For a good analysis of China’s information technology and communication strategy by Indian software-industry association Indian softwareindustry association NASSCOM, see “Tracing China’s IT Software and Services Industry Evolution,” whitepaper prepared by NASSCOM Research, August 2007 (http://www.businessstandard.com/general/pdf/082107_01.pdf).
77 Sirkin, Zinser, Hohner, op. cit.
to a National Research Council assessment. All of these are “areas of weakness and obstacles to autonomy in the IT communications,” the report said.78 Improvement in such areas can “improve and deepen” economic development across industries and the country, explained Xu Jianping of the National Development and Reform Commission’s High-Tech Department. Therefore, the government “has made new-generation IT development a core priority,” he said.79
Actors in China’s Innovation System
The Shifting Role of Research Institutions
The main conduits for disseminating technology to China’s corporate sector are the some 4,000 research institutes controlled by central ministries, local governments, and the Chinese Academy of Sciences. Compared to appliedresearch institutes of nations and regions such as Germany, Taiwan, and Finland, the majority of those in China are regarded as having relatively weak linkages with private industry. Reforms since the 1990s, however, have turned several institutes into effective organizations for developing industrial technologies and transferring them to a wide range of enterprises.
Institutes were given several options to cope with funding cuts. They could become the technology-development arms of state enterprises, become contract research organizations for government and industry, or go into business themselves. “When it happened, we were very puzzled, upset, and lost,” explained Tian Zhiling, of the China Iron and Steel Research Institute Group (CISRI). “We were being abandoned by the government.” Seventy percent of CISRI’s employees had master’s and Ph. D. degrees and the institute received tax reductions for five years to enter business. But it had little experience with marketing, mass production, finance, and entrepreneurship.80
In 1999, 242 central level research institutes under 10 industry bureaus were transferred into enterprises. Local governments transferred another 5,014. Now, these institutes have $17.5 billion in annual revenue and have quadrupled their profits since 2005 to $2.2 billion.81 The Research Institute of Petroleum Processing, for example, now develops refining and alternative-energy technology for SINOPEC. Zoomlion, formerly a research institute of the Ministry of Construction, now is China’s leading manufacturer of construction equipment, with 2010 sales of $7.8 billion. The 242 former state-owned institutes also earn nearly $3 billion in annual income transferring technology to
______________________
78 National Research Council, S&T Strategies of Six Countries, op. cit., pg. 26.
79 Xu Jianping presentation, op. cit.
80 Presentation by Tian Zhiling of the China Iron and Steel Research Institute Group in June 28, 2011, Chinese Academy of Engineering symposium.
81 Data from presentation by Tian Zhiling of the China Iron and Steel Research Institute Group in June 28, 2011, Chinese Academy of Engineering symposium.
Chinese companies and have earned more than 13,000 patents between 2006 and 2010. CISRI is regarded as a success story. It now leads in the development of new metallurgical technologies for China’s steel industry, the world’s largest, and its “third-generation steel” makes it a success story. It has developed highnickel stainless steel, ultra high-strength sheets use in automobiles, and “thirdgeneration steel.”82
The several thousand research institutes still controlled by government agencies employ around 277,000 R&D staff and focus on applied research and development relating to government missions.83 The Chinese Academy of Science has numerous institutes that have created some 400 enterprises84. The relative role of government institutes in the national innovation system has declined, however. The share of national R&D spending by research institutes has dropped from more than 60 percent a decade ago to around 18 percent of national R&D expenditure, compared to 26.4 percent by universities. Their staffs also have declined. Many state institutes still tend to focus on patents and publishing papers, however, rather than on disseminating technology to industry. Improving these linkages is a strong government priority. Since 2009, institutes have joined more than 40 strategic alliances with industry in areas such as clean coal and solid-state lighting.85
Expanding the Mission of Universities
China’s higher education system has expanded tremendously in recent decades in size and scope. Between 1980 and 2008, the percentage of Chinese aged 18 to 22 with a college education rose from 2 percent to 23 percent.86 The number of Ph. Ds. in China, meanwhile, surged from 151,000 in 1999 to 267,000 in 2008, although the rate of growth has slowed to around 5 percent a year compared to annual increases of 20 percent or more a decade ago. 87
The first mission of universities is “to serve as an engine or driver of a country’s core competitiveness,” according to Lou Jing of the Ministry of Education’s Department of Science and Technology. The government also wants to “markedly raise competitiveness and the quality of higher education,”
______________________
82 Ibid.
83 From Dahlman presentation, Building the 21st Century: U.S. - China Cooperation in Science, Technology, and Innovation, op. cit.
84 The Chinese Academy of Sciences has 12 branch offices, 117 institutes organized as legal entities, over 100 national key laboratories and a staff of over 50,000 people. http://english.cas.cn/ACAS/BI/100908/+20090825_33882.shtml.
85 From remarks by Mu Rongping of the Chinese Academy of Sciences at the June 28, 2011, symposium at the Chinese Academy of Engineering in Beijing.
86 Report on the Development of National Education (www.cernet.edu.cn).
87 National Education Development Statistics cited by Su Jun and Joseph Zhou, “Chinese University in the National Innovation System,” presented at June 28, 2011 joint symposium at Chinese Academy of Engineering in Beijing.
she said, and to tighten collaboration among universities, government, and industry. 88
Chinese universities also have assumed a greater role in government and industrial R&D and creating new businesses. Research funding for Chinese universities has been rising around 20 percent a year, with nearly 40 percent of that now coming from industry. Universities are in charge of some 80 percent of National Science Foundation research programs and 40 percent of national hightechnology research-and-development programs. Universities are home to 60 percent of China’s “national pilot laboratories,” nearly two-thirds of its 140 “national key laboratories,” and 26 national engineering laboratories. They also operate 76 science parks. Universities produce more than one-third of Chinese patents for inventions and 60 percent of published science and engineering papers.89
Universities also operate 76 science parks in China. The Tsinghua University Science Park, or TusPark, ranks among the largest university science parks in the world. Launched in 1994, TusPark has a 20-building campus in Beijing with 400 companies and 30,000 employees. Google, Sun, Procter & Gamble, and Microsoft are among the multinationals with large R&D centers. There also are 200 innovative local companies—more than half of them established by returnees from overseas.90 Unlike most Chinese science parks, TusPark also has an active incubator and entrepreneurial-training program for start-ups.
Compared to universities in the U.S., however, most of those in China tend to be ivory towers that put top priority on publishing papers, many of them of questionable quality, in scientific and technical journals. Some scientists blame a research funding system that puts too little emphasis on independent peer review.91 In an editorial in Science magazine, Yigong Shi and Yi Rao, the respective deans of the life sciences programs at Tsinghua University and Peking University, said that major grants often are awarded through personal connections with powerful bureaucrats. Shi and Rao contended that China’s research culture “wastes resources, corrupts the spirit, and stymies innovation.”92
Although 1,354 Chinese institutes of higher learning report R&D programs, less than 50 elite schools dominate important research. Nine
______________________
88 Ibid.
89 Statistics from presentation by Lou Jing of the Ministry of Education’s Department of Science and Technology in Building the 21st Century: U.S. - China Cooperation in Science, Technology, and Innovation, op. cit.
90 From presentation by Wu Hequan of Tsinghua University Science Park in June 28 joint symposium.
91 For a critique of China’s scientific research system, see Yigong Shi and Yi Rao, “China’s Research Culture,” Science, Vol. 329, no. 5996, Sept. 3, 2010.
92 Yigong Shi and Yi Rao, “China’s Research Culture, Science, Vol. 329, p. 1128, Sept. 3, 2010.
universities, including Peking University, Tsinghua, Zhejiang, and Jiaotong, account for one-quarter of China’s scientific papers and citations.93 The percentage of Chinese researchers at universities has dropped steadily since 1999, to around 15 percent and, although government research grants to universities have grown dramatically, their share of total R&D spending in China has dropped since 1986 to around 8.5 percent, compared 12.8 percent in the United States.94 Even though more than half of Chinese university research is regarded as applied, there still is a debate at many universities over whether they should focus only on basic research, according to Joseph Zhou of Tsinghua University. “The university role in applied research is a big question mark,” Dr. Zhou said, because R&D in China is overwhelming applied.95
Chinese universities also have a long way to go to reach world standards. Only eight rate among the world’s top 400 schools, according to QS World University Rankings, compared to 86 U.S. institutions. The highest is Peking University at No. 47. Shanghai’s Fudan is next at No. 105.96
China has launched a number of campaigns to improve this status. Project 211, introduced in 1993, seeks to make 100 universities among the best in the world. The $4.5 billion 985 program, begun in 1998, seeks to raise 39 existing universities to world standards. Central and local governments also are supplying funds for universities to recruit star faculty and establish endowed chairs. A distinguished young scholar program provides cash awards to promising young scientists. The Ministry of Personnel administers a program to identify 100 promising scientists on the frontier of international research, 1,000 leaders of advanced research projects, and 10,000 leaders for academic disciplines.97
When it comes to starting companies, one unorthodox aspect of Chinese universities is their propensity to retain ownership or management control. While Chinese universities have spun off 3,665 enterprises, they run or own another 3,569 enterprises.98 Some of the more significant university-run enterprises include Tsinghua Tongfang, an information technology and environmental technology company owned by Tsinghua University that is listed on the Shanghai Stock Exchange, embedded system company Beida Jada Bird (owned by Beijing University), and information technology company Neusoft (Northeastern University). The majority of firms run and owned by universities are not engaged in science and technology. Dr. Zhou said the large scale, number, and management challenges at university-run enterprises remain
______________________
93 Springut, Schlaikjer, and Chen, op. cit
94 Su and Zhou, op. cit.
95 From remarks by Joseph Zhou of Tsinghua University at June 28, 2011, joint symposium.
96 QS World University Rankings 2010/2011 (http://www.topuniversities.com/universityrankings/world-university-rankings).
97 These programs are described in Springut, Schlaikjer, and Chen, op. cit.
98 China Statistical Yearbook on Education data cited by Su and Zhou.
significant issues in China.99 Because only a small portion of university businesses are successful—and can pose serious financial liabilities for universities—the government has been encouraging universities to yield management control at enterprises to professionals so they can be run as modern businesses.100
Chinese Corporations as Innovators
According to Chinese statistics, enterprises are the chief drivers of innovation in China. Large and small enterprises account for around 70 percent of R&D investment. They spent nearly $50 billion on R&D in 2009, seven times more than in 2000, and employed nearly 1.5 million R&D personnel, three times the 2000 level.101
These investments have enabled China to rapidly become a major global force in a range of advanced industries. Despite all of that activity, however, corporate China can boast few breakthrough products or technologies with the notable exception of internet based e-ecommerce and social network sites, such as dynamic e-commerce and social network sites such as Tencent, Alibaba, and Baidu. Although China is a leader in some areas of cancer research and genomics,102 Chinese pharmaceutical companies have marketed few medicines globally except for traditional remedies. China is a leading producer of lithium-ion batteries, but they use decades-old chemistries. China is developing its own narrow-body jet to compete with Boeing and Airbus, but the core systems come from foreign aerospace firms and the body is based on a 1980s design by McDonnell Douglas. China is one of the leading exporters of solar cells and modules, but they use mature polycrystalline silicon technologies.103 Asked to cite examples of important innovations by Chinese companies in any industry, multinationals executives in China could not come up with any. Said one: “I don’t think there is a single success. They have the technology they believe they can scale globally, but if they try to compete on a level playing field they will have problems.”104 Chinese officials agree that corporate innovation remains a significant challenge. China needs to “make enterprises the engines of innovation, as in the United States,” stated Li
______________________
99 Zhou presentation.
100 Xue, “Universities in China’s National Innovation System,” op. cit.
101 Data cited in Springut, Schlaikjer, and Chen, op. cit.
102 For a collection of articles that highlight recent cancer research in China, see Cell Research’s special issue on cancer research in China. See Cell Research published online on 16 April 2007.
103 See Dexter Roberts and Pete Engardio, “China’s Economy: Behind All the Hype,” BusinessWeek, Oct. 23, 2009.
104 U.S. company interview in Beijing (June 2011). (NB: Names and affiliations of this and other interviewees have been withheld pending permission.)
Guoqing, director-general of the State Council Central Finance and Economics Office.105
This does not mean Chinese companies are not making rapid progress in innovation. One example is data communications equipment. Huawei Technologies is the world’s third-largest makers of network equipment106 and ranked as one the world’s largest network equipment makers, ranking No. 1 in mobile broadband systems, DSL, and global optical networks and No. 3 in routers by various market research firms.107 Huawei says it spends 10 percent of revenue on R&D, employs 51,000 research staff, and filed for more than 8,000 foreign patents.108 Although Huawei does not boast breakthrough products, it has a reputation for innovative applications and solutions in wireless communications.109
Huawei’s top Chinese rival, ZTE, is not far behind. The $10 billion company also invests 10 percent of sales in R&D. It has 30,000 R&D staff and 18 R&D centers, including several in the U.S. Annual revenue have risen from around $3 billion to $10 billion since 2006, with 60 percent of those revenue from overseas.110 It also contracts out research to more than 20 Chinese universities. Among its innovations is what ZTE calls the world’s smallest base station for Long Term Evolution (LTE), a 4G mobile communication standard, which costs half the price of its previous base stations and lowers power consumption by 30 percent. Major research areas include cloud computing and wireless technology beyond 4G. ZTE also has emerged as the world’s No. 4 maker of wireless handsets, most of them sold under the private labels of carriers like Vodaphone, T-Mobile, and Verizon. Of the 120 million units it expects to ship in 2012, 18 percent are expected to be smart phones.111
Breakthrough innovation remains a challenge for ZTE’s handset business. As one ZTE researcher put it, “We see the amazing innovations by Apple.” Also, most of the core components ZTE’s handsets are imported, such as memory chips, displays, and batteries are from South Korea and Japan. Another challenge is that R&D costs are rising. In China, engineers now earn about $40,000 a year, compared to around $120,000 in Dallas, and job-hopping to other companies has become more intense. As a result, it wants to market its
______________________
105 From presentation by Li Guoqing of the State Council Central Finance and Economics Office at the Sept. 19, 2011 National Academies symposium “U.S.-China Policy for Science, Technology, and Innovation” in Washington, DC.
106 See The Economist, “Up, Up and Huawei: China has Made Huge Strikes in Network Equipment,” Sept. 24, 2009.
107 Rankings cited on Huawei corporate Web site.
108 Huawei data from Web site.
109 See Huawei press release, “Huawei Receives Innovation Awards for Contribution to CDMA Development,” June 17, 2011, Huawei Web site (http://www.huawei.com/en/abouthuawei/newsroom/press-release/hw-093167-cdma-award-guangzhou.htm).
110 ZTE data.
111 Data supplied by ZTE.
own branded handsets. Market pressures are a much bigger pressure to innovate than government directives. As the ZTE researcher noted, “I don’t think about national policies. We look at the market for next year. I just encourage my designers to do fashionable designs.”112
The multinational research centers cover a vast range of innovation themes. General Electric’s China Technology Center (CTC) in Shanghai supports over 20 research labs addressing topics such as digital manufacturing, advanced materials, power electronics, and coal polygeneration.113 Caterpillar’s Wuxi research center, established in 2009, supports the company’s Asia-Pacific research needs in areas which include electronics, hydraulics, fuel systems and engine testing.114 Corning’s research center in Shanghai, formed in cooperation with the Chinese Academy of Sciences, is performing research on ceramics, non-metal new materials and lithium cells.115 In 2011, Intel established a research center in Chengdu with a target staffing of 200 people to develop technology for application in tablet computers and games.116 In 2010, Toyota announced it would invest $689 million to establish a wholly-owned 200-person research center in China to study energy-efficient and new energy vehicles.117 Boeing opened an R&D center in Beijing in 2010 to study airplane cabin environment and designs, advanced materials, and computer science.118
One hindrance to corporate innovation, in the eyes of some analysts, is the growing domination of state-owned and –supported companies at the expense of smaller, privately held enterprises. China’s estimated 8 million small- and medium-sized enterprises account for 60 percent of the nation’s industrial output and employ three-quarters of the labor force. They also generate 30 percent more output than state-owned enterprises with the same amount of capital, labor, and materials, according to Renmin University economist Dawei Cheng. Yet they receive little money from China’s statecontrolled banking system, which primarily lend to government-connected companies. The typical small Chinese enterprise receives only around 10 percent of its working capital from banks, compared to around 40 percent in South Korea and Thailand.119
______________________
112 Interview with ZTE in Shanghai.(June 2011).
113 http://ge.geglobalresearch.com/locations/shanghai-china/shanghai-china-featured-labs/.
114 “Caterpillar Expands China Research Center,” Business Daily Update (China) (January 10 2012).
115 “Corning Sets Up Research Center on the Mainland,” Chinadaily.com (June 29, 2011).
116 “Tenacent, Intel to jointly set up Research Center,” SinoCast (April 13, 2011).
117 Toyota already operated an R&D center in Tianjin. “Toyota rolls out wholly owned Research Center,” Chinadaily.com (November 22, 2010).
118 “Boeing, Tsinghua Open Research Center” Chinadaily.com (October 21, 2010).
119 Dawei Cheng, “China SMEs: Today’s Problem and Future’s Cooperation,” PowerPoint presentation, School of Economics, Renmin University of China. Presentation can be accessed at http://www.slideshare.net/MIISChina/china-smes-339690.
Box 5.3 Innovation with Chinese Characteristics
Westerners tend to equate innovation with creative ideas and gamechanging goods and services. Innovation as generally practiced in China is more modest. The Chinese government actually uses several definitions of innovation. The Chinese government distinguishes “original innovation” (yuangshi chuangxin), “integrated innovation” (jicheng chuangxin) in which existing technologies are fused together in new ways, and “re-innovation” (yinjin xiaohua xishou zaichuangxin), in which imported technologies are assimilated and improved upon.120 China has put a heavy emphasis on assimilating foreign technology in order to develop indigenous products. However, increasingly China has simply stressed the need to develop (and to favor in procurement) Chinese-owned IP, incorporated in products made by Chinese-owned companies. President Hu Jintao has committed to treat foreign invested enterprises in China as being Chinese for purposes of future procurement. This has not yet translated into complete national treatment at every level of the Chinese government.
China’s state enterprises also enjoy many tax advantages, pay lower rates for loans, and do not have to dispense profits to shareholders. As a result, they are under little pressure to generate profits and can amass cash. The average tax burden of 992 state-owned enterprises was just 10 percent, compared to as much as 24 percent for private enterprise, according to the Unirule Institute of Economics, a non-government Chinese think tank. State-owned companies also pay real interest rates of just 0.016 percent for their capital and pay little or nothing for land. A Unirule study found that reported profits of 132 companies under management of the central government’s State-Owned Assets Supervision and Administration Commission more than tripled from 2001 to 2008. Yet when low taxes, finance costs, and other special advantages are accounted for, the average real return on equity of state-owned enterprises over that period was negative 6.2 percent.121
______________________
120Denis Fred Simon, Cong Cao, and Richard P. Suttmeier, “The Evolution of Business China’s New Science and Technology Strategy: Implications for Foreign Firms,” China Currents, Vol. 6, No. 2, Spring 2007 (http://www.chinacenter.net/China_Currents/spring_2007/cc_simon.htm).
121 See Jiang Hong, “State-owned Enterprises Research Project Press Release Conference & Academic Seminar Successfully Held in Beijing,” Unirule Institute of Economics. 2011. Access at http://english.unirule.org.cn/Html/Events/20110308200838427.html.
Multinational Research Centers
Foreign companies have been key catalysts of China’s rise in highthrough industries through joint ventures, training programs, and technologytransfer agreements with Chinese partners negotiated in return for access to the domestic market. Foreign companies also have used China as a growing product-development base for their own products, establishing at least 750 R&D centers in Beijing, Shanghai, Guangzhou, Chengdu, and other cities as of 2005.122 The vast majority of multinational R&D activity in China has been devoted to adapting products and technologies for the domestic market or for products manufactured in China for export.123
Such operations continue to grow. Since opening in 2000, General Electric’s research center in Shanghai’s Pudong district has grown to 1,500 researchers, two-thirds of whom have masters and Ph. D. degrees. The center files around 100 patents a year. Another 700 researchers are in centers in Beijing and Wuxi. The Shanghai center originally was intended to serve as an extension of GE Global Research in Niskayuna, N. Y., to tap lower-cost Chinese talent to help with next-generation products.124 Although the center has 200 engineers working on long-term research, most of the center’s work serves GE’s $6 billion annual businesses in China in areas such as aircraft engines, medical equipment, water management systems, rolling stock, oil and gas technology, and home appliances—as well as GE’s 26 manufacturing plants in China. GE also is setting up a network of “innovation centers.” One in Xian, for example, focuses on light-emitting diodes, coal gasification, and aviation. Another in Chengdu is devoted to rural health care and oil and gas, while one in Shenyang works on manufacturing technology and energy.125
Innovations originally for the China market, however, increasingly make their way into products sold around the world. GE Healthcare is one success story. The unit’s China operations develop lower-cost and simpler-touse CT scanners and portable ultrasound equipment for China. Two-thirds of the equipment now is sold in other emerging markets and even in the U.S. 126
Some Chinese research operations are starting to serve the global needs of U.S. companies. At the IBM Research facility, opened in 1995, has grown to 600 researchers. Virtually all work on global projects. “Originally our (Chinese) researchers were very timid and lacked the confidence and courage to do things,” explained a GE representative. “That is completely different today. The experienced ones are really shining, doing extremely well in patents and
______________________
122 Data from Lan Xue, “China’s Innovation Policy in the Context of national Innovation System Reform,” Tsinghua University, Aug. 27, 2007 (http://www.oecd.org/dataoecd/60/62/39310514.pdf).
123 Company interviews in Beijing and Shanghai.
124 US Company interview in Shanghai.(June 2011).
125 US Company Interview in Shanghai.(June 2011).
126 US Company interview in Shanghai.(June 2011).
contributing to global projects.”127 In all, IBM co-develops products with 10,000 Chinese partners in 350 cities. It also has 100 joint laboratories and technology centers with Chinese universities and offers curricula that have helped trained 860,000 Chinese students and 6,500 teachers.128
Microsoft’s research center in Beijing also has become integral to development of next-generation products launched around the world. Established in 1998 as basic research laboratory with a couple hundred scientists in fields such as face recognition and motion tracking, the center now is “involved in almost every product Microsoft develops”.129 The center recently opened a new $400 million campus in Beijing’s Haidan high-tech district that serves as Microsoft’s research hub the Asia Pacific. The some 3,000 staff, including contractors, work in areas such as cloud computing, search tools, hardware development, the mobile Internet, and “natural user interfaces” that enable users to interact with computers using speech, gestures, and expressions.130 About 95 percent of the work is deployed globally. Since it was established, the lab has published more than 3,000 papers in top international journals and conferences and contributed 260 innovations used in products such as Windows 7, Office 2010, Xbox, and Windows Mobile.131 The Beijing center has played an especially important role in development of Kinect, the technology that allows users of Xbox 360 game players to control video and music with the wave of a hand or by making sounds.132 The advantage of being in Beijing is the proximity to major universities such as Tsinghua and Peking University. In China, he said, Microsoft can recruit from among 300,000 computer science graduates a year, about 20 percent of whom are on par with the best in the U.S.
One challenge is that multinationals no longer are the preferred employers of new Chinese graduates, foreign executives said. Several multinationals also said they are losing considerable numbers of seasoned talent to Chinese state-owned enterprises or private Chinese companies willing to double and even triple their salaries, offer senior positions, and provide housing.
Coping with Indigenous Innovation Rules
American companies interviewed in China cited mounting pressures to transfer core technology and discrimination against foreign companies for contracts as their most serious concerns. The government, which has not signed
______________________
127 US Company interview in Beijing (June 2011).
128 From presentation by Mark E. Dean of IBM Research in Building the 21st Century: U.S. - China Cooperation in Science, Technology, and Innovation, op. cit.
129 US Company Interview in Beijing (June 2011).
130 Descriptions of major research programs at Microsoft Research Asia can be found on the center’s Web site at http://research.microsoft.com/en-us/labs/asia/msrabrochure_english.pdf.
131 Microsoft Research Asia Web site.
132 US Company Interview. in Beijing (June 2011).
World Trade Organization protocols on government procurement, essentially compels foreign makers of a wide range of advanced products to manufacture in China and transfer technology to domestic companies.133
Companies said that such concerns have intensified in recent years. Although China is a major exporter of solar modules to Europe and the U.S., it requires at least 80 percent of equipment for its own solar power plants to be domestically produced.134 Due to government procurement policies and rapid expansion by Chinese producers, the foreign share of China’s annual new purchase of wind power equipment has fallen from nearly 80 percent to around 20 percent between 2004 and 2008.135 Government bodies essentially require makers of lithium-ion batteries for cars to manufacture in China in order to sell into the growing domestic automobile market.136 Leveraging its huge market for aircraft, China is using technology transferred by U.S. and European aircraft, engine, and avionics suppliers to achieve its ambitious plans to build a globally competitive commercial aerospace industry.137 The government also aims to increase the self-sufficiency ratio of integrated circuits used in communications and digital household products to 30 percent and to 70 percent in products relating to national security and defense.138 The Chinese policies spurred an outcry from American and European companies.139 Beijing also has reportedly told General Motors that its sales of the Chevrolet Volt plug-in hybrids will not
______________________
133For example, see presentations by James M. Forcier of A123 Systems in Building the U.S. Battery Industry for Electric-Drive Vehicles.
134 Keith Bradsher, “China Builds High Wall to Guard Energy Industry.” International Herald Tribune, July 13, 2009.
135 An extensive treatment of China’s policies to promote its renewable energy equipment sector can be found in Thomas Howell, William A. Noellert, Gregory Hume, Alan Wm. Wolff,, China’s Promotion of the Renewable Electric Power Equipment Industry: Hydro, Wind, Solar, Biomass, Dewey & LeBoeuf LLP prepared for National Foreign Trade Council, March 2010.
136 See presentation by Jason M. Forcier of A123 Systems in forthcoming volume National Research Council, Building the U.S. Battery Industry for Electric-Drive Vehicles: Progress, Challenges, and Opportunities, Charles W. Wessner, ed., Washington, DC: The National Academies Press.
137 See Roger Cliff, Chad J. R. Ohlandt, and David Yang, Ready for Takeoff: China’s Advancing Aerospace Industry, RAND National Security Research Division for U.S.-China Economic and Security Review Commission, 2011.
138 Ministry of Information Industry, “Outline of the 11th Five-Year Plan and Medium-and-LongTerm Plan for 2020 for Science and Technology Development in the Information Industry,” Xin Bu Ke [2006] No. 309, posted on ministry website Aug. 29, 2006.
139A report by the European Union Chamber of Commerce in China said that “industrial-policy interventions and restrictions on foreign investment have been on the rise” and that “European companies are increasingly concerned by the tendency for local companies to be favored over foreign-invested ones.” See European Union Chamber of Commerce in China, European Business in China Position Paper 2009/2010, executive summary (http://www.euccc.com.cn/images/documents/pp_2009-2010/executive_summary_en.pdf). Also see AmCham-China, “American Business in China: 2010 White Paper,” May 22, 2010 (http://web.resource.amchamchina.org/news/WP2010LR.pdf).
qualify for subsidies of up to $19,300 per car available to other hybrids in China unless it transfers core technologies to domestic manufacturers.140
In response to high-level complaints by foreign governments, Chinese leaders in 2011 sought to allay major concerns. On a visit to Washington in January 2011, President Hu signed a joint statement with President Barack Obama in which he pledged that “China will not link its innovation policies to the provision of government procurement preferences.” The statement also said China will seek to join the WTO Government Procurement Agreement by the end of 2011.141 At a meeting with U.S. and Chinese businessmen, President Hu said of companies setting up operations in China: “In terms of innovation productions, accreditation, government procurement, (and) IPR protection, the Chinese government will give them equal treatment.”142 On June 29, 2011, China’s Ministry of Finance said it would not require companies to transfer patents and other intellectual property to China as a condition for selling equipment and technology to the government. The ministry also said it would rescind other regulations linking government procurement contracts to “indigenous innovation” rules. 143
Chinese officials have sought to assure multinationals in private meetings as well. An executive of one U.S. corporation with extensive operations in China said an official from the Ministry of Foreign Trade and Cooperation told him that the indigenous innovation policies don’t apply to his company because the government regards it as a Chinese company. The executive said his company felt no more discrimination selling products in China than in other nations, such as India, and that it has a fair opportunity to provide input on formation of standards. “Indigenous innovation has been bashed down and killed for now,” the executive said. “This is something we’ve taken off our list as something we have to focus on.”144 Another U.S. executive said that a high-level official of the Ministry of Science and Technology met with multinational representatives in June 2011 and explained that “indigenous innovation” is really about improving China’s ability to generate new ideas rather than displacing foreigners, and that China’s innovation system is open to multinationals. The MOST official also for the first time discussed ways in which foreign companies could participate in national government-funded research projects, an opportunity many multinationals have long sought.145
______________________
140 Keith Bradsher, “Hybrid in a Trade Squeeze, New York Times, Sept. 5, 2011.
141 The White House, “U.S.-China Joint Statement,” Paragraph 27, Office of the Press Secretary,” Jan. 19, 2011 (http://www.whitehouse.gov/the-press-office/2011/01/19/us-china-joint-statement).
142 The White House, “Remarks by President and Obama and President Hu in a Roundtable with American and Chinese Business Leaders,” Office of the Press Secretary, Jan. 19, 2011 (http://www.whitehouse.gov/the-press-office/2011/01/19/remarks-president-obama-and-presidenthu-roundtable-american-and-chinese).
143 Reuters, “China Eases Government Procurement Rules After U.S. Pressure,” June 29, 2011.
144 U.S. company interview in China.
145 U.S. company interview in China
Other American business people based in China, however, said they remain under pressure to transfer core technology to Chinese companies, either to joint ventures or through licenses. One executive that does not want to license its core designs to Chinese companies for fear that they will become future competitors said government officials said it should transfer the knowhow because technology is a “human asset” and should be shared. The company is afraid that if it agrees to license one design, it will become a “slippery slope” in which more technology transfers would be expected. Although there have been “positive comments from individuals” at MOST, the executive said, “the general philosophy there hasn’t changed.”146
U.S. analysts and executives generally regard China’s shifting rhetoric on indigenous innovation as a tactical retreat, rather than a fundamental shift in government thinking,147 and attribute the mixed government messages to the different agendas of different agencies. MOST is regarded as the most dogmatic about enforcing indigenous innovation rules because it spearheads the drive to advance domestic industries. The Ministry of Information Technology has an interest in protecting Chinese IT and telecom companies. The trade ministry, MOFTEC, is more indifferent because its mission is to keep foreign markets open to Chinese products. State-owned industrial companies, meanwhile, tend to be strong advocates of indigenous innovation policies in order to protect their domestic franchises. Private Chinese companies mainly care about being able to buy the best products. The type of foreign business also makes a difference, these executives said. Companies selling expensive high-tech hardware and core components in high-priority Chinese industries are under the most pressure to transfer technology, they said. Companies that offer critical services as well as hardware are under the less pressure as long as most of their products are made in China.148
Opportunities for Collaboration
Despite these disputes and the indigenous innovation policy, there are substantial opportunities for scientific and technological collaboration between China and the U.S. Mr. Yang of the Ministry of Science and Technology said China remains committed to international collaboration as a vehicle to “absorb innovation” that can be adapted to “Chinese conditions.”149
At a government-to-government level, the U.S. and China have signed some 50 cooperative agreements over the past decade. In energy research and
______________________
146 U.S. company interview in China
147 For example, see Adam Segal, “China’s Innovation Wall: Beijing’s Push for Homegrown Technology,” Foreign Affairs, Sept. 28, 2010 (http://www.foreignaffairs.com/articles/66753/adamsegal/chinas-innovation-wall) and US-China Business Council, Issues Brief: China’s Domestic Innovation and Government Procurement Policies, March 2011.
148 Company interviews in China.
149 Yang presentation, op. cit.
life sciences, “the United States and China are, in every sense, building a global partnership,” noted Deputy Assistant Secretary of State Anna Borg.150
Cooperation through universities is also growing. The University of Maryland, for example, has an extensive relationship with China.151 As the university’s former president C. Dan Mote has pointed out, its Institute for Global Chinese Affairs has trained 3,000 Chinese executives since 1995, while 160 Chinese executives have received one-year degrees from Maryland’s Executive Master’s in Public Administration program. The University of Maryland also has a special “international incubator” that has helped launch 11 Chinese companies in industries such as solar energy and software. In 2002, the Chinese government and Maryland set up a joint research park near campus that now houses facilities of companies from Beijing, Shanghai, and Guangzhou. As Caroline Wagner has pointed out, the growth of such networks creates unprecedented opportunities for cooperation in science to address shared challenges in areas such as energy and health.152
As the world’s number one and number two economies, the U.S. and China are the two biggest consumers of energy and together emit 40 percent of the world’s greenhouse gasses. It is in both nations’ interests to accelerate development of clean energy. The National Renewable Energy Laboratory (NREL), based in Boulder, Colo., has a range of collaborations with Chinese companies, research institutes, and government agencies, from long-range planning of wind-power to commercializing specific bio-fuels.153 Two joint research centers, one focusing on wind power and the other on solar, also have been established. A wide-ranging Sino-U.S. partnership in bio-fuels involves several Department of Energy and Department of Agriculture labs, Chinese research institutes, and mainland companies such as Sinopec, PetroChina, CNOOC, and COFCO.
The Sino-U.S. partnership in medicine is even more deep-rooted. Just as America experienced as its population aged, cancer and other chronic diseases are overtaking infectious diseases in China as the top killers and present a “major health care crisis,” according to Anna Barker of the National Cancer Institute.154 China has 1.6 million cancer deaths a year and reported
______________________
150 From presentation by Deputy Assistant Secretary of State Anna Borg in Building the 21st Century: U.S. - China Cooperation in Science, Technology, and Innovation.
151 C. Dan Mote, “Universities as Drivers of Growth in the United States,” in National Research Council, Building the 21st Century : U.S. China Cooperation on Science, Technology, and Innovations, Washington, DC: The National Academies Press, 2011.
152 Caroline S. Wagner, The New Invisible College: Science for Development, Washington, DC: Brookings, 2008.
153 From presentation Robin L. Newmark of the National Renewable Energy Laboratory in Building the 21st Century: U.S. - China Cooperation in Science, Technology, and Innovation.
154 From presentation by Anna Barker of the National Cancer Institute in Building the 21st Century: U.S. - China Cooperation in Science, Technology, and Innovation.
2.2 million new cases in 2009. The crisis “will get much, much worse in the next 10 to 15 years,” she said.
The U.S. needs China’s help, too, in order to accelerate the discovery of new treatments and contain skyrocketing drug-discovery costs. New cancer cases in the U.S. are forecast to rise by at least 30 percent by 2020.155 Annual U.S. spending on cancer treatment is expected to rise from $213 billion to $1 trillion a year. China has immensely valuable data on cancer cases and the largest talent pool of microbiologists, many of them U.S.-trained. China also is a leader in genomics research; its researchers were among the first to identify the SARS genome. The National Cancer Institute is working with Chinese institutes on an ambitious project to sequence genomes of all cancers. It also is partnering with the Beijing Genomics Institute, the world’s largest next-generation sequencing center, in brain-tumor research.
China’s depth in nanotechnology research, which Dr. Barker said will “touch everything we do in medicine in the next 10 years,” is another area of “very strong collaboration.” Five thousand scientists at 50 Chinese universities, 20 Chinese Academy of Science Institutes, and 300 nano-technology enterprises focus on the field.156
While China needs international cooperation, however, Mr. Deng of the State Council Research Office stressed that it still must develop its internal capabilities. “On the one hand, we have to increase our collaboration and exchange with other countries,” he said. “But on the other hand, we have to solve problems with our own efforts. There are a lot of problems that can be solved only with international cooperation.” He added that because China is such a large country, it has many “urgent problems” such as water management, energy, and environmental challenges that “we have to solve with selfreliance.”157
Assessing Chinese Innovation
China’s destiny as a science and technology superpower appears to be assured. The nation’s steady policy focus and heavy investments in R&D, human capital, infrastructure, and industrial capacity—combined with the world’s biggest growth market—all put China in a powerful position to be a leading if not dominant force across a spectrum of emerging advanced industries. China also can play an invaluable role as a research partner in conquering the world’s biggest 21st century challenges.
The nation has all of the potential to become a leading force in innovation as well. China’s emergence as a source of global patents, for example, demonstrates that it has tremendous inventive capacity key high-tech
______________________
155 Ibid.
156 Data from Science (2005) 309: 65-66.
157 Deng Wen Kui presentation, op. cit.
sectors such as digital computers and telephone and data transmission systems.158
Whether China is on track to achieving its desire to become a giant engine of innovation is less clear. The study by CENTRIC offered a negative prognosis:
“… (T)he Chinese model of science in its present form is unlikely to deliver the types of creative research on which future high-technology leadership will depend….. China has yet to show that it can meaningfully use the tools of the state to drive the commercialization of discoveries in research labs in a competitive manner. And the nation’s drift in a technonationalist direction could compromise China’s enabling international scientific links.159
Mu Rongping of the Chinese Academy of Sciences maintains that the “distance between China and developed nations is still very, very large.” Dr. Mu observes that there are “two Chinas”—one that is progressing rapidly in terms of the inputs needed to innovate and another that lags in terms of execution. He notes that China has leapt from 26th place to 17th between 2000 and 2006 in an index of 38 countries measuring national innovation capacity using a model that gives heavy weight to R&D spending and economic growth. In an index of national innovation effectiveness, however, China ranks No. 37, behind Mexico and Romania.160 And while China has significantly increased its output of scientific publications, the average citation rate for Chinese papers in the Essential Science Indicators database over the period 1998-2008 was still well below the world leaders in science and technology.161 [See Figure 5.4]
Chinese industries have indeed proved remarkably capable of “catching up” in maturing technologies and driving down prices. With few exceptions, however, they have yet to prove capable of competing at the leading edge. While there has been an explosion of patents, doubts have arisen over the quality of those patents.162 Although Chinese inventors filed 203,481 patent applications in 2008, according to the World Intellectual Property Organization, more than
______________________
158 Evey Y. Zhou and Bob Stembridge, “Patented in China: The Present and Future State of Innovation in China,” Thompson Reuters, 2010.
159 Springut, Schlaikjer, and Chen, op. cit.
160 See Mu Rongping, Song Hefa, and Chen Fang, “Innovative Development and Innovation Capacity-Building in China,” International Journal of Technology Management, Vol. 51, No. 2/3/4, 2010.
161 UNESCO, UNESCO Science Report 2010, p. 391.
162 For example, see Jody Lu, “Who is Making Junk Patents?”, China Daily, March 6, 2011 (http://ipr.chinadaily.com.cn/2011-03/06/content_12126586.htm). The local government practice of paying patent fees for the first several years also is believed to inflate patent applications. See Zhou and Stembridge, op. cit.
95 percent of those were filed domestically with the State Intellectual Property Office, note Anil K. Gupta and Haiyan Wang, authors of the book Getting China and India Right.163 Chinese inventors accounted for only 473 so-called “triadic” patents filed in the U.S., the European Union, and Japan, the world’s prime patent issuers. That compares to 14,525 triadic filings from Europe, 14,399 from the U.S., and 13,446 from Japan. In fact, China accounts for only 1 percent of patent filings and grants by any of the leading patent offices outside of China, even though it accounts for 11 percent of the world’s R&D spending. Gupta and Wang also conclude that the vast majority is for “tiny changes on existing designs.” Therefore, they label China an innovation “paper tiger” that emphasizes quantity over quality, resulting in “a pandemic of not just incrementalism but also academic dishonesty.”164
FIGURE 5.4 Citation rate for scientific papers 1998 to 2008.
SOURCE: UNESCO, UNESCO Science Report 2010, Paris: UNESCO Publishing, 2010, p.391.
______________________
163 Anil K. Gupta and Haiyan Wang, Getting China Right, San Francisco, Calif.: Jossey-Bass, 2009.
164 Anil K. Gupta and Haiyan Wang, “Chinese Innovation is a Paper Tiger,” Wall Street Journal, July 28, 2011.
A major question is whether a business culture that has focused on scale and market share is ready to shift to a model driven by adding value and creating breakthrough products. Another question is whether state-led policies and programs that try to put national boundaries around intellectual property and curtail foreign competition can succeed in an era when most of the world is moving toward models of open innovation and global cooperation. To the contrary, some analysts warn, such an approach could ultimately make Chinese industry less competitive.165
Some Chinese officials agree that fulfilling the high aspirations for innovation will require reform of government institutions and corporate culture. “At present, we believe the innovation of structure is more important than innovation of technology,” said Mr. Li of the State Council Central Finance and Economics Office. “Without organizational innovation, there cannot be technological innovation,” he said. “We have to learn from the United States.”166
China’s leadership, however, has proved pragmatic and willing to change course if it finds certain policies are retarding economic development. At a time when the U.S. is struggling to maintain funding for current programs, China is providing the financial resources and policy support needed to build a 21st century innovation system. The question now is whether it can devise the right policy framework for China live up to its potential.
While China’s leadership has proven to be pragmatic, committed, and willing to spend, China continues to face major challenges in its quest to become an innovator. Even so, as documented in Carl Dahlman’s recent work, the sheer scale of China’s policies, R&D expenditures, and markets are having an important impact in the U.S. and the rest of the world.167
India’s Changing Innovation System
The dual faces of its economy define India’s great innovation challenges. On the one hand, India is a global leader in information technology and business-process outsourcing services, which account for nearly $60 billion in annual exports and employ more than 2.5 million.168 On the other, more than one-third of India’s 1 billion people live below the poverty line, and three-
______________________
165 In her address at a conference on Chinese and U.S. innovation policies hosted by the National Academies, U.S. Assistant Secretary of State Anna Borg warned that Chinese investment barriers or domestic intellectual-property requirements “will ultimately be self-defeating.” See Anna Borg presentation in Building the 21st Century: U.S. - China Cooperation in Science, Technology, and Innovation, op. cit.
166 Li Guoqiang presentation, op. cit.
167 Carl J. Dahlman, “The Innovation Challenge: Drivers of Growth in China and India,” National Research Council, Innovation Policies for the 21st Century (Washington, DC: The National Academies Press, 2007) pp 45-60.
168 NASSCOM, “Indian IT-BPO Industry,” 2011. Data can be accessed at http://www.nasscom.in/indian-itbpo-industry.
quarters of those poor live in rural areas.169 Only 16 percent of India’s population has completed high school and 61 percent of the adult population is literate, compared to 97 percent in China. The World Bank estimates that only 4 percent of India’s workforce is formally employed in the modern private sector.170
For India’s world-class technology companies, the goal is to develop more proprietary intellectual property and gain global market share. Private Indian companies such as information-technology giants Infosys and Tata Consulting Services, pharmaceutical producers Piramal Life Sciences and Ranbaxy, and automotive companies Tata Motors and Mahindra & Mahindra and among the many Indian corporations devoting greater resources to R&D, releasing innovative goods and services at home, and striking out into global markets with branded products.
For the Indian government, however, the most urgent priorities in science and technology policy have been basic economic development. Although India’s economic growth rate has accelerated sharply since 2003, the benefits of India’s dynamic technology sectors have been slow to make a difference in the lives of hundreds of millions of people living in poverty. India is not just focused on improving its capacity to create new products, therefore. The Indian Government also now is paying more attention to what it calls “inclusive innovation,” which is defined as “using innovation as a tool to eliminate disparity and meet the needs of the many.”171
To satisfy the demands of both industry and society, India must dramatically improve its national innovation system.172 India has enormous potential. It has an immense and growing pool of young English-speaking technology talent, a much younger population than China’s, and a large diaspora of overseas Indian technology entrepreneurs and researchers who are rebuilding ties in their homeland. India’s economy is projected to grow by more than 7 percent a year for decades. India also has a highly innovative private sector and a number of elite higher-education institutes. India is an important high-tech R&D base for multinationals.
______________________
169 From presentation by T. S. R. Subramanian in National Research Council, India’s Changing Innovation system: Achievements, Challenges, and Opportunities for Cooperation, Charles W. Wessner and Sujai J. Shivakumar, editors, Washington, DC: The National Academies Press, 2007.
170 World Bank data cited in World Bank, Unleashing India’s Innovation: Toward Sustainable and Inclusive Growth, Mark A. Dutz, editor, The International Bank for Reconstruction and Development, 2007 (http://siteresources.worldbank.org/SOUTHASIAEXT/Resources/2235461181699473021/3876782-1191373775504/indiainnovationfull.pdf).
171 See National Innovation Council, Towards a More Inclusive and Innovative India, September 2010 (http://www.innovationcouncil.gov.in/downloads/NInC_english.pdf).
172 “India suffers from inefficiency in transforming its S&T investments into scientific knowledge (publications) as well as into commercially relevant knowledge (patents).” National Academy of Sciences, S&T Strategies of Six Countries, op. cit., p. 43.
While India is becoming a top global innovator, an extensive World Bank study concluded that the country is “underperforming relative to its innovation potential—with direct implications for long-term industrial competitiveness and economic growth.”173 The challenges are numerous. India invests only around 1 percent of GDP in science and technology.174 [See Figure 5.5] Government controls around 70 percent of national R&D spending,175 and the biggest recipients have been areas relating to national security, such as atomic energy, aerospace, and ocean exploration. Venture capital is scarce. The talent pool is constrained by the facts that only around 12 percent of college-age Indians are enrolled in higher education, and only 16 percent of Indian manufacturers offer worker training, compared to 42 percent in South Korea and 92 percent in China. India produces only 6,000 Ph. D.s a year in science and 1,000 in engineering.176 What’s more, the legacy of India’s obsession with selfsufficiency since independence in 1947 leaves it with some of the highest barriers to product imports, foreign direct investment, and inflows of intellectual property177 among major trading nations—constraining its access to global innovation. 178
Linkages between government research institutions and industry are weak. There is little collaboration between India’s 400 national laboratories and 400 national R&D institutes and private companies.179 A European Commission analysis noted that 70 percent of technologies developed by government-funded laboratories remain on the shelf. “A major weakness of the system was the lack of an innovation ecosystem where risk capital and intermediary mechanisms existed to foster and promote technology transfer and the commercialization of public R&D,” the report said.180 India’s 358 universities and famed Indian Institutes of Technology, meanwhile, traditionally have played little role in commercializing technology.181 The World Bank observed that even though recent government policies aimed at generating, commercializing, and absorbing
______________________
173 World Bank, Unleashing India’s Innovation: Toward Sustainable and Inclusive Growth, Mark A. Dutz, editor, The International Bank for Reconstruction and Development, 2007 (http://siteresources.worldbank.org/SOUTHASIAEXT/Resources/223546-1181699473021/38767821191373775504/indiainnovationfull.pdf).
174 GERD = gross domestic expenditures on research and development.
175 UNESCO data.
176 Data cited in World Bank, Unleashing India’s Innovation, op. cit.
177 The World Bank uses foreign licensing and royalty payments as indicators of intellectual property imports.
178 Vinod K. Goel, Carl Dahlman, and Mark A. Dutz, “Diffusing and Absorbing Knowledge,” World Bank, op. cit.
179 National Research Council, S&T Strategies of Six Countries, op. cit., pg. 38.
180 European Commission Enterprise Directorate-General, INNO-Policy Trend Chart Innovation Policy Progress Report: India 2009. This report can be downloaded at http://www.proinnoeurope.eu/trendchart/annual-country-reports.
181 Martin Gruber, and Tim Studt. “2011 Global R&D Funding Forecast: The Globalization of R&D,” R&D Magazine, Dec. 15, 2010.
R&D had achieved some important successes, “their effectiveness has not matched the needs of the Indian economy or been commensurate with the resources invested in them.” One reason is that private corporate participation has been minimal. Instead, initiatives are owned and managed by government bureaucracies that “suffer from complex, overlapping structures for policy making and decision making.”182
India’s New Innovation Push
India now is undertaking a number of initiatives to transform its innovation system.183 As the Planning Commission’s steering committee on science and technology explained in its report for the current Five-Year Plan, a “strong and vibrant innovation ecosystem” requires an education system that nurtures creativity, an R&D culture and value system that supports both basic research and applied technology, an industry culture that is keen to equity and foreign companies that can be involved.184

FIGURE 5.5 India invests less than one percent of GDP on R&D spending.
SOURCE: UNESCO, UNESCO Science Report 2010, Paris: UNESCO Publishing, 2010, p.371.
NOTES: GERD is gross expenditure on research and development. Years refer to fiscal years.
______________________
182 Carl Dahlman, Mark A. Dutz, and Vinod K. Goel, “Creating and Commercializing Knowledge,” World Bank, Unleashing India’s Innovation, op. cit.
183 For a summary of recent initiatives, see `India Rising’ Science (24 February 2012, Vol. 335),
184 Government of India Planning Commission, “Report of the Steering Committee on Science and Technology for Eleventh Five Year Plan (2007-2012),” December 2006.
After doubling national investment in R&D spending between 2002 and 2008 in current Indian Rupees, the government aims to boost research funding by another 220 percent under the current Five-Year Plan for 2007 to 2012. The goal is to boost national R&D investment to 2 percent of GDP by 2020. The government also is both expanding and reforming the nation’s highereducation system to strengthen basic research and commercialization. The government’s overarching science and technology strategy, as defined in “Technology Vision 2020,” puts a heavy emphasis on sectors like agriculture, food processing, health care, electric power, and infrastructure.185
The Five-Year plan calls for a number of new universities and greater collaboration between academia, research institutes, and industry.
In terms of research infrastructure, the plan provides for 10 “flagship” programs in areas such as water supply, sanitation, health, and telephony and a national network of globally competitive “centers of excellences” in a range of technologies.186 To help modernize India’s manufacturing sector, the National Council for Skill Development was established to upgrade 5,000 industrial training institutes.
Prime Minister Manmohan Singh, who has pledged that India will embark on a Decade of Innovation, has launched an ambitious effort to formulate a new national innovation strategy. In 2010, Prime Minister Singh established a National Innovation Council charged with formulating a roadmap for the decade ahead that is described as “the first step in creating a cross-cutting system which will provide mutually reinforcing policies, recommendations, and methodologies to implement and boost innovation performance in the country.”187
Among the Council’s early proposals are to set up setting up innovation councils both for states and for different sectors. The council also calls for programs to promote regional innovation clusters, innovation centers at
______________________
185 “Technology Vision 2020” reports for a number of sectors were prepared by the Technology Information, Forecasting and Assessment Council under the Department of Science & Technology to study and support future technology needs of national importance. Access reports at http://www.tifac.org.in/.
186 Ibid.
187 From Introduction on National Innovation Council Web site. See http://www.innovationcouncil.gov.in/index.php?option=com_content&view=article&id=26&Itemid=5.
universities, awards and competitions, outreach programs, and international collaboration.188
Focusing on Inclusive Innovation
One of the National Innovation Council’s central goals is to foster inclusive innovation189 that provides “access, affordability and quality, and fosters innovations at the grassroots.”190 The concept builds on the Indian knack for Jugaad, or the development of makeshift solutions under conditions of scarcity.191 The aim, however, is to go beyond relying on informal, makeshift solutions to everyday needs and build a more formal system of low-cost innovation that address the needs of the majority of Indians living at or near poverty. 192 As a council publication explains:
India needs more “frugal innovation” that produces more “frugal cost”’ products and services without compromising safety, efficiency, and utility of the products. These innovations should also have “frugal’ impact on the environment to be sustainable in the long term.193
The National Innovation Council has recently announced a $1 billion Inclusive Innovation Fund to create a “funding platform for solutions aimed at the Bottom of the Pyramid.” 194 The government would provide the initial capital for a “fund of funds” that would invest in other intermediate funds and institutes, which in turn would provide seed capital to grassroots innovation projects and that will raise money from companies, banks, insurance companies, and investors. The expectation is that the government contribution will be supplemented by $9 billion in private capital.
______________________
188 National Innovation Council, “India Decade of Innovations 2010-2020 Roadmap,” March 2011 (http://www.innovationcouncil.gov.in/ideas/ppt1.php#).
189For an earlier analysis of inclusive innovation in India and methods to promote it, see Anuja Utz and Carl Dahlman, “Promoting Inclusive Innovation,” World Bank, Unleashing India’s Potential, op. cit.
190 See National Innovation Council, Towards a More Inclusive and Innovative India, September 2010 (http://www.innovationcouncil.gov.in/downloads/NInC_english.pdf).
191 For a review of the accomplishments and limitations of jugaad, see Navi Radjou, Jaideep Prabhu and Simone Ahuja,, Jugaad Innovation: Think Frugal, Be Flexible, Generate Breakthrough Growth, San Francisco: Jossey-Bass, 2012. Some Indian business leaders have criticized jugaad; Anand Mahindra notes that it is “all too often used to excuse cut-price, second-rate answers to his nation’s pressing business and social problems.” See Financial Times, “More with less.” May 19, 2012.
192 See Rishikesha T. Krishnan, From Jugaad to Systematic Innovation: The Challenge for India, Indian Institute of Management, Bangalore, self-published, 2010.
193 National Innovation Council, Towards a More Inclusive and Innovative India, op. cit.
194 Indian Express, “$1 bn India Innovation Fund by July, January 17, 2012.
Developing Strategic Sectors
India also has several large initiatives to boost its global standing in strategic science and technologies areas. The government has more than tripled the budget for the Council of Scientific and Industrial Research, which oversees India’s national laboratories, in recent years. It also has announced plans to establish 50 centers of excellence in science and technology over six years. Centers will include biotechnology, bio-informatics, nano-materials, and high performance computing, and engineering and industrial design. They will offer doctorate programs and be based at existing institutions.195
India has big ambitions in nanotechnology. Under the 10 billion rupee ($220 million) National Science and Technology Nano Mission, created in 2006, three new R&D institutes are being created. Some 50 to 60 science and technology institutes also are to be involved in building nanotech clusters across the country.196
In renewable energy, the government announced it aims to quadruple power generation from a range of non-carbon sources to 72.4 gigawatts by 2022, with solar power accounting for 20 gigawatts.197 India also wants to build on its strength on space research, where it is a world leader in satellite communications, study of the environment, and remote sensing. India has sent 55 satellites into orbit since 1975. In 2009, the National Remote Sensing Center of the Department of Space launched a Web based, three-dimensional satellite imagery tool called Bhuvban in August 2009 to offer images of Indian locations superior to that provided by other Virtual Globe software like Google Earth and Wiki Mapia.198 India also has set a target of a manned space flight by 2016.
Upgrading Higher Education
Improving the quality and quantity of higher education is one of the government’s most urgent priorities. The nation’s elite science and technology schools are the nine Indian Institutes of Technology, and several strong institutes of information technology, medicine, and science. India also has 10 first-rate graduate business schools, and several Indian Institutes of Management. Seats in these schools are extremely scarce, however. While some of India’s 358 universities and more than 20,000 colleges are huge by Western standards, overall quality is poor.199 India’s National Knowledge Commission estimates the
______________________
195 Akshaya Mukul, “Govt Plans 50 Centres of Excellence for Science & Tech,” The Times of India, Jan. 17, 2011.
196 Indo-Asian News Service, “National Mission to Make India Global Nano Hub,” Nov. 5, 2007.
197 Sreejiraj Eluvangal, “Renewable Energy Goal Quadrupled,” DNA Money, Dec. 30, 2010.
198 Details on Bhuvan can be accessed on the NRSC Web site (http://bhuvan.nrsc.gov.in).
199 In his presentation in India’s Changing Innovation System, former top government official T. S. R. Subramanian said of the nation’s more than 500 engineering schools and 600 management institutes, only the IITs and Indian Institutes of Management are world class. The rest greatly need improvement.
nation needs 20 to 30 new “appropriately scaled” universities over the medium term and 1,500 new universities over the long term.200
Indian higher education also suffers from a shortage of qualified senior professors, in large part due to poor salaries. Retired IIT-Delhi director P. V. Indiresan, who founded the school’s Centre for Applied Research in Electronics and was twice awarded India’s highest prize for inventors, said in 2006 that even IIT professors earn roughly as much as an intern at a top Indian company. Partly as a result, India already suffers from acute skill shortages. A study of 25 industrial sectors by the Federation of Indian Chambers of Commerce and Industry in 2007 found there is a 25 percent shortage of skilled personnel in engineering.201
Universities also play a small role in the innovation system compared to those in other countries. They account for just 5 percent of India’s R&D and interact little with the private sector. The IITs, for example, are renowned for the extremely high caliber of their graduates, who include many of the nation’s most famous industrialists, scientists, executives, and business academics. However, the institutes have had few research ties to business, generated few startups, and produce few patents. The constraints on the IITs have included heavy bureaucratic control by the Ministry of Human Resource Development, which some commentators say makes it difficult to respond flexibly to industry needs, expand, and improve their financial base. IITs depend on the government budgets. Only recently have they been allowed to accept donations directly from alumni abroad.202
The government is mapping strategies to address all of these shortcomings. It seeks to raise the gross enrollment ratio in higher education, or the number of qualified students who attend, from 11 percent in 2007 to 21 percent in 2017. That would require 8.9 percent annual growth in college and university enrollment.
To accomplish this, the government increased the education budget increased fivefold in the 11th Five year Plan for 2007 to 2012 over the previous five-year plan. The government has established a National Skill Development Mission that hopes to use public-private partnerships to open 1,600 new information technology institutes and polytechnics, 10,000 vocational schools,
______________________
200 For an explanation of the National Knowledge Commission’s recommendations, see “FAQs on NKC Recommendations on Higher Education” of the commission’s Web site at http://www.knowledgecommission.gov.in/downloads/documents/faq_he.pdf.
201 Federation of the Indian Chamber of Commerce and Industry, “Survey of Emerging Skill Shortages in Indian Industry,” 2007 (http://www.ficcihen.com/Skill_Shortage_Survey_Final_1_.pdf).
202 From presentation by P. V. Indiresan, retired professor of Indian Institute of Technology-Delhi in India’s Changing Innovation System, op. cit.
and 50,000 skill-development centers across the country. The goal is to train 10 million new skilled workers a year.203
In terms of elite institutions, the government plans to increase the number of Indian Institutes of Technology from nine to sixteen, add five Indian Institutes of Science Education and Research, six Institutes of Management, and 20 Indian Institutes of Informational technology.
Getting universities to play a far bigger role in India’s innovation ecosystem and upgrade their standards are other top goals. The government is starting to overhaul the entire system of science and engineering education, explained former Council of Scientific Industrial Research Director General Ramesh Mashelkar.204 A committee studying reforms of IITs is expected to call for measures to grant them greater management and financial autonomy from the government and to encourage more collaboration with industry.205 The government also proposes to establish 14 new “innovation universities” that will rank among the best in the world in research.206
Yet another initiative involves building interconnections among colleges and universities and to expand their geographic reach. The Indian National Knowledge Network is a government project to build an ultra highspeed broadband network of 10 gigabits and up to connect schools and government agencies across the country. The first phase is operation with a 2.5 gigabit network connecting 96 institutions and 15 virtual classrooms. The plan calls for investing $1.35 trillion over 10 years building more than 1,500 nodes.207
Reforming National Laboratories
In a 2005 survey of top executives of Indian manufacturers, 71 percent said that the lack of collaboration between industry and research institutes was the main hurdle to innovation in India.208 India’s national laboratories now are starting to pay more attention to commercialization and linking their research to the greater needs of industry and society. The Council of Scientific Industrial Research, which controls 38 national laboratories and many research institutes, began reforms a decade ago to improve their performance and economic
______________________
203 Ministry of Labor and Employment press release, March 5, 2008 (http://pib.nic.in/release/rel_print_page1.asp?relid=36021).
204 See presentation by Ramesh Mashelkar of the Council of Scientific Industrial Research in India’s Changing Innovation System.
205 Hindustan Times, “More Autonomy, New Programmes for IITs,” Jan. 16, 2011.
206 For an explanation of innovation universities, see National Innovation Council, “Concept Note on Innovation Universities Aiming at World Class Standards,” at http://www.education.nic.in/uhe/Universitiesconceptnote.pdf.
207 Background on the National Knowledge Network can be found on the Department of Information Technology Web site at http://www.mit.gov.in/content/national-knowledge-network.
208 Confederation of Indian Industry and Boston Consulting Group, “Manufacturing Innovation: A Senior Executive Survey,” 2005.
relevance. Instead of focusing on many small projects and acting like independent entities, CSIR labs now take on larger, networked projects and collaborate more with each other, according to Dr. Mashelkar. Whereas costs had once been no consideration, now time and costs are “sacrosanct,” he said. Perfunctory monitoring has given way to stringent monitoring. Rather than being inward-looking, the labs now look outside to harness synergies.209
In 1996, CSIR became India’s first research institution to manage its own intellectual property. Each laboratory now has marketing teams, and senior staff can serve on boards of private firms. CSIR also introduced financial incentives to motivate scientists, and labs have been allowed to put earnings into reserve funds for carrying out additional research. Patents earned CSIR labs rose from low single digits to more than 200 between 1995 and 2005. Published science papers by CSIR researchers have risen sharply, as have U.S. patents award to the council.
India’s Innovative Companies
Although the share of national R&D conducted by businesses in India rose from 19 percent in 2002 to 30 percent in 2008 [See Figure 5.6], industry plays a smaller role in innovation than in many other nations. 210 In China, for example, industry performs around two-thirds of R&D.211
Nevertheless, top Indian companies have demonstrated an impressive capacity and desire to innovate in the two decades since they have been freed of the restraints of the country’s once-onerous industrial licensing system.212 Enterprise R&D leapt by seven-fold between 1991 and 2004.213 A survey of Indian companies in 2006 found that 40 percent had developed a major new product and 62 percent had upgraded an existing product lines, much higher than in China and at about the same level as in the Republic of Korea.214 In a survey of 83 top manufacturing executives, 82 percent said they believed that generating organic growth through innovation is essential for success.215
India’s elite corporations are remarkably well-integrated into global innovation networks. The country’s information-technology services industry,
______________________
209 Mashelkar, op. cit.
210 Ibid., data from Indian Central Statistics Organization.
211 Ibid., data from Indian Central Statistics Organization.
212 Under India’s Soviet-inspired planned economy from 1947 through the introduction of reforms in 1991, Indian companies were regulated by an system of licenses and permits derisively known as the License Raj that controlled what and how much companies could manufacture, prices, sources of capital, closing of factories, and firing workers.
213 Data cited in Dutz and Dahlman, op. cit.
214 Ibid.
215 Confederation of Indian Industry and Boston Consulting Group, op. cit.
216 Pete Engardio, “The Future of Outsourcing: How it’s Transforming Whole Industries and Changing the Way We Work,” BusinessWeek, Jan. 30, 2006.
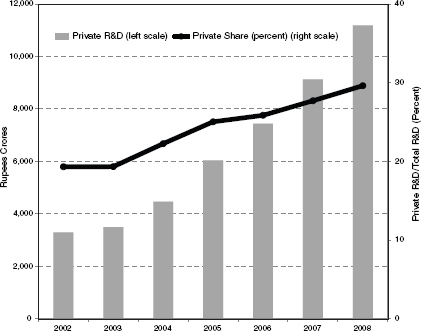
FIGURE 5.6 R&D conducted by business in India: total spending and as a share of national R&D.
SOURCE: Government of India, Ministry of Science and Technology, Research and Development Statistics 2007-2008 (May 2009), Table 1.
NOTE: Data refer to fiscal years.
for example, has played an integral role in transforming global services industries. Once primarily providers of low-cost outsourced software and callcenter services, Indian corporations such as Tata Consulting Services, Infosys, Wipro, and Genpact now help clients ranging from the world’s biggest insurance companies and banks to airlines and legal firm develop innovative business processes that boost efficiency, cut cost, and improve customer service.216 India’s biggest IT services companies directly compete with giants such as IBM, Accenture, and Hewlett Packard, who also have major operations in India. NASSCOM, India’s IT services industry association, estimates that India accounts for 34 percent of the worldwide business process outsourcing (BPO)
______________________
216 Pete Engardio, “The Future of Outsourcing: How it’s Transforming Whole Industries and Changing the Way We Work,” BusinessWeek, Jan. 30, 2006.
market.217 In 2011, annual revenues of India’s IT and business-process outsourcing industry are expected to reach $88.1 billion, with exports accounting for around $59.4 billion of that.218
India’s pharmaceutical industry, meanwhile, has become an important ally to Western companies that are under mounting financial pressure to get new drugs to market as patents expire on their most valuable products. India’s contract drug research industry is estimated to generate $1 billion in revenue a year.219 By working around the clock with Indian researchers, partners, drug makers hope to slash research time and costs, a crucial consideration given the high risk of failure in explained Eli Lilly executive Robert Armstrong.220
Glenmark Pharmaceuticals exemplifies India’s prowess in drug research. The company has licensed drug candidates to Eli Lilly and other Western pharmaceutical companies and has new biological entities in clinical testing that are potential treatments for asthma, diabetes, and rheumatoid arthritis. Drug-research firm Piramal Health Care has drug-discovery partnerships with Lilly and Merck, while Ranbaxy has a major collaboration with GSK. 221
Piramal illustrates the way in which some Indian companies are harnessing the nation’s high pool of scientists and engineers and forging strategic alliances in a bid to become global players in innovation. A leading producer of generic drugs, Piramal has expanded manufacturing in the United Kingdom, Canada, China, and the U.S., where it has three plants employing 1,000 workers. But it also has a large and growing early-stage drug-development arm that partners with multinationals. Founder Swati Piramal estimates that her company can develop a new drug for the global market for $50 million, compared to the average of $1 billion spent in the U.S. for every drug brought to market. In India, she noted, Nicholas Piramal can buy “a lot of scientific horsepower” for the money. 222
India’s automotive industry also is leveraging global partners to develop innovative products. To obtain the cutting-edge components needed for Tata Motors’ innovative $2,500 small passenger car, the Nano, its affiliate Tata Auto Component Systems (TACO) formed 16 global partnerships, including
______________________
217 NASSCOM data can be accessed at http://www.nasscom.in/bpo-0.
218 NASSCOM data can be accessed at Data can be accessed at http://www.nasscom.in/indian-itbpoindustry.
219 Data: Zinnov.
220 From presentation from Robert Armstrong of Eli Lilly & Co. in India’s Changing Innovation System, op. cit.
221 Pete Engardio and Arlene Weintraub, “Outsourcing the Drug Industry,” BusinessWeek, Sept. 4, 2008. Also see Vivek Wadwha, et al, “The Globalization of Innovation: Pharmaceuticals: Can India and China Cure the Global Pharmaceutical Market?” Duke University Pratt School and Engineering and Harvard Labor and Work Life Program, available at SSRN: http://ssrn.com/abstract=1143472.
222 From presentation by Nicholas Piramal TITLE Swati Piramal in India’s Changing Innovation System, op. cit.
alliances with Johnson Controls and Visteon. Engineers based in different nations collaborated around the clock. TACO also established four advanced engineering centers, including one in the U.S., and 16 different manufacturing plants for interior plastics, seating systems, exteriors and composites, and other components and modules. Like many Indian companies, TACO regards design as a core strength. TACO executive M. P. Chugh notes that Chinese manufacturers are better at “shoot and ship”—that is, manufacturing a product from a drawings and specifications—while Indian auto manufacturers are better able to design, test, and validate auto parts, as well as manufacture them. The business model, Mr. Chugh explained, is to “not only use the engineering talent in India, but leverage engineering talent in India for a global business market.”223
The Nano car illustrates another distinct feature of Indian-style innovation: The talent for developing business models that can deliver quality goods and services at extremely low prices. This model also is a crucial element in the government’s strategy of meeting the needs of its impoverished population, according to Kapil Sibal, formerly India’s Minister of Science and Technology and now Minister of Human Resource Development. To help deliver health care to remote villages, for example, hospitals in Delhi are setting up “medical kiosks” in clusters of villages that enable doctors in Delhi to diagnose patients using satellite technologies. The ministry pays the investment in medical hardware, while hospitals make doctors available. The innovation comes in combining high-tech and very simple technologies to improve the lives of the 500 million people living on less than $2 a day. “The object of technological development is ultimately economic growth and raising the living standard of all, not just a few,” Mr. Sibal said.224
Public-Private Innovation Partnerships
The government is increasing its incentives for research and development by the private sector. It is reportedly planning to set up an electronics development fund (EDF) to promote R&D in electronics.225 Minister of Finance Pranab Mukherjee proposed in March 2012 that India’s weighted deduction of 200% for R&D expenditures—one of the highest in the world—be extended from 2012 for another five years226. The government also trying to bring Indian companies into public-private partnerships aimed at developing new products and tackling national technology needs. The New Millennium Indian Technology Leadership Initiative, funded by the government, involves 60
______________________
223 From presentation by M. P. Chugh of Tata Auto Component Systems in India’s Changing Innovation System, op. cit.
224 From presentation by Kapil Sibal, then of the Ministry of Science and Technology, ibid.
225 “Electronics Development Fund to Promote innovation Soon—Official,” Indo-Asian News Source (February 21, 2011).
226 “Union Budget 2012: Full Text of Pranab Mukherjee’s Speech,” IBN Live (March 16, 2012).
largely networked projects in areas such as agriculture, biotechnology, bioinformatics, pharmaceuticals, materials, information technology, and energy. The initiative involves as least 85 industry partners and 280 R&D programs with 1,750 researchers and has generated cumulative investment of more than $100 million. The program provides small grants to high-risk, low-investment technology projects of research institutions in which India has potential to be a global leader. Projects run by companies can get soft loans at 3 percent interest if Indians or non-resident Indians control them. Projects majority-owned by foreigners get loans at 5 percent interest if they manufacture in India.227
New Millennium projects so far have secured 100 international patents and published 150 articles in journals. Products include a system for viewing 3D images of complex bio-processes, a low-cost embedded computing platform that can replace conventional personal computers for day-to-day office work, an herbal oral psoriasis treatment that is in clinical testing, and an Internet Protocol service that allows users to get television, Internet, and telephone service over telephone lines.228 The budget for New Millennium projects recently was expanded to $157 million over five years. The program also now includes projects in which industry shares half of costs, that are co-financed with venture capital funds, or that establish innovation centers. Loans can be converted in equity, and foreign companies have greater ability to participate.229
Multinationals R&D Centers
The some 300 R&D centers operated by multinationals in India are another powerful force connecting India to global innovation flows. In most emerging markets, multinationals set up research and product-development operations mainly to serve the needs of the local market. In India, however, foreign companies have tended to hire top engineering and design talent to help develop products sold around the world. According to one survey, the biggest reason multinationals invest in China is to access new consumer markets and to tap low-cost labor. In India, foreign companies cited new outsourcing opportunities and access to highly skilled labor as the biggest reason they invest there.230
______________________
227 Council of Scientific and Industrial Research, “New Millennium Indian Technology Initiative,” (http://www.csir.res.in/external/heads/collaborations/Nmitili/NMITLI%20Information%20in%20brief.pdf).
228 Examples are featured in the brochure Council of Scientific and Industrial Research, “New Millennium Indian Technology Leadership Institute: A Public Private Partnership R&D Programme for Technology Development,” which can be accessed at http://www.csir.res.in/external/heads/collaborations/Nmitili/NMITLI%20Brochure%20and%20selected%20achievements.pdf.
229 Department of Science & Technology press release, “New Millennium Indian Technology Leadership Initiative Scheme,” Feb. 27, 2009. This release can be accessed at http://www.dst.gov.in/whats_new/press-release09/new-millennium-scheme.htm.
230 UNCTAD, World Investment Report 2005, United Nations.
General Electric is one multinational that has made Indian talent integral to its global innovation activities. GE’s $80 million John F. Welch Technology Center employs 2,500 scientists and engineers. More than 60 percent have advanced degrees and 20 percent with global experience. The 50 acre campus includes state-of-the-art labs for mechanical engineering, electronics, chemical, metallurgy, polymer sciences, new materials, and computer simulation working for GE divisions in everything from health care and energy to aviation and consumer appliances. In its first five years, the center earned 44 patents. They include breakthroughs in computer-tomography, magnetic resonance products, high-performance plastics for automobiles, and next-generation sensors.231
Google has set up R&D centers in Bangalore and Hyderabad and regards those operations as on par with those at its headquarters in Mountain View, California, according to Google executive Ram Shriram. Google Finance, which was launched globally, was developed by two researchers in Bangalore.232 IBM, which employs more than 100,000 in India233 and has a 100 researcher team IBM Research Laboratory in Delhi, is investing $6 billion to expand its operations.
One topic of growing debate in India, however, is whether the heavy multinational R&D presence is a benefit or a hindrance to the development of a strong national innovation system234. Growing competition for top technical talent in India has given rise to concerns that foreign companies are hoarding too much of the nation’s most valuable brainpower even though much of the multinational R&D work is oriented toward products sold globally. Some studies suggest, however, that the spillovers will have a positive long-term impact as seasoned engineers leave foreign companies and join domestic ones.235
Seeking Global Partnerships
India’s national research organizations also are becoming more important global partners. They have joined international mega-science initiatives such as the Large Hadron Collider at the European Organization for
______________________
231 From presentation by Kenneth Herd of General Electric, ibid.
232 From presentation by Ram Sriram of Google, ibid.
233 Data from Mini Joseph Tejaswi and Sujit John, “IBM is India’s second largest pvt sector employer,” Times of India, Aug. 18, 2010.
234 For a discussion of the spillover effects of multinational companies R&D centers in India, see R.A. Mashelkar, Technology in Society, April, 008, Vol, 30/3-4, Pp 299-308 (Annexure 3); Technonationalism to Technoglobalism by R.A. Mashelker, Journal of India & Global Affairs, 2009, 90-97. (Annexure 4).
235 For a discussion of how multinational R&D centers may impact India’s domestic innovation ecosystem, see N. Mrinalini and Sandhya Wakdikar, “Foreign R&D Centres in India: Is There any Positive Impact?”, Current Science, Vol. 94, No. 4, Feb. 25, 2008 (http://www.ias.ac.in/currsci/feb252008/452.pdf).
Nuclear Research, for example, and the International Thermonuclear Experimental Reactor. India has also entered collaborations in agricultural research with the U.S., Brazil, Japan, and South Korea.
India has become a closer partner with the United States in recent years. A 2005 bilateral agreement called for greater cooperation in civilian uses of nuclear, space, and dual-use technology.236 The two nations also concluded a 10-year framework agreement for defense. The U.S. and India established a new joint science and technology endowment fund to facilitate research collaborations for industrial applications. A $100 million U.S.-India Knowledge Initiative focuses on raising agricultural productivity and increasing agroindustrial business. The U.S. and India also have launched a bilateral dialogue seeking cooperation in oil, gas, nuclear, clean-coal, and renewable energy sources and began discussing cooperation in civilian use of space.
The Challenges Ahead
The government’s growing commitments to boost investment research, upgrade higher education, reform its research institutions, and invest in programs and infrastructure to spread the benefits of innovation to the greater population all portend well for India’s future as new science and technology power. What remains to be seen is whether the government mobilize and coordinate central and state agencies, universities, and the private sector to execute its ambitious agenda.237
An appraisal by the European Commission expressed some skepticism. “(T)he problem is that these innovation policies are rather fragmented among ministries and elite bodies such as the Planning Commission and Prime Minister’s Office” and that they “lack coordination and networking.” As a result, there is considerable duplication. The report also questioned whether the many discrete programs in areas like telecommunications, information, and pharmaceuticals fit into an overarching framework. “India has not yet articulated a formal national innovation policy as such,” the report said.238
Another critical issue is political sustainability. If India’s booming economy and thriving technology sector do not deliver tangible results for the greater population, political support for expensive science-and-technology programs and universities that seem to benefit the well-off could diminish. Greater participation by India’s private sector, both in the form of higher R&D spending and willingness to join public-private partnerships and national programs, also is essential.
______________________
236 Presentation by Indian Ambassador to the U.S. Ronen Sen in India’s Changing Innovation System.
237 Fir a insightful review of challenges, see R.A. Mashelkar `Reinventing India’, Pune: Sahyadri Publications, 2012.
238 European Commission Enterprise Directorate-General, op. cit.
As evidenced by recent policies and the growing focus on “inclusive innovation,” the government of Prime Minister Singh is well cognizant of these challenges and determined to address them. If such efforts succeed, India appeared destined to be a 21st century innovation powerhouse.
NEWLY INDUSTRIALIZED ECONOMIES
Taiwan’s rise from poverty in the 1950s to one of the world’s premier high-tech powers has made it a role model of how to use science and technology policy for rapid economic development. Since the 1970s, the government has executed a systematic strategy to absorb advanced technologies from the West and Japan, develop globally competitive products and manufacturing processes, and then transfer the know-how to private companies to create world-class industries. These efforts quickly transformed Taiwan’s economy. In 1981, food and textile industries accounted for 40 percent of Taiwan’s manufacturing sector, with electronics accounting for less than 15 percent. By 2004, electronics was 35 percent of the island’s manufacturing economy, with food and textiles accounting for less than 10 percent. Meanwhile, per-capita income in Taiwan rose from less than $500 in the early 1950s to $18,558 in 2010.239
Taiwan’s standings in the areas of technology, advanced manufacturing, and knowledge-based industries have risen just as dramatically. Taiwan is the world’s leading producer of mask ROMs and optical discs and the world’s largest integrated circuit foundry producer and largest packager of integrated circuits.240 Taiwan is the second-largest producer of large highdefinition LCD panels, IC design services and crystalline silicon solar cells.241 Taiwanese industry is making impressive progress in next-generation industries such as solid-state lighting, thin-film electronics, photovoltaic cells, and biomedical devices using nano-scale materials. The portion of GDP devoted to research and development has risen more than fivefold since the late 1980s, and reached 2.9 percent of GDP in 2009. [See Figure 5.7] Taiwanese companies,
______________________
239 International Monetary Fund, World Economic Outlook Database, September 2011.
240 Republic of China, Council for Economic Planning and Development, Taiwan Statistical Data Book 2011, July 2011, Table 4-b2.
241 Id. Taiwanese companies are the world’s largest producers of notebook PCs, motherboards, personal navigation devices and LCD monitors, but significant production of products occurs offshore, principally in China. Id., Table 4-b1. See also Xing Yuqing, “China’s High-Tech Exports: Myth and Reality,” EAI Background Brief No. 506, February 25, 2010. “Taiwanese-owned IT companies played a very important role in nurturing the high-tech industries in mainland China. By 2007, they had relocated almost 100% of their production capacities in laptop PC, digital camera, motherboard and LCD monitor for PC into mainland China.”
once low spenders on R&D, contributed more than 69.7 percent of total spending on research in Taiwan.242
The island is beginning to excel in innovation as well. Taiwan is among the world leaders in U.S. utility and design patents.243 Indeed, Taiwan generates more patents per 1 million citizens than any other region or nation.244 Taiwan also has been winning international innovation awards. National research institutes had three winning entries in R&D Magazine’s 2010 R&D top 100 Awards, for example. One was for FlexUPD, billed as the first technology to enable the commercialization of paper-thin, low-cost, flexible flat-display panels for electronic products. Taiwan also won awards for a display technology that allows both 2D and 3D information to be viewed simultaneously with the naked eye and for the first non-toxic, fire-resistant composite technology.245
What’s more, Taiwan’s science and technology investments have enabled the economy to meet one of its most crucial strategic challenges: remaining a globally relevant sector in the wake of a rising China. Its giant neighbor has lower costs, vastly more engineers and scientists, and aggressive policies targeting all of the same industries as Taiwan. Despite a massive shift of factory work to the mainland, the value of Taiwanese exports continues to rise. Taiwan had record exports in 2010 of $275 billion, with 42 percent going to China, up from 24 percent in 2000.246
Taiwan is reaping the benefits of heavy investments in education and decades of comprehensive science and technology policies aimed at building globally competitive industries. The island of 23 million also has expertly leveraged its strategic geographic location off the coast of China. Estimates of Taiwanese investment in mainland China, including those made through third parties, range from $150 billion to $300 billion.247 Taiwanese companies control and manage much of the electronics export sector.248 Taiwan has positioned itself as a global engineering and innovation hub bridging East and West.
______________________
242 Id., Table 6-4.
243 National Applied Research Laboratories, Yearbook of Science and Technology Taiwan ROC 2010, May 2011, Table 1-2-4. Taiwan was the 5th in 2009 with respect to both total patents and utility patents.
244 According to U.S. Patent and Trademark Office data, Taiwan is No. 5 in U.S. utility patents and the third-biggest recipient of U.S. design patents.
245 R & D Magazine “R&D 2010 Winners,” July 7, 2010 (http://www.rdmag.com/Awards/RD-100Awards/2010/07/R-D-100-2010-Winners-Overview/).
246 Executive Yuan, R.O.C. (Taiwan), Council for Economic Planning and Development, Taiwan Statistical Data Book 2011, July 2011, Table 11-9a.
247 U.S. Department of State, “Background Note: Taiwan,” Bureau of East Asian and Pacific Affairs, July 7, 2011.
248 For instance, Taiwan-owned Foxconn Technology Group, the world’s biggest electronics manufacturer, reportedly employed more than 1 million workers in China as of 2010 and plans to increase that workforce to 1.3 million. Frederik Balfour, “IPad Assembler Foxconn Says it Has More Than 1 Million Employees in China,” Bloomberg, Dec. 10, 2010.
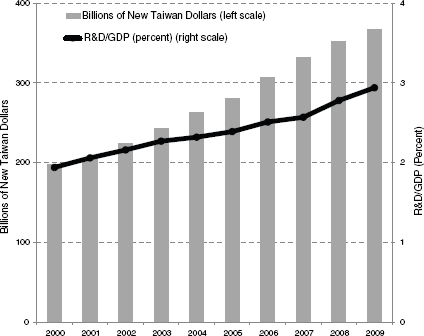
FIGURE 5.7 Taiwan’s R&D expenditures increased to 2.94 percent of GDP in 2009.
SOURCE: Executive Yuan, R.O.C. (Taiwan), Council for Economic Planning and Development, Taiwan Statistical Data Book 2011, July 2011, Table 6-1.
Fifty-one multinationals have Taiwanese research centers, including Hewlett Packard, Dell, Sony, DuPont, IBM, Fujitsu, Intel, and Dow.249
Government planners believe Taiwan needs new economic engines, however, to continue to prosper in a global knowledge economy and amid growing competition from large emerging markets. “Innovation is unquestionably the key to Taiwan’s sustained economic growth,” states the National Science and Technology Development Plan for 2009 through 2012. To achieve this, “it will be necessary to rethink the country’s focus on scientific research, lengthen R&D chains, and strengthen the conversion of R&D results
______________________
249Ministry of Economic Affairs, “Multinational Innovative R&D Center in Taiwan,” updated Oct. 5, 2011. Access at http://investtaiwan.nat.gov.tw/matter/show_eng.jsp?ID=433.
into innovative technologies and industrial capabilities.” 250 Among other measures, the plan calls for shifting the R&D focus more toward “pioneering” research, strengthening currently weak ties between universities and private industry, building better links between basic research and downstream applications, and reforming Taiwan’s education system to encourage more critical thinking and interdisciplinary studies. This will likely mean an attempt to increase spending on basic R&D, which was 10.4 percent of total R&D spending in 2009.251 [See Figure 5.8]
Chu Hsih-sen of Taiwan’s Industrial Technology Research Institute (ITRI) described the goals this way: Taiwan must move from a focus on optimizing existing technologies to exploration, to move from working within single disciplines to integrating multiple disciplines, and to move from developing components to entire systems and comprehensive services. Taiwan also is stressing greater collaboration among its research organizations and industrial and academic partners around the world.252
The Taiwan Method
The express purpose of Taiwanese government science and technology policies has always been to establish and sustain domestic industries. The island started in electronics manufacturing with duty-free export zones in the 1960s, when Taiwanese wages were extremely low. In the 1970s, it began investing heavily in industrial technology institutes to stimulate more sophisticated indigenous industries. Ninety-two percent of R&D was devoted to manufacturing as of 2006,compared to 65 percent in the United States and 83 percent in South Korea. Of that, 69 percent was devoted to high-tech manufacturing.253
The key elements of the Taiwan method have been to carefully identify industries where the island can make its mark. Rather than attempt to invent new technologies from scratch, Dr. Chu explained, Taiwan’s strategy has been to focus on technologies that multinationals already possess and that Taiwanese companies want to apply. Then the government develops the necessary skills base, builds or upgrades common laboratory facilities, and systematically acquires the needed technologies through a combination of licensing, in-house R&D, and partnerships with foreign companies and universities.
______________________
250 National Science Council Executive Yuan, “National Science and Technology Development Plan (2009-12), passed July 2, 2009 (http://web1.nsc.gov.tw/public/Attachment/91214167571.PDF)
251 Id., p. 66. “Promotion of forward-looking, outstanding, interdisciplinary basic research in science and environmental science, biology, and engineering, etc.”
252 From presentation by Chu Hsin-Sen of Industrial Research and Technology Institute in National Research Council, Innovation Policies for the 21st Century: Report of a Symposium, Charles W. Wessner, editor, Washington, DC: The National Academies Press, 2007.
253 From presentation by Chen Choa-Yih, director general of Industrial Development Bureau of Taiwan’s Ministry of Economic Affairs, Jan. 5, 2006, symposium 21st Century Innovation Systems for the United States and Taiwan: Lessons from a Decade of Change.”
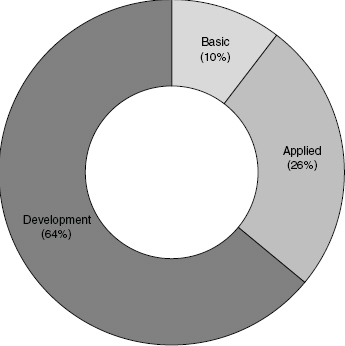
FIGURE 5.8 Taiwan R&D expenditure by type in 2009.
SOURCE: Executive Yuan, R.O.C. (Taiwan), Council for Economic Planning and Development, Taiwan Statistical Data Book 2011, Table 6-6.
Working closely with domestic companies, well-staffed industrial research institutes then turn those technologies into prototypes and production processes that are disseminated widely through industry.254 “Taiwan’s miracle is based on government-promoted industries and private domestic firms,” observes Massachusetts Institute of Technology political economist Alice Amsden. 255
To help manufacturing industries take root, government agencies also offer generous assistance, including research grants, early-stage capital, incubators, tax breaks, low-cost access to laboratories and production facilities at world-class science parks, and efforts to build local supply bases of key materials and components. Among other industries, this method has succeeded
______________________
254 Chu, op. cit.
255 From Alice H. Amsden, “Taiwan’s Innovation System: A Review of Presentations and Related Articles and Books,” submitted for NAS Jan. 4-6 symposium “21st Century Innovation Systems for the U.S. and Taiwan: Lessons From a Decade of Change,” Taipei.
with notebook computers, liquid-crystal displays, semiconductor fabrication and design, and bicycles made of carbon composites, an industry Taiwan dominates. The Taiwan government is applying this strategy to a range of new industries, including logistical services.
The National Science Council of the Executive Yuan is the top agency promoting science and technology, receiving 35 percent of the government’s $2.9 billion 2008 R&D budget. It funds university research and overseas a network of 11 national laboratories established since 2003. Each lab specializes in developing core technologies with “high societal impact or industrial competitiveness,” such as nano-devices, high-performance computing, earthquake simulation, chip implementation, and animal research. Accomplishments include development of biomedical sensor chips, medical visualization products, and what is advertised as the world’s first 16 nanometer, single-cell static random-access-memory device. The chip is said to be capable of holding 15 billion transistors that can process 10 times more data than current 45 nm technology and radically reducing the size of circuit boards.256
The National Science Council operates a precision instrument development center and a synchrotron radiation center similar to the Max Planck Center in Europe. The National Science Council also operates Taiwan’s highly successful and widely imitated Hsinchu Science Park, established in 1980, and several others in southern Taiwan. The park serves as a source of technology development and training for industries like semiconductors, displays, and renewable-energy technologies. Academia Sinica, which conducts research in physical sciences, mathematics, and life sciences, receives around 9 percent of the Executive Yuan’s R&D budget.
ITRI’s Complex Mission
The backbone of Taiwan’s strategy has been its industrial research institutes. ITRI is by far the biggest. Established in 1973, ITRI has grown to a network of 13 research centers that focus on information and communications, advanced manufacturing, biomedical, nanotechnology and new materials, and energy and environmental technologies. More than 60 percent of ITRI’s 6,000 employees hold master’s or doctorate degrees. ITRI consults with more than 30,000 domestic companies each year. It has helped create 165 start-ups and spinoffs, and generated more than 10,000 patents.257
More than 20,000 ITRI alumni work in Taiwan’s private sector, around 5,000 of them holding senior executive positions Hsinchu Science Park.258 According to ITRI official Barry Lo, the institute deliberately seeks an annual
______________________
256 National Applied Research Laboratories 2009 annual report.
257 ITRI, “What is ITRI?” accessed at http://www.itri.org.tw/eng/about/article.asp?RootNodeId=010&NodeId=0101.
258 ITRI data.
attrition rate of around 15 percent, or about 900 researchers a year, so that they circulate through industry. “If people want to work in a laboratory for life, you don’t have the energy to help industry,” Lo explained.259 In addition, ITRI operates a training college that has 3,000 to 5,000 students attended programs lasting one month to one year and an Open Lab that houses some 60 outside companies working on collaborative R&D projects.
ITRI’s stated mission is three-fold: to “create economic value through innovative technology and R&D,” to “spearhead development of high-value industry in Taiwan,” and to enhance the global competitiveness of Taiwanese industry. That gives ITRI a much more complex role, than comparable U.S. agencies, notes Dr. Amsden. “ITRI is not only charged with raising the technological level of Taiwan, but also with increasing the level of its productive capabilities. ITRI has many more tentacles because it has many more jobs to do that are related to industrial diversification and firm formation.”260
The institute’s first big success was launching Taiwan’s semiconductor industry. ITRI acquired RCA’s technology for 7-micron chips in 1976. Three years later, an experimental lab run by ITRI’s Electronics Research and Service Organization (ERSO) was spun off as UMC. Eight years later, ITRI spawned what would become Taiwan Semiconductor Manufacturing Corp., today the world’s dominant chip “foundry,” which fabricates devices on silicon on a contract basis. Today, TSMC and UMC control some 70 percent of the global chip foundry industry. ERSO also spun off Taiwan Mask Corp., a provider of masking services. ITRI and ERSO also helped launch many of Taiwan’s integrated-circuit design companies firms that sprang up around the foundries.
ITRI also was pivotal to the development of Taiwan’s personal computer industry. From 1979 through 1991, ERSO began sending teams of engineers to Wang Computer for ten-month training courses in hardware and software design. These engineers helped diffuse the knowhow widely, and helped Acer develop Taiwan’s first 16-bit, IBM-compatible computer. Private companies also used ERSO labs to test machines before exporting them, as well as to develop Ethernet, workstations, monitors, and file-management software. The institute transferred some of the first technology that led to the eventual development of Taiwan’s liquid-crystal display industry, where companies such as Chi Mei and Au Optoelectronics now are among the world leaders.261
The Hsinchu Science Park was another important catalyst for Taiwan because it gave new companies access to first-rate facilities at a low cost. To get into Hsinchu, companies had to meet tough criteria. They had to have the ability to design products for manufacturing according to a business plan, devote a
______________________
259 Interview with Barry Lo of ITRI.
260 Amsden, op. cit.
261 Ibid.
certain share of resources to high-level R&D, and employ a significant marketing staff within three years. This process enabled the government to “cherry pick” Hsinchu tenants, according to Dr. Amsden. Once admitted to Hsinchu, companies received a full set of subsidies, such as exemption from taxes and import duties, grants, low-cost credit, below-market factory rent, access to government research facilities, good housing, and even bilingual education for expatriates’ children.262
The government still invests alongside promising companies at the R&D stage. Typically, the government pays for 25 percent of research, explained Mr. Chu. The private company invests half, and the rest comes from government or bank loan.263 When a company is profitable, it then repays the government’s investment.
Dr. Amsden said that government subsidies to companies enjoyed a high rate of success largely because they were tied to “concrete, measurable, and monitorable performance standards.” Committees of experts from industry, government, and academia selected winners of government grants. Intellectual property was shared equally with the Ministry of Economic Affairs. Companies had first right of refusal if the ministry wanted to divest. If a company failed to produce a developed product after three years, it not only lost its intellectual property but also had to repay government investments in installments.
Emerging Industries
Now much of ITRI’s budget goes toward programs that aim to establish Taiwan in a range of emerging industries. The Taiwanese government is investing $1 billion into clean energy over three years. ITRI priorities include thin-film photovoltaic cells, lighting devices using light-emitting diodes (LEDs), hydrogen fuel cells, offshore wind-power generation, and energy-efficient vehicles. ITRI also is developing flexible electronics products, a service platform for smart living technologies, and cloud computing.
ITRI achieved a major advance by acquiring key technology from Eastman Kodak, the inventor of organic LED (OLED) technology, which the U.S. company was unable to turn into commercially viable products. Among other things, ITRI engineers have used this technology to produce its innovative FlexUPD display. These paper-thin displays, which are “light, malleable, and unbreakable,” can be used for rollable mobile phone screens, E-books, e-maps and medical sensors that can be worn or wrapped around the body, according to ITRI. The institute also has developed paper-thin speakers.264 ITRI is disseminating the technology to domestic opto-electronics manufacturers.
______________________
262 Ibid.
263 Chu presentation, op. cit.
264 ITRI Web site.
ITRI is leading a similar effort in LED lighting, where it has organized an alliance of 20 Taiwanese manufacturers. The companies are developing LED products and materials for street lighting. The goal is to establish a “vertically functioning” LED industrial chain within Taiwan. 265 The institute also has an open laboratory to make 8-inch wafers for microelectromechanical systems (MEMS). ITRI engineers help companies design, test, package, and manufacture MEMS components such as biomedical devices. Other next-generation ITRI R&D programs include technology for wireless multimedia systems on a chip, wireless sensor networks, and wireless broadband.
An example of ITRI’s cultural shift toward more creative, knowledgebased industries is the Creativity Lab, which is developing technology concepts for new consumer lifestyles. Launched in 2005 and based in Hsinchu, the program is a collaboration with the MIT Media lab and has hired staff with psychology degrees and from the arts and media.266
ITRI also is playing a role in the government’s $1.8 billion program to improve the island’s information and communications infrastructure. The initiative seeks to raise industry competitiveness, improve government efficiency, improve quality of life, and increase the number of broadband users to 6 million.267
Taiwan’s Innovation Challenges
Many of these new programs reflect initiatives adopted by Taiwanese economic planners to shift toward more knowledge-based industries268 and to address perceived shortcomings in the island’s innovation ecosystem. The National Science Council challenges were enunciated in the 2009-2012 plan.
One flaw in Taiwan’s innovation system cited by the Council is weak technology-transfer and commercialization efforts by universities. Smallbusiness incubators and entrepreneurial training are relatively new in Taiwanese universities. As a result, universities launch few start-ups. The Council also faults the Taiwanese teaching system. Because students must focus on either liberal arts or science and technology at an early age, many do not get broad interdisciplinary education. Engineering courses, meanwhile, are criticized for not training students to think creatively. As a result, the plan states, “the education system does not provide students with the knowledge, skills, and
______________________
265 ITRI Web site.
266 Bruce Einhorn, “A Creativity Lab for Taiwan,” BusinessWeek, May 16, 2005.
267 For details on the e-Taiwan program, see http://www.etaiwan.nat.gov.tw/content/application/etaiwan/egenerala/guest-cntbrowse.php?cnt_id=779).
268 Taiwan has identified six emerging industries to help develop an optimal industrial structure. These are green energy, biotechnology, tourism, medical care, cultural creativity and quality agriculture. National Applied Research Laboratories, Yearbook of Science and Technology Taiwan ROC 2010, May 2011, “Report I: Six Emerging Industries – Recreating Prosperity.”
attitudes that they will need to confront and deal with the problems of a fastchanging society.”269
The plan calls for making universities more business-friendly and more open to outside collaboration. Among the recommended measures are establishment of more incubators, better incentives for academics to commercialize research, expanded entrepreneurial training, programs to “broaden students’ knowledge of practical innovation design skills,” and curricula that promote interdisciplinary knowledge.270 To secure sufficient manpower, Taiwan should recruit more talent from abroad, especially from mainland China, the plan says. The document also calls for universities to establish stronger links with science parks and national laboratories. The Ministry of Education plans to invest $1.7 billion over five years in first-rate universities. The goal is that at least one will be rank among the top 100 in the world and among the top 10 in the Asia-Pacific.
Another perceived flaw in Taiwan’s innovation system is that researchers at public institutes are treated as civil servants and therefore may not work for private companies. Since such a large share of Taiwanese R&D is conducted at Academia Sinica, national laboratories, and industrial research institutes, the Council regards such rules are major obstacles to commercialization and recommends that they be eased.
The fundamental approach to R&D by government and industry almost must change, the Council said. “It will not be enough to merely improve technologies and raise efficiency, as has been done over the past few decades,” the plan states. Instead, R&D should focus on “pioneering technology,” and policy should be “shaped by demand pull and vision of Taiwan’s future.”
Opportunities to Collaborate
International collaboration is likely to become a more important aspect of Taiwanese innovation strategy. ITRI already has extensive overseas ties. In addition to the relationship with the Media Lab, ITRI works with MIT’s artificial intelligence lab. ITRI has joint research programs with the University of California at Berkeley in nanotechnology and clean energy, five labs at Carnegie Mellon University, and a strong relationship with Stanford Research Institute. Among its many other collaborations are projects with Japan’s RIKEN, the University of Tokyo, the Netherlands’ Organization for Applied Scientific Research, Russia’s Ioffe Physical-Technical Institute, and Australia’s Commonwealth Scientific and Industrial Research Organization. ITRI’s long list of multinational partners includes Corning, Broadcom, Sun Microsystems, Hewlett Packard, Bayer, BASF, ARM, GSK, and Nokia.
______________________
269 National Science and Technology Development Plan 2009-2012, op. cit.
270 Ibid.
The National Science Council calls for expanding Taiwanese collaborations with international research institutes and industry consortia. It also recommends attracting more multinationals to use the island as a global innovation base.
Science and technology policy has been central to Singapore’s emergence as one of the world’s wealthiest nations. Since separating from Malaysia in 1965, per-capita income has soared from a mere $512 to $42,653 in 2009.271 Like Taiwan, Singapore’s takeoff was fueled first by labor-intensive manufacturing in the 1960s. Singapore then thrived as an Asian hub for trade, services, manufacturing, and corporate product development. Now the island of 5.1 million aspires to become one of the world’s premier innovation zones for 21st century knowledge industries. As the government’s science and technology plan for 2006-2010 stated, “The critical success factor for Singapore will be its ability to become an international talent node—nurturing its own talent as well as drawing creative and talented people from all corners of the world to live and work in Singapore.”272
Singapore is making impressive progress. The nation’s heavy investments in higher education and R&D infrastructure and ability to execute visionary and comprehensive innovation policies has enabled the country to reinvent itself as a magnet for multinational research labs and top-notch international talent in fields such as genomics, infectious diseases, advanced materials, and information technology. R&D manpower more than doubled between 1998 and 2009 to 41,388, research organizations increased from 604 to 854, and total R&D spending more than doubled to S$6.04 billion, despite contracting by 15 percent from 2008 levels because of a sharp decline in private sector R&D as a result of the global recession.273 [See Figure 5.9]
Singapore ranks No. 2 worldwide in global competitiveness, according to the World Economic Forum.274 Singapore’s innovation system is built upon a strong foundation in education. The share of university graduates in the population leapt from 4.5 percent in 1990 to 23 percent in 2010,275 and the
______________________
271 International Monetary Fund data.
272 Ministry of Trade and Industry, Sustaining Innovation-Driven Growth, Science, and Technology, Government of Singapore, February 2006. (http://app.mti.gov.sg/data/pages/885/doc/S&T%20Plan%202010%20Report%20(Final%20as%20of%2010%20Mar%2006).pdf).
273 Department of Statistics, Ministry of Trade & Industry, Republic of Singapore, Yearbook of Statistics Singapore 2010, July 2010 and Agency for Science, Technology and Research Singapore, National Survey of R&D in Singapore 2009, December 2010.
274 World Economic Forum, The Global Competitiveness Report 2011-2012, op. cit.
275 Singapore Department of Statistics, Census of Population 2010.
FIGURE 5.9 Singapore R&D expenditures declined in 2009 on a sharp drop in business R&D intensity.
SOURCE: Agency for Science, Technology and Research Singapore, National Survey of R&D Singapore 2009, December 2010.
portion of the resident workers with degrees jumped from 14.6 percent to 27.8 percent between 1999 and June 2010.276 More than 153,000 students were studying at the nation’s universities and polytechnics as of 2009. 277 Singapore grade-schoolers perennially rank at or near the top in math and science scores.278 The government’s strong commitment to science and technology encourages students to pursue those fields, and the highly skilled workforce in turn enables Singapore to frequently transform itself, explained Yena Lim of the Singapore Agency for Science, Technology, and Research.279
______________________
276 Ministry of Manpower, Report on Labour Force in Singapore 2010.
277 Yearbook of Statistics Singapore 2010.
278 Source: Trends in International Mathematics and Science Study (TIMMS).
279 From presentation by Yena Lim of Singapore Agency for Science, Technology, and Research in National Research Council, Understanding Research, Science, and Technology Parks, op. cit.
In terms of international patents, start-ups, and the dynamism of domestic companies, Singapore is still far from an innovation powerhouse.280 The government has charted an ambitious agency to push its innovation system to a higher level. In 2004, the Ministerial Committee on Research and Development was formed to review the nation’s R&D strategies and direction and compare them with those of other nations. The panel concluded that Singapore needed to “refocus its research and innovation agenda to keep up with international developments.” Singapore’s position as an open innovation zone also is connected to its national defense strategy as a small country surrounded by large Southeast Asians with which it sometimes has been at odds. Singapore’s strategy “is based on establishing itself as a valuable partner in the information age and on making an attack on its territory prohibitively expensive for potential enemies,” according to a National Academies assessment.281 To attract multinational manufacturing and R&D centers in targeted industries, Singapore offers incentives such as 10-year tax holidays, fast one-stop shop regulatory approvals, and subsidized vocational training.
To transform Singapore into an in “innovation-driven economy,” the panel recommended the government boost R&D resources, select areas of national importance on which to focus, increase private R&D, and strengthen linkages between universities and business. It also recommended that “investigator-led research” be balanced with “mission-led research.”282
A New Strategy
The government unveiled a new strategy in 2006. The Ministry of Trade and Industry announced $10 billion in R&D spending over five years, triple the level of the previous five-year plan. It set a target of raising national R&D spending to 3.5 percent of GDP by 2015. The plan gave special focus to life sciences, environmental and water technologies, and interactive and digital media, sectors where jobs in a “whole spectrum of research capacities” are expected to double to 80,000 and value-added to triple to $27 billion by 2015. The plan also declared Singapore must become “a global talent hub, attracting talent here by providing a vibrant environment and an open society that offer opportunities for communities of creative and talented people.”283
______________________
280 Fewer than 500 U.S. patents originated in Singapore in 2009, according to U.S. Patent and Trademark Office, not a major improvement over the previous five years, and compared to nearly 7,800 from Taiwan. The WEF’s Global Competitiveness Report recommended that Singapore take measure to improve the “sophistication” of domestic companies.
281 National Research Council, S&T Strategies of Six Countries: Implications for the United States, Committee on Global Science and Technology Strategies and Their Effect on U.S. National Security, Washington, DC: The National Academies Press, 2010.
282 Sustaining Innovation-Driven Growth, Science, and Technology, op. cit.
283 Ibid.
To lead the national drive, Singapore set up a high-level Research, Innovation and Enterprise Council. Prime Minister Lee Hsien Loong chairs the council, which also includes several cabinet ministers and international science and technology experts such as Stanford University President John Hennessy, Harvard Business School professor Clayton M. Christensen, Novartis International corporate research head Paul Herrling, and DuPont Chief Innovation Officer Thomas M. Connelly Jr. The council oversees the $3.9 billion five-year budget of the National Research Foundation, which funds and coordinates research within the national framework.
The Search for Talent
The Agency for Science, Technology, and Research (A*STAR) leads many of the programs aimed at making Singapore a global R&D base. A*STAR spearheads efforts to develop clusters in high value-added manufacturing, such as microelectronics, new materials, chemicals, and information and communications equipment, and the rapidly growing biomedical sector.284 The agency also manages Singapore’s ambitious new multibillion-dollar science parks, Biopolis and Fusionopolis, which combine a high concentration of public and corporate research organizations in a contemporary urban setting.
A*STAR also leads Singapore’s aggressive efforts to recruit top international scientists and to develop homegrown talent. Its policy is described as “pro-foreign and pro-local.” It runs a Graduate Academy that aims to train 1,000 Singaporean science and engineering Ph. Ds. The list of star foreign scientists recruited to Singapore’s well-funded research labs is impressive. To cite a few examples: Former National Cancer Institute clinical research director Edison Liu now is executive director of the Genome Institute of Singapore. Sir David Lane, discoverer of the p53 gene, is executive director of the Institute of Molecular and Cell Biology. Nobel laureate Sydney Bremmer of the Salk Institute chairs Singapore’s Biomedical Research Council and leads the Genetic Medicine Laboratory. Leading cancer geneticists Neal Copeland and Nancy Jenkins left the National Cancer Institute to lead a research team using the mouse genome to study human diseases. MIT professor Jackie Ying is executive director of Singapore’s Institute of Bioengineering and Nanotechnology, while University of Texas at Austin professor Dim-Lee Kwong is executive director of the Institute of Microelectronics.
Singapore also is upgrading higher education to meet the demands of a 21st century knowledge economy. While schools such as the National University of Singapore and Nanyang Technological University are strong in science and technology, the government wants them to become world-class research institutions and to become fonts of entrepreneurialism. The government also
______________________
284 S. Chaturvedi, “Evolving a National System of Biotechnology Innovation, Some Evidence from Singapore,” Science Technology & Society, 2005.
wants its universities to become much more globally connected and to train more students for the kind of multidisciplinary, creative industries the government wants to develop.
New Institutions
Underscoring its commitment to educating a creative class, the government established the new Singapore University of Technology and Design. Developed in collaboration with MIT and China’s Zhejiang University, the university will have a multi-disciplinary curriculum and research programs. It is expected to open in 2012. Prime Minister Lee said the university will “teach students to be creative” and will “stimulate students to go beyond the book knowledge, to apply it to solving problems.”285 The university will house an International Design Center modeled after a smaller facility at MIT and intends to “become the world’s premier hub for technologically intensive designs.” MIT will help design programs to encourage innovation and entrepreneurship.
A Focus on Entrepreneurship
The government also is moving to address another perceived weakness in its innovation system: A shortage of entrepreneurialism and breakthrough innovation by Singapore companies, which some analysts blame on a cultural aversion to risk and the heavy government role in the corporate sector. 286 In 2008, Singapore launched the National Framework for Innovation and Enterprise. For those who believe government should play an active role as an investor to spur innovation, Singapore sets a high benchmark. The initiative calls for spending $275 million over five years in the following areas to promote entrepreneurialism. Initiatives include—
• Establishment of a high-level Enterprise Board and innovation fund at each university. The fund supplements the universities’ own resources to finance entrepreneurship education, technology incubators, entrepreneur-in-residence programs, and commercialization of university technologies.
• Grants to companies accepted into incubators covering 85 percent of the cost of developing a proof of concept, up to S$250,000. The National Research Foundation gets an equity stake in exchange that coinvestors may buy out in the next round of financing.
______________________
285 Singapore Ministry of Education press release, Jan. 25, 2010.
286 For example, see Richard W. Carney and Loh Yi Zheng, “Institutional (Dis)incentives to Innovate: An Explanation for Singapore’s Innovation Gap,” Journal of East Asia Studies 9(2):291-319 (http://www.thefreelibrary.com/Institutional+(dis)incentives+to+innovate%3A+an+explanation+for…-a0202704740). Also see Patrick Lambe, “The Engineer’s Dilemma: Innovation in Singapore,” Straits Knowledge, 2002 (http://www.greenchameleon.com/thoughtpieces/engineer.pdf).
• Seed money for early-stage venture capital funds. The NRF will match capital raised by venture capitalists in these funds, which will be managed by professional investors and must invest only in Singaporebased high-tech startups.
• An incubator devoted to disruptive innovation. The NSF will fully match funds for start-ups, which will be assessed based on their “potential to disrupt a current industry and create new ones,” according to the disruptive innovation methodology of Harvard Business School professor Clay Christensen.287
• Grants for polytechnics to perform translational research on R&D conducted by universities and public research institutes. The aim is to get polytechnics and universities to become “strategic partners to bring research breakthroughs to the marketplace.”
• “Innovation Vouchers” for small and midsized enterprises to produce R&D and other services from higher-educational institutes and national laboratories.
• A national center for innovation studies that will propose policies and initiatives to encourage innovation in the public and private sectors.288
Gauging Singapore’s Success
It is too early to fully assess the success of Singapore’s innovation initiatives. A number of companies have been spun off of Singapore research laboratories in areas such as nanotechnology, medical devices, waterpurification, and ultra-low power electronics.289 But Singapore still is regarded as falling short in generating startups that grow to globally recognized companies. Richard W. Carney and Loh Yi Zheng blame institutional “disincentives,” such as heavy government financial and management control over major Singapore corporations and small capital markets that make it hard for entrepreneurs to raise private risk capital and publicly float successful companies. Carney and Zheng also cite a business mind-set that is risk-averse and that focuses on “incremental innovation” rather than “radical innovation.”290 A sharp drop in private research spending that was blamed on global economic
______________________
287 Based on concepts described in Clayton M. Christensen, The Innovator’s Dilemma: The Revolutionary Book that Will Change the Way You do Business, Cambridge: Harvard Business School Press, 1997.
288 National Research Foundation, “National Framework for Innovation and Enterprise,” Prime Minister’s Office, Republic of Singapore, 2008 (http://www.nrf.gov.sg/nrf/otherProgrammes.aspx?id=1206).
289 S&T Strategies in Six Nations, op cit.
290 Carney and Zheng, op. cit.
conditions pushed Singapore’s R&D spending-to-GDP ratio down to 2.3 percent as of 2009, well short of the 3 percent goal for 2010.291
Singapore’s small scale is another perceived handicap in generating domestic innovation, especially in science-based industries such as biotechnology. Singapore’s big investments in life sciences and incentives for pharmaceutical multinationals has resulted in a large biomedical manufacturing base, whose output tripled to S$21.7 billion from 2000 through 2009.292 They also have created high-paying jobs and spurred development of suppliers of materials and R&D services. But progress in luring high-value multinational R&D and stimulating collaboration between foreign companies and domestic ventures has been disappointing, contends Joseph Wong in his book Betting on Biotech. 293 The reason, Wong contends, is that Singapore still lacks the critical mass of researchers, biotech commercialization expertise, and companies with which to collaborate needed to get multinationals to transfer R&D operations to the country. Some critics also have said Singapore’s science strategy depends too much on recruiting aging foreign star scientists rather than grooming domestic talent and younger, foreign-trained Singaporeans to lead research programs.294
As a research base, however, Singapore clearly has progressed. The nation is becoming a global leader in research in infectious diseases and environmental technologies such as water and waste treatment. Singapore also is poised for “industrial domination” in Asia in digital gaming and virtual reality technologies, as well as in networked command and control of traffic and unmanned aerial vehicles, according to the NAS assessment.295 Multinational corporations continue to expand and open new Singapore R&D centers. By constantly improving infrastructure, higher education, and investment incentives, Singapore hopes that this growing research activity will eventually translate into homegrown innovation.
INDUSTRIALIZED NATION CASE STUDIES
Germany is proving that even a high-wage nation can compete globally in manufacturing. Exports of everything from kitchen equipment and industrial
______________________
291 Ministry of Trade and Industry, “Economic Survey of Singapore 2010,”
292 Economic Development Board data cited in Wong Siew Ying, “Biomedical Manufacturing Output Grew to S$21b in 2009,” channelnewsasia.com, March 17, 2010.
293 Joseph Wong, Betting on Biotech: Innovation and the Limits of Asia’s Developmental State, Ithaca, N.Y.: Cornell University Press, 2011.
294 Alice S. Huang and Chris Y. H. Tan, “Achieving Scientific Eminence Within Asia,” Science, Vol. 329, p. 1471-2, Sept. 17, 2010.
295 S&T Policies in Six Nations, op. cit.
machinery to high-speed trains and wind turbines by small and large firms alike296 surged by 18.5 percent in 2010 to €951.9 billion ($1.3 trillion),297 leading the country out of recession. German net exports of goods contributed 1.4 percentage points to its 3.6 GDP growth in 2010, or 40 percent of the total increase.298 German exports to China soared by 44 percent, which could become Germany’s biggest export destination overall by 2015.299 Unemployment in Germany fell to an 18-year low in January 2011.300
Innovation and a system for efficiently converting new technologies into marketable products and large-scale production are keys to this success.
Germany’s innovation system is characterized by heavy corporate and government investment in research, innovative small- and medium-sized enterprises, extensive workforce training, and strong institutions such as Fraunhofer-Gesellschaft that collaborate with Germany industry. The government also works to assure that the nation is a “lead market” for important, emerging technologies through methods such as consumer incentives, government procurement, and standards. 301
Such policies have enabled Germany to become the world’s leading exporter of research-intensive products, according to the German Institute for Industrial Research (DIW Berlin). 302 More than 12 percent of Germany’s exports are research-intensive, double the level of the U.S.303 Programs
______________________
296 Anthony Faiola, “Germany Seizes on Big Business in China,” Washington Post, Sept. 18, 2010.
297 Statistisches Bundesamt Deutschland, “German Exports in 2010: +18.5% on 2009,” Press Release No.052/2011-02-09. These data refer to German exports to both other EU members as well as countries outside the EU. Exports to countries outside the EU increased by 26 percent.
298 World Trade Organization, “Trade Growth to Ease in 2011 But Despite 2010 Record Surge, Crisis Hangover Persists,” WTO Press/628, April 7, 2011.
299 Estimate by UniCredit Markets and Investment economist Andreas Rees cited in Jeff Black, “Germany’s Future Rising in East as Exports to China Eclipse U.S.,” Bloomberg, April 6.
300 German Federal Labor Agency data. Germany’s unemployment rate was at 7.3 percent as of March 2011, compared to an average of 9.7 percent for the previous two decades.
301 A “lead market” is a regional market that can establish the early commercial success of an innovation and large-scale production, increasing the chances of global diffusion. A discussion of Germany’s strategy of establishing a lead market in photovoltaic cells and other technologies can be found in Klaus Jacob, et al, Lead Markets for Environmental Innovations, ZEW Economic Studies, Volume 27, Heidelberg: Physica-Verlag, 2005.
302 DIW Berlin’s definition of research-intensive industries includes automobiles and parts, chemicals, pharmaceuticals, machinery, and engines. In 2009, $670 billion in research-intensive products, compared to $561 by the United States and $388 by Japan. DIW Berlin data cited in presentation by Rainer Jäkel of the Federal Ministry of Economics and Technology in May 24-25, 2011, NAS symposium “Meeting Global Challenges in Berlin. Also see presentation by Stefan Kuhlmann, Fraunhofer ISI in National Research Council, Innovation Policies for the 21st Century, Charles W. Wessner, editor, Washington, DC: The National Academies Press, 2007, and DIW Berlin, “Germany is Well Positioned for International Trade with Research-Intensive Goods,” DIW Berlin Weekly Report, No. 11/2010, Volume 6, March 26, 2010.
303 Heike Belitz, Marius Clemens, Martin Gornig, Florian Mölders, Alexander Schiersch, and Dieter Schumacher, “After the Crisis: German R&D-Intensive Industries in a Good Position,” DIW
promoting wide dissemination of environmental technologies have enabled German companies to capture 16 percent of world trade in that sector, which employs 1.5 million in Germany. Germany is a world leader in optics, a €2 billion industry that also has received significant public support. German machine tool makers are the world market leaders with a share of 19 percent. The nation has some 500 biotechnology companies, and the nanotechnology sector boasts 740 companies and 50,000 industrial jobs.304 Germany also ranks No. 4 in the world in patents granted.305
Over the past decade, the German government has implemented an ambitious agenda designed to maintain the strength of Germany’s global competitiveness. Chancellor Angela Merkel’s government has increased investments in R&D, which rose by one-third to €12 billion ($17.1 billion) from 2005 through 2008.306 Germany spent €80 billion in economic stimulus during the financial crisis, followed by a further €11 billion in stimulus that went to education and science and technology. Coming at a time when other nations were cutting back such spending in the face of recession, the major commitment to innovation represented “a paradigm shift of some importance” for Germany, explained Rainer Jäkel, director general for technology and innovation policy at the Federal Ministry of Economics and Technology (BMWi).307
The government also has been implementing a wide range of policies and programs to improve its innovation system. They include initiatives to—
• upgrade basic science,
• boost private R&D spending,
• strengthen collaboration between universities and business,
• improve the environment for high-tech start-ups, and
• nurture regional innovation clusters.
The government also has unveiled what it describes as Germany’s first comprehensive national innovation framework, High-Tech Strategy 2020, which seeks to consolidate public programs around well-defined missions.308
Some of these efforts appear to be bearing fruit. Corporate investment
______________________
Economic Bulletin 2, 2011. This paper can be accessed at http://www.diw.de/documents/publikationen/73/diw_01.c.377100.de/diw_econ_bull_2011-02-1.pdf.
304 Federal Ministry of Education and Research, Research and Innovation for Germany: Results and Outlook, (http://www.research-in-germany.de/dachportal/en/downloads/downloadfiles/34648/research-and-innovation-for-germany-results-and-outlook-2009-116-pages-.pdf).
305 World Intellectual Property Organization data as of 2008.
306 Federal Ministry of Education and Research, data.
307 Jäkel presentation, op. cit.
308 Federal Ministry of Education and Research, Ideas. Innovation. Prosperity. High-Tech Strategy 2020 for Germany, Innovation Policy Framework Division, 2010.
in R&D surged from €2.3 billion in 2005 to an estimated €9.4 billion in 2008.309 Total R&D spending in Germany reached 2.82 percent of GDP in 2009, the highest level since reunification with Eastern Germany. [See Figure 5.10] The number of people employed in the German R&D sector rose by 15 percent, to 162,000, over that period, with further growth expected.310 A 2009 study by the German Association of Chambers of Industry and Commerce found that around 30 percent of all companies attribute their innovations to improved federal policy.311 The World Economic Forum ranks Germany No. 6 among 142 nations in global competitiveness, including No. 7 in innovation and No. 4 in business sophistication.312 In rankings by the Innovation Union, Germany places a close fourth behind Sweden, Denmark, and Finland, among the European Union’s 27 members, and No. 1 in terms of “innovators.”313
German innovation still faces a number of serious challenges, however. They include a scarcity of venture capital and bank loans for innovative companies, declining momentum in sectors such as electronics and aircraft, and weak performance in eastern Germany and Berlin, which consume a large share of federal research spending but produce relatively little innovation. 314 Germany ranks below most other industrialized nations in researchers as a percentage of total employment [See Figure 5.11], measures of international collaboration in research, and venture capital as a percentage of GDP.315 There also are fears of a looming skills shortage due declining university enrollment as the population ages and disinterest in science and technology fields grows among German youth.316 The Expert Commission on Research and Innovation, known by its German acronym EFI, reports an “urgent need to expand education, research and innovation” and warns that Germany’s global competitiveness is under threat. The EFI also contends that Germany’s tax system must become more innovation-friendly.317
______________________
309 German Federal Ministry of Education and Research data.
310 Ibid.
311 German Association of Chambers of Industry and Commerce data cited in BMBF, “High-Tech Strategy 2020,” op. cit.
312 World Economic Forum, The Global Competitiveness Report 2011-2012, Klaus Schwab, editor, 2011.
313 Pro Inno Europe InnoMetrics, Innovation Union Scoreboard 2010: The Innovation Union’s Performance Scoreboard for Research and Innovation, Feb. 1, 2011.
314 Kuhlmann presentation, op. cit.
315 Jäkel presentation, op. cit.
316 Expert Commission on Research and Innovation (Expertenkommission Forschung und Innovation), “Research, Innovation and Technological Performance in Germany Report 2010,” http://www.kompetenznetze.de/service/bestellservice/medien/kn2010_englisch_komplet.pdf.
317 Expert Commission on Research and Innovation, “Research, Innovation and Technological Performance in Germany Report 2009,” http://www.efi.de/fileadmin/Gutachten/2009_engl_kurz.pdf.
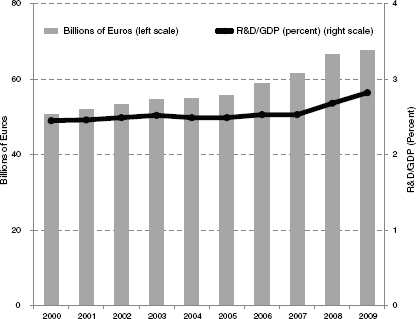
FIGURE 5.10 Germany’s R&D expenditures reached 2.82 percent of GDP in 2009.
SOURCE: Eurostat, date of extraction was 10/29/2011.
For these reasons and others, a study by DIW Berlin rated Germany lower than did the WEF and Innovation Union—at only No. 9 among 17 leading industrialized nations in innovation capacity. While giving Germany strong marks in high technology and in research institutions, the study cited financing of innovative projects in particular as a “major barrier to innovation.” Aversion to risk is another constraint. The study noted that 42 percent of Germans think one should set up a business if there is a chance of failure, compared to nearly 70 percent of Koreans and Irish and 74 percent of Americans. The study rated Germany No. 11 in innovation policy, primarily for spending just 4.5 percent of GDP on education in 2005 compared to 6 percent in countries like Finland and Sweden. 318 And while R&D-intensive products are important in Germany’s
______________________
318 German Institute for Economic Research (Deutsches Institut für Wirtschaftforschung), “Innovation Indicator for Germany 2009,” Deutsche Telekom Foundation and Federation of German Industries. The DIW uses 180 different data items to measure innovation capacity. The summary of the report can be accessed in English at
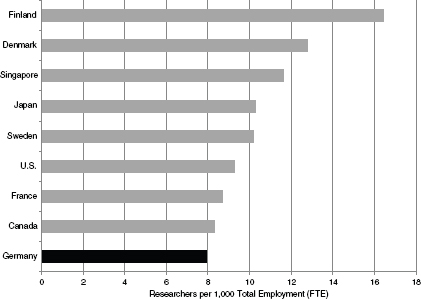
FIGURE 5.11 Germany ranks below most other industrialized nations in researchers per 1,000 total employment.
SOURCE: UNESCO, UNESCO Institute for Statistics, Science and Technology, Table 19.
NOTE: Data are 2009 or most recent year.
foreign trade, “Germany has a marked weakness in foreign trade in the area of cutting-edge technologies.”319 German R&D-intensive products overall make a positive contribution to Germany’s foreign trade, but not in the most R&Dintensive areas. [See Table 5.2]
The government’s new national innovation strategy aims to address these shortcomings.
______________________
http://www.innovationsindikator.de/fileadmin/user_upload/Dokumente/summary2009.pdf. The full report in German can be accessed at http://www.innovationsindikator.de/fileadmin/user_upload/Dokumente/innovationsindikator2009.pdf.
319 The Commission of Experts on Innovation, Research, Innovation and Technological Performance in Germany Report 2011, February 2011, p. 130.
TABLE 5.2 Net Contribution of R&D-Intensive Products to Germany’s Foreign Trade
| R&D-Intensive Products | HighTechnology | Medium HighTechnology | |
| 1995 | 70 | -24 | 94 |
| 2000 | 49 | -36 | 85 |
| 2005 | 50 | -33 | 83 |
| 2009 | 47 | -19 | 66 |
| SOURCE: The Commission of Experts on Innovation, Research, Innovation and Technological Performance in Germany Report 2011, February 2011, Table C7-6. NOTE: Net Contribution = Contribution to Exports – Contribution to Imports. | |||
The German System
Germany’s innovation system differs from that of the U.S. is several fundamental ways. While the U.S. has an “entrepreneurial economy,” explained Engelbert Beyer of the Federal Ministry of Education and Research’s Directorate for Innovation Strategies, Germany’s model is more oriented toward “solid, high-quality progress.”320 While labor and skilled talent easily move to other jobs in the U.S., mobility is more limited in Germany. In terms of federal science and technology policy, programs are dispersed across many agencies in the U.S. In Germany, the Federal Ministry of Education and Research (Bundesministerium für Bildung und Forschung), better known as the BMBF, has a broad portfolio that includes most federal R&D activities and programs to promote commercialization. The Federal Ministry of Economics and Technology, known by its German acronym BMWi, also has a range of technology and innovation programs.
The “innovation rhetoric” differs in Germany and the United States, too, Mr. Beyer said. In the U.S., it is generally believed that government should play a limited role in industry and commerce. In Germany, “it is quite common to refer to government as a problem solver,” Mr. Beyer said. Dr. Jäkel of BMWi pointed out that the German government has no qualms about providing “cradle to grave” financial assistance for R&D and commercialization efforts by smalland medium-sized enterprises in the case of “market failure” by private lenders. “The government has the right to intervene,” he said. “It is well known that the banks are not so supportive.”321
The German system also distributes its R&D investments very differently than the United States. While the U.S. innovation system seeks breakthroughs in a broad spectrum of sciences and technologies, most German
______________________
320 Comments by Engelbert Beyer of the Federal Ministry of Education and Research in Nov. 1, 2010, “Meeting Global Challenges” symposium in Washington, op. cit.
321 Jäkel presentation, op. cit.
R&D spending is on industries in which the country already is established, such as automobiles and machinery. The U.S. is great at “disruptive technologies and radical inventions,” explained German State Secretary for Education and Research Georg Schütte. “Germany is strong in gradual change.” The chief beneficiaries of Germany’s high focus on applied research are the Mittelstand, the small and medium-sized export manufacturers that are the nation’s “hidden champions” and that pursue market leadership in niches, he said. State Secretary Schütte noted that there is wide discussion in Germany whether this model is sustainable in light of growing shortages of skilled workers as the population ages and intensifying competition in manufacturing industries from East Asia. “Some people think we are sitting in the dining car,” he said.322
The emphasis on manufacturing and exports, however, has served Germany well over the past few years of global turbulence. The government’s response to the 2008-2009 global financial crisis and recession highlighted the importance that Germany places on preserving its manufacturing sector, which was hit hard. In the U.S., manufacturers laid off workers, who then sought public unemployment benefits. Germany, by contrast, subsidized manufacturing salaries so that staff could stay on payrolls while working part time. As a result, consumer spending and service industries remained robust through the recession, according to Klaus F. Zimmerman, former president of DIW Berlin. When recovery came, German exporters were able to quickly increase production and gain market share. 323
There are strong linkages between government-funded research and public-private commercialization activities. Nearly half of federal R&D funds go to national research institutes. They include the Max Planck Society, which conducts basic research, and the Helmholz-Gemeinschaft, which has a network of 17 major research centers on long-term scientific challenges such as health, energy, the environment, and transportation. The Leibniz Association, an umbrella organization of 87 independent state-controlled institutes, performs research on scientific issues of strategic importance, such as life sciences, natural sciences, and social sciences. Fraunhofer- Gesellschaft acts as a “technology bridge” to industry, in the words of Executive Director Roland Schindler.324
Funding of research organizations is shared between the federal government and the states. This reflects changes to Germany’s constitution in 1946, when it was under Allied control. The constitution was designed to prevent the central government from having sole control over education.
______________________
322 From May 24, 2011, remarks by Georg Schütte at “Meeting Global Challenges” symposium in Berlin, op. cit.
323 From presentation by Klaus F. Zimmerman of the German Institute for Economic Research in Nov. 1, 2010, “Meeting Global Challenges” symposium.
324 See presentation by Roland Schindler, executive director of Fraunhofer, in November 1, 2010, “Meeting Global Challenges: U.S.-German Innovation Policy” symposium in Washington, op. cit.
Overall, the German research system “is a system that works well, with a clear division of labor, varying degrees of autonomy and state control, and distinct research organizations whose activities partly overlap and partly are different,” explained Leibnitz Association President Karl Ulrich Mayer. One challenge, Mr. Mayer noted, is that many German state governments have weak tax bases, making it difficult for them to carry the educational funding load.325
One downside of Germany’s large science and technology bureaucracy is that it also is considered unwieldy. The two agencies that dominate policy, the BMBF and BMWi, collaborate in many realms but have tended to compete and duplicate each other’s work, as Stefan Kuhlmann of Fraunhofer ISI observed. He added that the BMBF’s immense array of technology and innovation programs so broad that they are difficult to track.326 The same is true of BMWi whose extensive portfolio sometimes overlaps with BMBF programs. Coordination among German’s big research institutions also has traditionally been spotty. In addition, the Länder—Germany’s 16 states—have their own research and technology programs.327
Forging a Common Strategy
To address these challenges, German leaders have been seeking to better coordinate the efforts of government, research organizations, and industry to improve innovation and the translation of technology into marketable products. In October 2003, Chancellor Gerhard Schröder summoned representatives of public agencies, policy circles, major companies, small business associations, major research organizations, and other stakeholders to debate challenges to German innovation. The forum led to formation of the Partnership for Innovation initiative, which aimed to define a national innovation framework.
In 2010, the German government unveiled High-Tech Strategy 2020, which it described as the country’s “first broad national concept in which the key stakeholders involved in innovation share a joint vision.” The primary goals are to build lead markets, bridge industry and science, and improve framework conditions such as access to early-stage finance, intellectual property protection, public procurement, and the ability of universities and research institutions to commercialize research. The plan aims to “stimulate Germany’s enormous scientific and economic potential in a targeted way and find solutions to global and national challenges”.328
The strategy is to coordinate government-funded research and
______________________
325 Presentation by Leibnitz Association President Karl Ulrich Mayer in May 24-25 “Meeting Global Challenges” symposium in Berlin.
326 Kuhlmann presentation, op. cit.
327 Ibid.
328 Federal Ministry of Education and Research, High-Tech Strategy 2020 for Germany,” op. cit. Framework Division, 2010.
innovation activities across all departments around five broad themes: climate and energy, health and nutrition, mobility, security, and communication. The government defines “forward-looking projects” in science, technology, and social development and detailed roadmaps to achieve each of the overarching missions over 10 to 15 years. These “projects” include developing technologies and services to make model regions “carbon-dioxide neutral,” development of smart grids and large power-storage systems, technologies that help people live well into old age, deploying electric vehicles on Germany roads by 2020, and developing new work organization models that allow people to remain productive longer. 329
The national strategy incorporates a number of national innovation programs and initiatives to achieve these goals. They include programs to develop specific technologies, promote regional innovation clusters, upgrade higher education and scientific research, forge “innovation alliances” among corporations and universities, support small enterprises, and launch technology startups. German activities in energy and the environment, information and communications technology, and transportation illustrate how high-minded policy goals are integrated with strategies to develop globally competitive export industries.
Energy Efficiency: By 2020, the federal government proposes to reduce Germany’s greenhouse gas emissions by 40 percent below 1990 levels and to double energy productivity. It also has set a target of having renewable energy meet 18 percent of gross energy consumption and provide for 35 percent of electricity by 2020. By 2050, greenhouse gasses are to be 80 percent below 1990 levels, while renewable sources will account for 60 percent of total consumption and 80 percent of electricity generation.330
To achieve those goals, there are detailed “fields of action.” They include investing aggressively in renewable sources such as offshore wind power and bioenergy; expanding nuclear energy and promoting clean coal-fired plants; upgrading the national power grid; research and incentive programs to promote energy efficiency in industry, buildings, and households; aggressively promoting green transportation; and expanding R&D in innovative new energy technologies. Recognizing that the global market for energy-efficiency and environmental products is projected to reach €2.2 trillion by 2020, the BMBF,331 BMWi, Fraunhofer, and other organizations also have ambitious programs to commercialize technology through regional innovation clusters, public-private
______________________
329 Ibid.
330 Federal Ministry of Economics and Technology and Federal Ministry for the Environment, Nature Conservation and Nuclear Safety, Energy Concept for an Environmentally Sound, Reliable and Affordable Energy Supply, Sept. 28, 2010 (http://www.bmu.de/files/english/pdf/application/pdf/energiekonzept_bundesregierung_en.pdf)
331 Data cited in Federal Ministry of Economics and Technology, Research and Innovation in Germany, op cit.
research alliances,332 and small-business assistance.
Government measures to establish Germany as a “lead market” for new energy technologies also help German industry attain scale in emerging industries. High feed-in tariffs for all renewable energy were instrumental in making Germany a leader in photovoltaic manufacturing, for example.333 Even though Germany only receives about as much sunlight as Alaska, its photovoltaic manufacturing industry outperforms that of the U.S. by a factor of six, noted John Lushetsky, director of the Solar Energy Program of the U.S. Department of Energy. As a result of the scale of investment, solar modules in Germany cost around half of what they do in the United States.334 The BMBF predicts that the renewable-energies sector could employ up to 500,000 people by 2020, and that exports of renewable-energy products will rise from €500 million in 2007 to €9 billion by 2020.335
Partnerships for Transportation Technology: Germany is a global leader in automobiles, high-speed train systems, and other transportation equipment. By setting a target of having 1 million electric vehicles by 2020, the government wants to make Germany a lead market in electric mobility and associated information systems. As the center of Europe’s automotive industry, Germany in a good position to provide momentum for new technologies, the marketability of innovative vehicles, light-weight construction methods for aircraft, and development of global standards.
To this end, German public-private partnerships are investing in a wide range of transportation-related technologies. There is a national plan to develop lithium-ion technologies for electric-car batteries and for hydrogen fuel cells, for example.336 Concerted research and product-development programs are underway in new drive systems, fuels, satellite navigation systems, trafficcontrol networks, mobile electronic services, and logistic concepts, among other fields.337
Information and communication technologies: The Federal Government’s new ICT five-year plan sets out a broad agenda to “better harness
______________________
332 Federal Ministry for the Environment, Nature, Conservation and Nuclear safety, for instance, has announced it will invest €250 million in four “innovation alliances” for climate-protection technologies. Press release, Nov. 11, 2008.
333See the Photovoltaic Industry Case Study in Chapter 6 of this volume.
334 See presentation by John Lushetsky of the U.S. Department of Energy in Nov. 1, 2010, “Meeting Global Challenges” symposium in Washington.
335 Research and Innovation in Germany, op. cit.
336 See German government “National Hydrogen and Fuel Cell Technology Innovation Programme,” May 8, 2006 (http://www.nkj-ptj.de/datapool/page/3/NIP-en.pdf).
337 A comprehensive explanation of German programs to develop next-generation transportation technologies can be found in German Federal Government’s National Electromobility Development Plan, August 2009 (www.bmvbs.de/cae/servlet/contentblob/27978/publicationFile/9729/nationalelectromobility-development-plan.pdf).
the large potential of ICT for growth and employment in Germany.” 338 Broad goals include wiring the country with high-performance broadband networks of at least 50 megabits per second that will reach three-quarters of the population by the end of 2014 and the entire country as soon as possible. They also include deploying state-of-the-art, smart IT networks and services across industries and enabling paper-free government by 2012.
The ICT Strategy for 2015 calls for accelerating development of flagship projects, such as a super high-speed Internet service, digital data protection technologies, and intelligent networks for education, energy, mobility, public administration, and tourism. Public-private research projects, “innovation alliances,” and research contracts are devoted to virtual reality, cloud computing, intelligent autonomous devices, connected household appliances, smart national identity cards. Various Germany government agencies also support programs to support ICT startups, provide expert help for small- and medium-sized businesses, vocational training, and export promotion for ICT-enabled services. The government envisions that such services can add 30,000 jobs.339
Improving Germany’s Innovation System
Beyond the broad technology goals and industrial-development targets, Germany is pursuing a range of initiatives aimed at improving the nation’s ability to innovate and disseminate new technologies more quickly and efficiently. The intent is to strengthen the linkage between the creation of knowledge and creation of products, explained Bernhard Milow, director of the German Aerospace Center’s energy program. “Our view is that if we continue with the innovation process we have today, we cannot achieve our goals because it is too slow.”340 These initiatives include upgrading the quality of university research and commercialization, regional innovation clusters, public-private research alliances, promotion of small and midsized business, and improving the environment for enterprises.
Unleashing Universities and Research Institutes: The federal government and Länder—which control funding for higher education—have taken a number of steps over the past decade to upgrade the quality of university research, break down barriers between academia and industry, and commercialize university R&D. “A high-wage country needs to invest in education, universities, and research to foster innovation,” explained former DIW president Zimmerman. “This is what you have to do to maintain
______________________
338 Federal Ministry of Education and Research, ICT Strategy of the German Federal Government: Digital Germany 2015, November 2010 (http://www.bmwi.de/English/Redaktion/Pdf/ict-strategydigital-germany-2015,property=pdf,bereich=bmwi,sprache=en,rwb=true.pdf).
339 Ibid.
340 From presentation by Bernhard Milow of German Aerospace Center energy program in Nov. 1, 2010, “Meeting Global Challenges” symposium in Washington.
competitiveness.” 341
A turning point was the Knowledge Creates Markets initiative in 2001 to create a “broad-based patenting and exploitation infrastructure.” 342 Among other things, universities were given ownership of intellectual property created by academics, along the lines of the U.S. Bayh-Dole Act of 1980. The reform made it easier for universities to create larger portfolios of technologies and compete with top U.S. universities.343 To help universities commercialize research and negotiate contracts, Patent Marketing Agencies were set up in each state, with the federal and Länder governments splitting the costs. These agencies also pooled resources into a national network called TechnologieAllianz e. V., which provides services to 200 scientific institutions with more than 100,000 scientists.344
Major research institutes such as Max Planck, meanwhile, have been given greater leeway to commercialize their research. The Freedom of Science Act gives these institutions more latitude to manage their own financial resources. Also, compensation for researchers no longer is restricted by government civil-service rules.345 However, these institutes are expected to orient more of their research around missions defined by the national High-Tech Strategy.
Research universities have received substantial funding increases under several major programs. The Initiative for Excellence, for example, is a €1.9 billion, five-year federal program run by the German Research Foundation that allocates funding on a competitive basis to promote cutting-edge research, collaboration among institutions and disciplines, and international research alliances. One goal is to create a set of elite Germany universities.346 So far, the initiative has granted funds to 44 graduate schools to expand research by young scientists, “clusters of excellence” based at universities, and eight “universities of excellence” that have developed “future concepts” for high-level research. 347 The initiative is expected to create 4,000 new positions. As a result of the program, “universities have moved to the center of the German science system,”
______________________
341 Zimmerman presentation, op. cit.
342 See Federal Ministry of Education and Research and Federal Ministry of Economics and Technology, Knowledge Creates Markets: Action Scheme of the German Government, March 2001 (http://www.bmbf.de/pub/wsm_englisch.pdf).
343 Engelbert Beyer presentation, op. cit.
344 TechnologieAlliance Web site, http://translate.google.com/translate?hl=en&sl=de&u=http://www.technologieallianz.de/&ei=EJsTfHgJ8Tk0QGujdmWDQ&sa=X&oi=translate&ct=result&resnum=6&sqi=2&ved=0CD4Q7gEwBQ&prev=/search%3Fq%3DGermany%2BTechnologieAlliance%2Be.%26hl%3Den%26prmd%3Divns.
345 Federal Ministry of Education and Research, Research and Innovation in Germany, op. cit.
346 Gretchen Vogel, “A German Ivy League Takes Shape,” Science Magazine, Oct. 13, 2006.
347 Excellence Initiative data from German Research Council (Deutsche Forschungsgemeinschaft) Web site at http://www.dfg.de/en/magazine/excellence_initiative/index.html.
according to a BMBF report. The federal government and Länder have approved another €2.7 billion in funding through 2017.348
Another goal is to sharply increase enrollment in higher education. Under the Higher Education Pact 2020, the federal government and Länder will provide €26,000 per place until 2015 to help create new positions for up to 275,000 first-semester students in tertiary institutions.349
Regional Innovation Clusters: Research programs in Germany have tended to be dispersed across the country, making it difficult to develop regional innovation clusters that commercialize new technologies.350 Several publicprivate initiatives have sought to form regional innovation clusters in emerging industries. The Fraunhofer institutes are leading a government effort to help consolidate research activities into 16 innovation clusters. An emerging bioenergy cluster based in North Rhine-Westphalia district, for example, has 17 regional partners from industry and academia. Other innovation clusters that the Fraunhofer institutes are helping to organize include one in optical technologies based in Jena, electronics for sustainable energy based in Nuremberg, turbineproduction technologies based in Aachen, and digital production based in Stuttgart.351
The BMBF also has a program to support regional innovation clusters. In 2007, the ministry launched the Top Cluster competition in which industryled strategic partnerships around Germany vied for €200 million in BMBF funds. The first five winners were an aviation cluster forming in the Hamburg region, Solar Valley in Mitteldeutschland (Middle Germany), energy-efficiency innovations in Saxony, and electronics and cell- and molecular-based medicine in the Rhine-Neckar metropolitan region.352
Innovation Alliances: New forms of German public-private partnerships are being encouraged to advance new technologies. One initiative is called “innovation alliances.” Under the program, corporations must decide at the board level to co-invest with government. The German government is investing €500 million and private industry €2.6 billion in nine such alliances. Government funds are typically leveraged five-fold through private investment. An initiative for a cluster in molecular imaging for medical engineering, for example, includes Bayer Schering Pharma, Goehringer Ingelheim Pharma, and Siemens. The alliance, which has a €900 million research budget, seeks to create
______________________
348 Details on the Excellence Initiative can be found on the German Research Council (Deutsche Forschungsgemeinschaft) Web site at http://www.dfg.de/en/magazine/excellence_initiative/index.html.
349 Data from Research in Germany Web site of the BMBF http://www.research-ingermany.de/research-landscape/r-d-policy-framework/60122/higher-education-pact.html
350 Schindler presentation, op. cit.
351 Information on Fraunhofer innovation cluster initiatives is found on the Fraunhofer Web site at http://www.fraunhofer.de/en/institutes-research-establishments/innovation-clusters/.
352 Federal Ministry of Education and Research Web site.
new diagnostic products and imaging procedures for clinics at the molecular and cell level. Other such alliances focus on automotive electronics, energy-efficient lighting using organic light-emitting diodes, organic photovoltaic cells, and lithium-ion batteries for energy storage.353
BioIndustry 2021 is another such initiative. Launched by the BMBF in 2008, the program allocates funds to strategic partnerships between scientific organizations and industry aimed at speeding up the translation of ideas and research findings into marketable products. The federal government, industry, and Länder contribute funds. Five clusters have been selected. One is Hamburgbased Biocatlaysis2021, devoted to manufacturing chemicals, cosmetics, foods, and detergents. It includes 19 small- and medium-sized companies, 22 academic research groups, and seven agencies. 354
Reinvigorating Small Business: More than one-quarter of innovation expenditure in German manufacturing and nearly half in knowledge-intensive businesses are by Mittelstand businesses. Small and medium-sized manufacturers are regarded as the backbone of Germany’s advanced industrial sector. Many have been run by the same families for three or four generations, frequently reinventing themselves to keep up with the times, and tend to be “be long-term minded when it comes to research and developed,” noted BWMi official Jäkel.355 Middelstand companies also tend to be anchored in their regions and maintain close ties with local universities and research institutes, and therefore “won’t easily relocate from one country to another.” Small and medium-sized enterprises are especially important in Germany’s biotechnology, optical, nanotechnology, and information technology sectors. Still, the vast majority of SMEs spend little on regular R&D, according to Germany’s Center for European Economic Research.356 Mr. Jäkel cited difficulty raising funds for R&D from banks as a major reason.
The government is seeking to increase R&D by smaller companies by connecting them to federal research programs and through expanded financial subsidies. In 2008, several SME-related activities within the BMWi were consolidated into the Central Innovation Programme SME, known by its German acronym ZIM.357 One of those BMWi programs, Pro Inno, was established in 1999 and had distributed research grants to thousands of firms and more than 240 research organizations. An evaluation by Fraunhofer praised Pro
______________________
353 Information on Germany’s Innovation Alliances is found on the Research in Germany Web site, http://www.research-in-germany.de/coremedia/generator/research-landscape/rpo/networks-andclusters/41832/10-3-innovation-alliances.html.
354 BioCatalysis2021 Web site, http://www.biocatalysis2021.net//?page=Partner.
355 Jäkel presentation, op. cit.
356 Centre for European Economic Research, “Monitoring and Evaluation of ‘KMU-Innovativ’ Within the High-tech-Strategy” (http://www.zew.de/en/forschung/projekte.php3?action=detail&nr=814).
357 In 2008 and 2009, the programs PRO INNOII, INNO NET, NEMO, and INNO-WATT were restructured and integrated into Central Innovation Programme.
Inno’s high transparency, easy access, and relative lack of bureaucracy and found that some three-fourths of participating firms would not have conducted the R&D had it not been for the program.358
ZIM has an annual budget of around €300 million, and it received an additional €900 million through Germany’s economic stimulus program in 2009 and 2010. It also expanded its services to include larger companies with up to 1,000 employees. ZIM’s stated goals are to encourage SMEs to dedicate more efforts to innovation, reduce the risks of technology-based projects, and rapidly commercialize research.359 ZIM has different programs to support cooperative research projects between enterprises and research organizations, R&D commercialization projects by individual SMEs, and innovative networks involving at least six companies. ZIM offers grants of up to €350,000 covering 35 percent to 50 percent of R&D costs, depending on the company’s size and location. The program is not limited to technologies or sectors. Research institutions that cooperate with these firms can receive grants covering their entire costs up to €175,000.360 As of late 2010, ZIM had allocated €1.4 billion in grants that were matched by €1.5 billion in SME contributions. 361 The program receives around 6,000 applications a year.
The BMBF has its own SME innovation program, KMU-Innovativ. It focuses on biotechnology, information and communications, nanotechnology, optics, energy, and production research. KMU-Innovativ also offers research grants and helps SMEs get better access to federal research funding. One objective of the program is to lower the technological and financial track record requirements that had prevented many smaller enterprises from competing for research funds.362
Early-Stage Capital
The BMBF declares that “Germany needs to go back to being a country of start-ups.”363 The paucity of venture capital in Germany is a “major bottleneck” to achieving this goal, explained Dietmar Harhoff, chairman of the Commission of Experts for Research and Innovation, whose annual reports have detailed shortcomings in Germany’s entrepreneurship environment. In the U.S., Dr. Harhoff noted, young inventors seeking to start a company often go to angel
______________________
358 Khulmann presentation, op. cit.
359 Federal Ministry of Economics and Technology, Central Innovation Programme (ZIM), January 2011 (http://www.zim-bmwi.de/download/infomaterial/informationsbroschuere-zim-englisch.pdf).
360 Ibid.
361 For an analysis of ZIM, see European Commission, ZIM, the Central Programme for SMEs (Zentrales Innovationsprogramm Mittelstand), PRO INNO Europe, INNO-Partnering Forum, Document ID: IPF 11-005, 2010.
362 Centre for European Economic Research, op. cit.
363 High-Tech Strategy 2020, op. cit.
investors. In Germany, they often go to the government—or abroad. 364
To address this goal, the government has taken several moves to help make more capital available to start-ups. In 2005, the BMBF formed a €272 million public-private capital partnership called the High-Tech Start-ups Fund. Participants include BMWi, KfW Bank Group, BASF, Deutsche Telekom, Siemens, Robert Bosch, and Daimler. The fund invests up to €500,000 in new, promising companies. The goal is to support young companies for up to two years from the R&D stage through development of proof of concept and even market entry, by which time it is hoped that private financing will be available. In its first five years, the fund has pledged to take holdings in 177 technology companies.365
The BWMi has its own program to aid start-ups, called EXIST. The program helps universities build infrastructure to assist technology- and knowledge-based ventures. EXIST also provides stipends of up to €2,500 a year for equipment, materials, coaching, and childcare to scientists and students who wish to develop business ideas. EXIST’s Transfer of Research program provides grants for up to 18 months for technology startups.366 BMWi official Jäkel said this public-private model has proved very successful and that private ventures “have really gone on board.” Now BWMi is setting up a second fund that will have contributions from at least 10 German companies.367
International Cooperation
Recognizing that Germany cannot attain its broad technology goals on its own, the government’s innovation policies devote considerable attention to international cooperation. There are more than 50 bilateral agreements between German and U.S. institutions.368 In February 2010, Germany and the U.S. signed their first umbrella science-and-technology agreement and signed memorandums of understanding in the fields of energy and cancer research.369 The German government also recently opened the German Center for Research and Innovation in New York and broke ground on the Max Planck Florida Institute in Florida. German and American scientists collaborate on numerous programs, such as the German Electronic Synchrotron, the Large Hadron Collider at the European Organization for Nuclear Research, and on what is described as the world’s most powerful spallation neutron source SNS under
______________________
364 Remarks on May 24, 20111, by Dietmar Harhoff of the Commission of Experts for Research and Innovation at “Meeting Global Challenges” symposium in Berlin, op. cit.
365 Data from the Web page http://www.hightech-strategie.de/en/879.php.
366 Data from BWMi Web site.
367 Jäkel presentation, op. cit.
368 For a comprehensive explanation of bilateral cooperation in science and technology, see Federal Ministry of Education and Research, “Germany and the United States Increase Their Cooperation,” March 24, 2011 (http://www.bmbf.de/en/6845.php).
369 See presentation of John Holdren at Nov. 1, 2010, “Meeting Global Challenges” symposium in Washington.
construction at Oak Ridge National Laboratory. The German government is seeking to expand such partnerships.370 German Minister of State Werner Hoyer noted that Germany and the U.S. face several immense common technological challenges, such as the need to develop renewable energy, improve energy efficiency, and safeguard their nations from terrorism and other asymmetrical threats. “We are more likely to succeed if we combine our resources and technology,” Minster Hoyer said.371
Remaining Challenges
Despite the abundance of innovation initiatives and programs, there are concerns that Germany isn’t moving fast enough in some areas. DIW Berlin projects that the nation will have a shortfall of 270,000 skilled workers by 2020,372 for example. A recent study by the Cologne Institute for Economic Research estimated that Germany’s skills shortage costs the economy up to €20 billion a year, or one percentage point of GDP.373 In addition to spending more on education, the authors assert Germany should be more open to immigration. Non-EU residents wishing to work in Germany must have a yearly income of €80,000, for example. The study estimates Germany’s GDP could increase by up to €100 billion by 2020 if it relaxed immigration rules for skilled workers.
The Experts Commission on Research and Innovation calls for dispensing with income thresholds and instead linking admission to immigrants’ qualifications. The commission also notes that many German scientists leave the country after they graduate, while not many foreign scientists move to Germany. It calls for the government to find ways to retain and recruit top talent. The commission also says the government must do more to encourage more German youth to study mathematics, engineering, and science, where college enrollment is declining.374
Germany’s tax policies also are cited as a disincentive to investment. Germany cut its corporate tax rate from 38.65 percent to 29.83 percent in 2007, placing it near the median point of European economies. But the Experts Commission notes that Germany is one of few industrial nations that do not offer a tax credit for R&D. The commission blames tax policies for falling R&D investment by small- and medium-sized enterprises and the scarcity of private
______________________
370 From presentation by German Ambassador to the United Sates Klaus Scharioth in Nov. 1, 2010, symposium “Meeting Global Challenges: U.S.-German Innovation Policy” in Washington, DC.
371 Remarks by Minister of State Werner Hoyer at May 24, 2011, “Meeting Global Challenges” symposium in Berlin.
372 German Institute for Economic Research data cited in Juliane Kinast, Christian Reiermann, and Michael Sauga, “Labor Paradox in Germany: Where have the Skilled Workers Gone?,” Spiegel Online, June 22, 2007.
373 Cologne Institute for Economic Research data cited in Bertrand Benoit, “German Gap Costs €20 bn,” Financial Times, Aug. 20, 2007.
374 Expert Commission on Research and Innovation, “Research, Innovation and Technological Performance in Germany Report 2010,” op. cit.
risk capital. The commission asserts that shortages of angel funding and venture capital could worsen unless Germany adopts an “internationally competitive, growth-promoting tax framework.”375
Although technology transfer from universities and research institutes has improved in recent decades, there still is room for improvement. The Expert Commission calls for strengthening the autonomy of universities and research institutes, freeing scientists from public-service regulations, and allowing professors to use their time more flexibly, such as by making teaching requirements less rigid.376 The commission also suggests that universities create performance-related incentives for scientists and transfer of team members and to ease constraints on university and research institution participation in spinoffs companies.
Openness and an emphasis on public-private partnership pervade the innovation system of Flanders, the Dutch-speaking region of Belgium. This approach has made Flanders, with its population of only about six million, an influential voice in technology policy in Europe.
Flanders’ official strategy is to become “a region where businesses establish their research centers and where high-tech companies can develop.”377 To accomplish this, Flanders has adopted a cohesive strategy that combines strong public funding for science and technology, high-level guidance, and strong bottom-up input from industry. Its assets include a well-educated and multi-lingual workforce, strong higher education system, first-rate transportation and logistical infrastructure, and central location in Europe.378
The government is investing heavily in its universities and a range of new organizations to develop human resources and spur commercialization of knowledge. The government also provides early-stage financing for small and midsized enterprises and spreads the innovation message relentlessly through schools and the media.
______________________
375 Ibid.
376 Expert Commission on Research and Innovation, “Research, Innovation and Technological Performance in Germany Report 2009,” op. cit.
377 Greta Vervliet, Science, Technology, and Innovation, Ministry of Flanders, Science and Innovation Administration, 2006.
378 See presentation by Peter Spyns of the Flanders Department of Economy, Science, and Innovation in National Research Council, Innovative Flanders: Innovation Policies for the 21st Century—Report of a Symposium, Charles W. Wessner, editor, Washington, DC: The National Academies Press, 2008. This volume summarizes proceedings from a symposium convened by the NAS STEP Board in Leuven in the Flanders region of Belgium in September 2006 titled “Synergies in Regional and National Innovation Policies in the Global Economy.”
Box 5.4 The German Fraunhofer Institutes
Fraunhofer-Gesellschaft has been a major factor behind Germany’s continued export success in advanced industries despite high labor costs. Established in 1949 as part of the effort to rebuild of Germany’s research infrastructure,379 the non-profit organization is one of the world’s largest and most successful applied technology agencies. Fraunhofer’s 80 research institutes and centers in Germany and around the world employ some 17,000 people— 4,000 of them with Ph. Ds and master’s students—and has a $2.3 billion (€1.62 billion) annual budget.380
The mission, in the words of Executive Director Roland Schindler, is to act as a “technology bridge” to German industry.381 Although Fraunhofer researchers publish scientific papers and secure patents—they filed 685 applications in 2009—their primary mission is to disseminate and commercialize technology. Most of the organization’s remarkable range of applied-research programs, which span microsystems, life sciences, communications, energy, new materials, and security, focus on clearly identified market opportunities and collaboration with German manufacturers.
Fraunhofer institutes offer a broad portfolio of services to its 5,000 corporate clients. Fraunhofer engineers develop intellectual property on a contract basis, hone product prototypes and industrial processes, and work with manufacturers on the factory floor to help implement new production methods. The institutes also can conduct market research and offer consulting services. Some Mittelstand manufacturers—the small and medium-sized enterprises that are the backbone of Germany’s high-value export sector—have been Fraunhofer clients for generations. Nearly one-third of clients have 250 or fewer employees.382
A major source of Fraunhofer’s strength and durability has been its diverse funding base, which enables its institute to perform their own in-house cutting-edge research, remain engaged in strategic national innovation programs, and collaborate with industry. Federal government and state funding, which covers one-third of its budget, has been stable and has steadily increasing, enabling Fraunhofer to plan for the long term, Dr. Schindler explained. Another third of Fraunhofer’s revenue comes from manufacturing clients. Fraunhofer’s
______________________
379 For a history of the organization, see, 60 Years of Fraunhofer-Gesellschaft, Munich: FraunhoferGesellschaft, 2009. The publication can be accessed at http://www.germaninnovation.org/shared/content/documents/60YearsofFraunhoferGesellschaft.pdf.
380 Fraunhofer data.
381 See presentation by Roland Schindler, executive director of Fraunhofer, in Meeting Global Challenges: U.S.-German Innovation Policy, op. cit.
382 Fraunhofer data.
59 Institutes of Applied Research in Germany collaborate closely with manufacturers in 16 different clusters. The federal government generally matches funds raised from industry. Half of the industry contracts are with small and medium-sized enterprises. When contracted to perform research, institutes agree to meet deadlines, milestones, and deliverables. Customers own the intellectual property.
The remaining third comes from publicly funded research projects that it wins on a competitive basis from the German government and the European Union. These keep Fraunhofer at the forefront of developing technologies meeting national and European Union priorities. Fraunhofer institutes own the intellectual property resulting from German government-funded research.
The diversity also enables Fraunhofer to use different approaches to commercialize technology. One way is by helping develop specific technologies for companies. Schott Solar, for instance, contracted with Fraunhofer to develop technology for absorber tubes used in solar receivers that now are being exported out of Schott’s factory in Albuquerque, N. M. Fraunhofer earned Industrial research revenue of $654 million in 2009.383
Fraunhofer commercializes technology developed through in-house research or through its numerous R&D collaborations in Germany and abroad. Recent Fraunhofer lab inventions for industry include touch-controlled organic light-emitting diode (OLED) lighting, artificial animal tissue for drug testing, lightweight bicycle seat posts, new steel-cutting techniques for car manufacturers, micro-helicopters, and ultra-efficient gem-cutting tools.384 One of the most lucrative Fraunhofer success labs is an algorithm co-developed with AT&T Bell Labs and other collaborators to reduce the size of audio files used in MP3 players. The institute earned several hundred millions from licensing the digital-compression technology.385 In 1999, the organization set up Fraunhofer Ventures, a consulting service for start-ups credited with assisting 150 spinoffs.386
The technological diversity of Fraunhofer institutes also enables them to pursue promising niches in hybrid industries, such as the integration of multimedia technologies with medical devices. The Fraunhofer Heinrich Hertz Institute, which specializes in information and communications technology, has been developing 3-dimensional imaging, sensor, and communication network technologies with many possible medical applications. Engineers have developed immersive displays that can allow a surgeon to view a 3-D image of a heart without wearing special glasses, for example, and to manipulate the
______________________
383 Fraunhofer-Gesellschaft, Annual Report 2009: With Renewed Energy (http://www.fraunhofer.de/en/Images/Annual-Report_2009_tcm63-60137.pdf).
384 Explanations of these are examples are found in Fraunhofer-Gesellschaft 2009 annual report, ibid.
385 See Mary Bellis, “The History of MP3,” About.com, (http://inventors.about.com/od/mstartinventions/a/MPThree.htm).
386 Fraunhofer Ventures Web site, http://www.fraunhoferventure.de/en/
images by moving his or her fingers. The institute also is developing a handheld devise using Terahertz waves to probe for cancer cells inside the body.387
Another element of Fraunhofer’s success is its ability to strike a balance between coordination of its German institutes with management autonomy. The Fraunhofer Group for Microelectronics, which has a $285 million annual budget, coordinates 12 Fraunhofer institutes working on topics such as automation and smart-system integration. The Information and Communication Technology group has 14 member institutes, including digital media, e-business software, and traffic and mobility. A production group coordinates R&D activities of seven institutes. Other institutes collaborate on the emerging field of flexible electronics, another Fraunhofer strength. The Institute for Photonic Microsystems and Institute for Electron Beam and Plasma Technology, for example, have demonstrated what it is billed as the first successful roll-to-roll manufacturing system that deposits OLED materials on sheets of aluminum, a process with wide potential applications for solar cells, memory systems, sensors, lighting, and other devices.388
At the same time, Fraunhofer’s headquarters tries to give its institutes the latitude needed set their own direction in developing technologies and responding to opportunities. “Headquarters does not tell institutes what to do. We try to give them as much autonomy as possible,” explained Anke Hellwig, liaison office for Fraunhofer USA’s seven U.S. centers. “We try to keep a very delicate balance between the institutes having their own culture and with a Fraunhofer culture and branding.”389
Headquarters appoints institute directors and imposes guidelines. For example, each institute director must also serve as the department chair at a local university in order to maintain strong links with academia. Headquarters allocates funding to each institute based on performance, using a formula that is heavy weighted toward their ability to raise funds from industry and research work. “We support the institutes that are successful in the market and want them to grow further,” Ms. Hellwig explained. Revenue from industry must range from between 25 percent to 70 percent. If the institute operates below that number for several years or run steady deficits, headquarters could dissolve an institute or transfer operations to another organization.390
Retaining talent also is a challenge because the pay scales of scientists and engineers are dictated by German civil service rules. On the one hand, a
______________________
387 From presentation by TK of Fraunhofer Heinrich Hertz Institute in May 25-26 symposium “Meeting Global Challenges: German-U.S. Innovation Policy,” organized by the German Institute for Economic Research and the National Academies, Berlin.
388 Printed Electronics World, “Smoothing the Way for Economic Flexible OLEDs,” April 20, 2010.
389 Interview with Anke Hellwig of Fraunhofer in Berlin.
390 Ibid.
certain level of staff turnover is good for Fraunhofer as well as German industry. For engineering graduates, the opportunity for landing jobs at top German technology collaborating with Fraunhofer is a major assure of joining the organization. Fraunhofer alumni at German companies also help provide the institutes with relationships for new business. German industry, meanwhile, gets a pipeline of talent in emerging technologies. The abundance of Fraunhofer engineers with experience in solar cell and module manufacturing helped Germany establish itself in that industry. “Part of the secret of the photovoltaic industry is that the workforce was present when this industry developed,” Dr. Schindler explained.391
On the other hand, Fraunhofer also needs experienced engineers and executives.
Institute directors coming from private industry general take steep pay cuts, but they can earn outside income as consultants. The institutes also offer some flexibility for researchers who want to try their hand at becoming entrepreneurs but are wary of completely abandoning the security of their Fraunhofer positions. Researchers can take leaves of absence to join a company. If they decide to return within two years, they can have their jobs back.392
One of Fraunhofer’s new strategic thrusts is to extend its brand overseas. Fraunhofer has opened a number of centers in the U.S. specializing in different fields. In Plymouth, Mich., Fraunhofer USA has a state-of-the-art center to develop laser technologies, components, and systems. It also has joined with Michigan State University to open a center for advanced coatings and laser technology applications. The Fraunhofer Center for Sustainable Energy Systems (CSE), based in Cambridge, Mass., is a non-profit applied research and development lab dedicated to commercializing clean energy technologies. Another center in Brookline, Mass., focuses on manufacturing innovation. A Fraunhofer center in Delaware focuses on molecular biotechnology. A center at the University of Maryland develops software.393 In these centers, Fraunhofer engineers work with nearby manufacturers to develop prototypes. It also evaluates company research projects and provides some funding. 394 Fraunhofer also recently opened a testing center for solar panels in Albuquerque, N. M., that it says will speed entry of North American manufacturers in the world market.395
Fraunhofer also is rolling out a program in the U.S. to help energy startups. Called TechBridge, the program aims to bridge the gap between
______________________
391 Schindler presentation, op. cit.
392 Hellwig, op. cit.
393 Details of Fraunhofer centers in the U.S. are found on the Fraunhofer USA Web site, http://www.fraunhofer.org/.
394 Schindler, op. cit.
395 Fraunhofer USA press release April 7, 2011.
laboratory research to wide-scale production without having to sacrifice intellectual property rights.396 It offers design and modeling expertise, equipment, and access to Fraunhofer facilities in Germany. Fraunhofer’s U.S. institutes earned $25 million in revenue in 2010 and expect to bring in $30 million in 2011.397 “I see a huge market for this kind of research in the United States,” Ms. Hellwig said.
Collaboration is a central element in public policy. Some 10 percent of R&D expenditures as of 2005 in Flanders involved industry partnerships with academia, compared to 6.9 percent in the EU and 6.3 percent in the U.S.398 Flanders has initiated a variety of new public-private partnership programs in recent years to promote collaboration further.399 They include regional innovation “cooperation networks,” centers for collective research that serve traditional industries, and “competency poles” that often are located near universities. Finland also has strategic research centers for microelectronics, biotechnology, energy and environment, and broadband technology.400 Each center has a mandate to work with the private sector, and is allowed to collaborate with foreign companies as long as they contribute to the Flemish economy. Chambers of commerce and labor unions also are involved in regional efforts.
Re-orienting higher education to add commercialization to its traditional functions of teaching and research has been another key thrust of Flemish policy. The region has seven universities, 22 non-university institutions of higher education, and five university-based institutes of higher education designed specifically to diffuse knowledge. The new emphasis on commercialization represents “a very big sea change” to centuries-old institutions, noted Free University of Brussels professor Bruno de Vuyst.401 A study by Van Looy and Koenraad Debackere found that technology-transfer activities do not detract from the amount or quality of basic scientific research. In fact, technology transfer tends to support publication of more research papers.
______________________
396 Fraunhofer USA Website, http://cse.fraunhofer.org/about/.
397 Hellwig, op. cit.
398 European Commission, Third European Report on Science and Technology Indicators 2003.
399 Flanders’ numerous innovation partnership programs are described in Vervliet, op. cit.
400 See the presentation by Peter Spyns of the Department of Economy, Science, and Innovation in Innovative Flanders, op. cit.
401 Presentation by Bruno de Vuyst of Free University of Belgium in Innovative Flanders.
Groups that collaborate reinforce their scientific research because industrial partners present academics with real problems. 402
To incentivize universities, the government provides block grants to institutions that strive to meet performance metrics such as increased numbers of spin-offs, patent applications, and contracts. “Performance-based funding is the key,” explained Fientje Moerman, former Minister for Economy, Enterprise, Science, Innovation, and Foreign Trade.403 To speed up the process, the Flemish Innovation Agency was set up in 1991. The agency acts as a “one-stop shop for innovation,” offering direct financing for technology-related R&D and coordinating other innovation efforts of the Flemish government. It also provides services for new business.
In 2003, the government drew up an Innovation Pact between academia and industry. The pact urged all parties to boost R&D investment to meet the EU target of 3 percent of GDP.404 After a study by the Flemish Science Policy Council two years later found that old barriers between academia and business remained, the government introduced two new innovative mechanisms. In 2004, it established an €11 million Industrial Research Fund to encourage universities to hire post-doctoral staff to conduct further research on findings deemed to have high potential for near-term market application. Each university creates its own portfolio of industry-oriented projects. The government also instructed each university to set up a technology-transfer office. The Flemish government introduced a program to place young academic researchers into industry and to support Ph. D. students wishing to launch their own companies.405
The Katholieke University Leuven, or K. U. Leuven, has an especially interesting system to encourage industry collaboration. The university’s 50 research divisions, which include faculty from different departments, can reinvest proceeds from industrial involvement into equipment, infrastructure, and stipends of post-doctoral students. The university also has 40 staff offering management, information-technology, and advisory help to start-ups. Leuven Inc., as it is called, has spun off more than 100 companies.406
To strengthen the flow of knowledge from universities to business, the Flanders government in 2006 launched a large €232 million program for strategic basic research of benefit to industry, the non-profit sector, and government policy objectives. The biggest investments in this program go to
______________________
402 Bart Van Looy, Koenraad Debackere et al, Research Policy, 2004. The researchers used data based on ISI-SCIE figures.
403 See remarks by Fientje Moerman, former Minister for Economy, Enterprise, Science, Innovation, and Foreign Trade, in Innovative Flanders.
404 This target challenges all EU nations to raise their total investment in research and development to 3 percent of GDP by 2010. According to the independent web portal EurActiv, however, this target is increasingly unlikely to be met (www.euractiv.com).
405 Moerman presentation, op. cit.
406 From presentation by Koenraad Debackere of K. U. Leuven in Innovative Flanders.
four high-level research institutes: Interuniversity Micro-Electronics Centers (IMEC), the Flemish Interuniversity Institute for Biotechnology (VIB), the Flemish Institute for Technological Research (VITO), and the Research Center for Broadband Technology (IBBT).
IMEC is the most globally prominent of these Flemish research organizations. Established in Leuven in 1984, IMEC is one of the largest semiconductor research partnerships in the world and strives to be a “worldwide center of excellence,” according to IMEC Chairman Anton de Proft.407 About half of IMEC’s revenue, which reached €275 million in 2009, comes from contracts with international industry. The Flemish government and the European Commission also are big contributors.408 IMEC has more than 1,750 staff and more than 550 resident and guest researchers from around the world.409
The center emphasizes pre-competitive R&D by bringing together researchers from industry and academia related to areas such as chip design, processing, packaging, microsystems, and nanotechnology that may not meet industry needs for three to 10 years.410 [See Table 5.3] As a result, IMEC enables its partners, who include Texas Instruments, ST Microelectronics, Infineon, Micron, Samsung, Panasonic, Taiwan Semiconductor Manufacturing, Intel, and a number of equipment makers to undertake risky research they may not do on their own. Given the high cost and long time horizons of chip research, partnerships like the one with IMEC are essential to sustaining the semiconductor industry, according to Allen Bowling of Texas Instruments.411 In August 2010, Intel announced it was investing in a new ExaScience Lab in Leuven with IMEC, the Agency for Innovation by Science and Technology, and five Flemish universities that aim to achieve breakthroughs in power-reduction software to run on future computers delivering 1,000 times the performance of today’s machines.412
Flanders’ biotech facility, the Interuniversity Institute for Biotechnology (VIB), has an equally ambitious mandate to translate research into innovative industry. Until VIB was founded, “we had a lot of activity, but no translation from the universities to the economic growth of Flanders,” explained Lieve Ongena, VIB’s senior science advisor. “VIB was given a compound mission designed to overcome that problem.”413 The €62 million institute, formed in 1995, invests in basic research, training of researchers, commercialization of discoveries, and explanation of science to the public.
______________________
407 From presentation by imec Chairman Anton de Proft in Innovative Flanders.
408 Vervliet, op. cit., p. 57.
409 Data: IMEC.
410 Mission Statement.
411 Presentation by Allen Bowling of Texas Instruments in Innovative Flanders.
412 Press release issued Aug. 6, 2010 (http://www2.imec.be/be_en/press/imecnews/flandersexasciencelab.html).
413 From presentation by Lieve Ongena of VIB in Innovative Flanders.
TABLE 5.3 IMEC—Major Areas of Research
|
• sub-22nm CMOS • Heterogeneous integration • Electronics for healthcare and life sciences • Wireless communication • Imaging systems • Organic electronics • Energy • Sensor systems for industrial applications |
VIB now has 60 research groups in nine departments, and 50/50 costand profit-sharing partnerships with its four universities. It focuses on work of “strategic importance,” such as cancer, cardiovascular biology, neurodegenerative disorders, inflammatory diseases, growth and development, proteomics, and bioinformatics. The VIB supports 850 scientists and technicians, of whom 300 are Ph. D candidates. It has helped launch companies that have developed microscopic worms for drug discovery, a drug-targeting tool using camel antibodies and another using a bacterium as a living drugdelivery tool. Start-ups had raised more than €220 million in venture capital as of 2006.
Another organization that partners with industry is the Flemish Institute for Technology Research, Belgium’s premier research center for energy, the environment, and materials.414 The Research Centre for Broadband Technology, established in 2004 as a “virtual” center to help Flanders become a leader in information and communications technology. Its mission is to develop multidisciplinary talent and perform demand-driven research for industry and government, with an emphasis on health care. Business partners include Philips, Siemens, and Alcatel. The center hopes to recoup its investment through licensing and spinoffs, in which IBBT typically retains a 5 percent interest. The institute’s goal is “to stimulate economic activity,” according to General Manager Wim de Waele.415
The government has a raft of programs in addition to these institutes to spur innovation and commercialization. One subsidizes industry-initiated cooperative ventures that aim to commercialize or add value to corporate research. Another supports economic networks that encourage innovation. The Flemish Innovation Cooperative Ventures program supports collective research,
______________________
414 Presentation by VITO Managing Director Dir Fransaer in Innovative Flanders.
415Presentation by IIBT General Manager Wim de Waele in Innovative Flanders.
technological services, and projects that foster innovation for particular issues or in sub-regions.
Flanders also has programs aimed at addressing an aversion to entrepreneurial risk on the part of the domestic financial sector and business community, which is regarded as a serious obstacle to innovation.416 The government created a program in 2001 called Arkimedes, which provides government guarantees and tax credits for investments in certain smalldenomination bonds. Money raised in the bond offerings goes into a “pool of pools” that is invested in several R&D funds. As with a venture capital fund, the risk is spread among a number of companies. The program is too young to draw conclusions about its effectiveness.417
One question about Flanders’ approach is whether its open attitude toward R&D generates enough domestic industrial activity. Although IMEC plays an important role in international semiconductor research, for example, there is debate over whether it is establishing a semiconductor cluster in Belgium, which was the center’s original mission in 1984. There have been at least 20 spinoffs from IMEC through 2002, noted Kenneth S. Flamm of the University of Texas at Austin, only a few related to devices, materials, or equipment manufacturing. None were major players in their sectors, Dr. Flamm said.418
IMEC Chairman de Proft noted while the economic impact so far is hard to measure directly, it is several times the level of government funding. He also said that the institute’s concentration of 300 top researchers and 200 Ph.D. students from around the world are likely to make an impact as they develop networks and rise through their organizations.419 Another indication of success, he noted, is that other nations have mimicked the public-private model of IMEC and other Flemish research institutions.
Despite its population of just 5.4 million, Finland has emerged as a global leader in innovation, consistently ranking the near top of the World Economic Forum’s annual Global Competitiveness Index.420 Finland has been
______________________
416 From remarks by Rudy Aernoudt, then Secretary-General of the Flemish Department of Economics, Science, and Bruno de Vuyst of the Free University of Brussels in Innovative Flanders.
417 See presentation by Rudy Aernoudt of the Department of Economic, Science, and Innovation in Innovative Flanders.
418 From presentation by Kenneth Flamm of University of Texas at Austin in National Research Council, 21st Century Innovation Systems for Japan and the United States: Report of a Symposium, Sadao Nagoka, Masuyuki Kondo, Kenneth Flamm, and Charles Wessner, editors, Washington, DC: The National Academies Press, 2009.
419 Presentation by de Proft, op. cit.
420 Finland ranked No. 3 in innovation and No. 4 in overall competitiveness in the World Economic Forum Global Competitiveness Index for 2011-12.
rated as Europe’s most innovative business environment.421 This has enabled the nation to restructure an economy that depended on pulp and paper for two-thirds of its exports in the 1960s to one dominated by electronics, most notably telecommunications equipment. Finland’s economy also has grown faster than the OECD average both before and after the 2008 recession.422
Much of the credit goes to far-sighted government technology policies initiated in the 1980s that focus both on scientific research and on disseminating new technologies to industry. As a result, a close “Triple Helix” relationship has developed among Finnish universities, private industry, and government funding agencies.423 In 1981, R&D accounted for around 1.2 percent of Finland’s GDP. R&D intensity increased significantly in the mid-1990s and by 2009 had risen to 4 percent of GDP, one of the highest levels in the world, before falling slightly to 3.9 percent in 2010.424 [See Figure 5.12] Private companies accounted for 70 percent of Finnish R&D spending in 2009, or €4.85billion.425 Between 1992 and 2008, Finland’s annual exports of high-tech products leapt more than five-fold, to €11.4 billion.426 But high-technology exports fell sharply in 2009 and 2010 as electronics and telecommunications products fell dramatically, primarily mobile phone sales. [See Figure 5.13] In addition to electronics and telecom equipment, Finland achieved dramatic export growth in energy technologies and chemicals.427
Finland’s innovation system is guided by the Science and Technology Council, which issues broad technology investment recommendations every three years that other ministries and agencies use as guidelines for setting funding priorities. The council is chaired by Finland’s prime minister and includes five cabinet ministers and representatives from industry, unions, and academia. There is a high degree of coordination between the Academy of Finland, which funds basic research, and Tekes, a Ministry of Trade and Industry agency that funds applied-research collaborations between the public and private sectors.
Finland’s high competitiveness rankings are attributable to the close link between national research programs and industry, according to Tekes Deputy Director General Heikki Kotilainen. Even though the government
______________________
421 The Lisbon Council & Allianz Dresdner Economic Research, “The Lisbon Review, 2008.”
422 Eurostat data and ETLA calculations.
423 See presentation by Heiki Kotilainen of Tekes in National Research Council, Comparative National Innovation Policies: Best Practice for the 21st Century, Charles W. Wessner, ed., Washington, DC: The National Academies Press, 2005.
424 Finnish Science and Technology Information Service and Statistics Finland, Research and Development 2010, October 27, 2011.
425 Ibid.
426 Eurostat and Statistics Finland data.
427 Data from Tekes. See http://www.tekes.fi/en/community/Statistics_and_comparisons/790/Statistics_and_comparisons/1740.
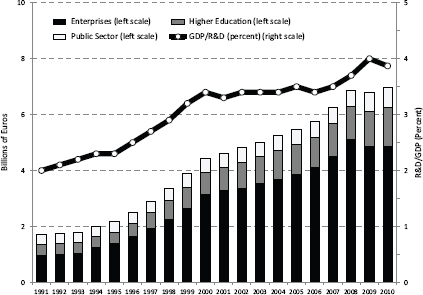
FIGURE 5.12 Finland’s R&D intensity reached 4 percent in 2009 before declining slightly to 3.9 percent in 2010.
SOURCE: Statistics Finland, Science and Technology Statistics, Accessed at <http://www.research.fi/en/resources/R_D_expenditure/R_D_expenditure_table>.
accounts for only 10 percent of total R&D spending, it has been essential to stimulating R&D investment by companies. “You cannot jump from pure science to innovation immediately,” Dr. Kotilainen said.428
Tekes estimates that government investments in research have yielded a return of around 20 times for the Finnish economy. In 2009, Tekes estimated its R&D investments contributed to more than 900 new products and services, the introduction of 328 production processes, 709 patent applications, and 775 academic theses.429 According to Tekes customer surveys, more than half of small and mid-sized companies and 60 percent of large companies said research projects completed in 2006 led to commercial success.430 Outcomes of collaborations with industry include Finnish companies that have developed lactose-free milk products, high-end computer monitors, recyclable bio composites that are used in everything from furniture to musical instruments,
______________________
428 Kotilainen presentation, op. cit.
429 Tekes data.
430 Tekes 2009 customer surveys.
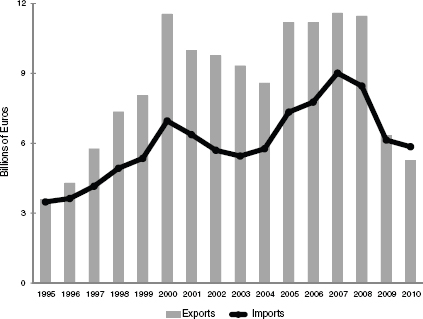
FIGURE 5.13 Finnish exports of high-technology products fell sharply in 2009 and 2010.
SOURCE: National Board of Customs, Finland, (Tullihallitus, Tilastoyksikkö), March 21, 2011.
equipment for recovering oil from offshore spills, and bio-carbon derived from wood and agro biomass that is said to be equal to high-quality coal as a fuel source.431
Tekes’ approach to R&D funding illustrates the Triple Helix method. Rather than act as a regulator and coordinator of Finnish innovation, the agency views itself as a partner, networker, and investor, Dr. Kotilainen explained. Of the €579 million Tekes invested in 2009, €343 million went directly to enterprises. Small and midsized companies received 61 percent of those funds, and 87 percent of those companies have fewer than 500 enterprises. Funding applications by Finnish companies leapt by 40 percent in 2009.432 Other funds
______________________
431 Examples of successful Tekes investments can be found on http://www.tekes.fi/en/community/Success%20stories/416/Success%20stories/666.
432 Data from Tekes Annual Review 2009 (http://www.tekes.fi/en/community/Annual%20review/341/Annual%20review/1289).
go to universities, national research universities, and early-stage financing for start-ups.
Whether the applicant is a university or private company, Tekes favors projects that involve cooperation between the two sectors. Private companies are required to provide matching funds when participating in university research. Companies receive credit if they invite universities to join their own research projects. Sometimes companies and universities pool their R&D personnel. Tekes tends to divide its funds between established R&D projects that can involve multiple companies and universities and unsolicited project proposals. The agency also promotes international collaborations.
Integration of basic and applied research is an important feature of Finland’s innovation system. Tekes and the Academy of Finland, for example, fund university and corporate-led programs simultaneously to help insure that basic research leads to technology development. Tekes also consults Finnish companies on their immediate and long-term needs. The goal is to make sure Tekes’ limited resources are invested in technology that companies can absorb and that is relevant to the economy. Current focus areas include information and communication technology, renewable energy, new materials, and health and wellbeing.
Several studies have found that Finland’s investments in R&D have had a significant impact. According to a 2006 study by the Research Institute of the Finnish Economy (ETLA), public subsidies by Tekes have improved productivity in small and medium-sized companies and in “companies near the frontier in productivity.”433 A study by Finland’s National Audit Office found that Tekes funding allowed companies to implement R&D projects more quickly and broadly. It is also found that 57 percent of projects in the study would not have been undertaken without support from Tekes.434
Among industrialized nations, Canada ranks very high in education and in living standards, boasting the second-highest per-capita income among G7 nations. Yet Canada is not among the leaders in most benchmarks of innovation, ranking 12th in the World Economic Forum’s latest Global Competitiveness Index.435 In part, this is due to low R&D spending by business, which has
______________________
433 Hannu Piekkola, “Knowledge and Innovation Subsidies as Engines of Growth—The Competitiveness of Finnish Regions,” Research Institute of the Finnish Economy (ETLA), Sarja B 216 Series, Helsinki: Taloustieto Oy, 2006.
434 Findings of the National Audit Office and other studies of Tekes’ performance can be found in Markus Koskenlinna, “Additionality and Tekes,” Impact Analysis, Nov. 25, 2003 (http://www.taftie.org/Files/PDF/MarkusKoskenlinna.pdf).
435 World Economic Forum, The Global Competitiveness Report 2011-2012, op. cit. Canada was 11th in the innovation ranking.
declined in inflation-adjusted terms since 2001.436 Canada’s BERD intensity is among the lowest of industrialized economies. [See Figure 5.14] Some analysts attribute this paradox to Canada’s abundant natural resources437 and close integration with the United States, which keep its industries at the technological forefront even though domestic companies spend relatively little on research and development. “In many, many sectors, there is one economy,” explained Peter J. Nicholson, president of the Council of Canadian Academies. “A great deal of technical sophistication in the Canadian economy is embodied in imported capital.”438
The Canadian government has promoted domestic innovation much more actively in the past decade. One reason is that resolution of serious government fiscal problems in the mid-1990s freed up public resources. Another was realization that innovation would have to propel a greater share of future growth. “If we wanted to have something that was home-grown and that could give us a degree of independence, we had to build our innovation capacity from the ground up,” Dr. Nicholson explained.439 Another source of motivation was alarm over slowing productivity growth, which lagged that of the U.S. After Canadian productivity reached 91.4 percent of the U.S. level in 1984, it fell steadily. By 2006, Canadian productivity was at 73.7 percent of the U.S. level, the lowest level since the 1950s.440 The International Institute for Management Development ranks Canada 24 among 33 advanced economies in productivity growth.441 A report by the Council of Canadian Academies concluded that “Canada has a serious productivity growth problem.”442 As a result, “economists are increasingly focusing on a lack of innovation in Canada as a contributor to poor productivity performance,” reported the Science and Technology and Innovation Council in its report State of the Nation 2010.443
______________________
436 Council of Canadian Academies, Innovation and Business Strategy: Why Canada Falls Short, Report by Expert Panel on Business Innovation, 2009. This report can be accessed at http://www.scienceadvice.ca/uploads/eng/assessments%20and%20publications%20and%20news%20releases/inno/(2009-06-11)%20innovation%20report.pdf.
437 Freedman shows that BERD intensity in Quebec and Ontario is much higher than in the other, more resource dependent provinces. Ron Freedman, “Re-Thinking Canada’s BERD Gap,” The Impact Group, January 2011.
438 See remarks by Peter J. Nicholson in Innovation Policies for the 21st Century, op. cit. At the time, Dr. Nicholson represented the Office of the Prime Minister.
439 Ibid.
440 Andrew Sharpe, “Lessons for Canada from the International Productivity Experience,” Centre for the Study of Living Standards, Research Report 2006-02, 2006.
441 IMD data cited in Science, Technology and Innovation Council, State of the Nation 2010, June 2011. This report can be accessed at http://www.stic-csti.ca/eic/site/stic-csti.nsf/eng/00043.html.
442 Council of Canadian Academies, op. cit.
443 Science, Technology and Innovation Council, State of the Nation 2010, op. cit.
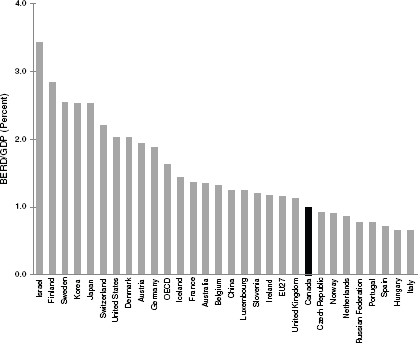
FIGURE 5.14 Canadian business R&D intensity is among the lowest of the industrialized countries.
SOURCE: OECD, Main Science and Technology Indicators Database, June 2011.
NOTE: Data refer to 2009 or most recent year available.
The nation’s education system gives Canada a strong base to build upon. Forty-six percent of Canadians aged 25 to 64 are post-secondary graduates, the highest rate among OECD nations.444 Canada spent 63 percent of GDP on higher education R&D as of 2007, by far the highest level among G7 nations.445 It also had the most citizens aged 25 to 64 with a tertiary education-49 percent.446 Canada has an extensive network of 24 national research institutes under the National Research Council, which employ 4,500 and hosts 1,200 guest researchers.
______________________
444 Human Resources and Skills Development Canada data.
445 OECD Science and Technology Indicators 2009.
446 OECD data.
The government’s approach to science and technology shifted significantly in the 1990s. Public funding for basic research rose sharply. R&D spending by Canadian universities and research hospitals nearly tripled between 1998 and 2004, to around $2.3 billion.447 There also was a healthy increase in “intramural” funding. Direct subsidies for industry were curtailed, and a model of sharing risk between the public and private sectors was adopted. 448 The government also established a number of programs to build world-class research institutions, encourage companies to invest more in R&D, and disseminate technology more widely through the economy. Canadian policies were in part influenced by studies of the experiences of such nations as Sweden and the United Kingdom and by the innovation system of the European Union.449
Canada introduced several institutions in the late 1990s to lead an innovation drive. The Canada Foundation for Innovation was established and given the mission of transforming research and technology development, fostering strategic research planning at universities, attracting and retaining world-class researchers, and promoting collaborative and cross-disciplinary research. The Department of Finance and the Department of Industry began to formulate an innovation framework for the country in 1998. The government also launched an initiative in the mid-1990s to establish a network of “centers of excellence” to create research partnerships in advanced technologies, engineering and manufacturing, life sciences, environmental technologies, and natural resources.
The national innovation strategy, presented in a 2001 report called Achieving Excellence, set ambitious benchmarks. The document called for Canada to rank among the world leaders in share of private-sector sales attributable to innovations, match the U.S. is per-capita venture-capital investment, improve recruitment of foreign talent, and increase graduate student admissions by 5 percent each year. To make the business environment more globally competitive, the strategy called for regulatory reform, lower taxes, and high-speed broadband that is widely accessible to Canadian communities. The document set a target of developing at least 10 internationally recognized technology clusters.450 Minister of Finance Paul Martin, who later became Prime Minister, announced a goal that Canada would move from No. 15 in the world in
______________________
447 Science, Technology, and Innovation Council of Canada, “State of the Nation, 2010.” Access at http://www.stic-csti.ca/eic/site/stic-csti.nsf/vwapj/10059_IC_SotN_Rapport_EN_WEB_INTERACTIVE.pdf/$FILE/10059_IC_SotN_Rapport_EN_WEB_INTERACTIVE.pdf.
448 Ibid.
449 For a good analysis of the evolution of Canadian innovation policy, see Thomas Liljemark, “Innovation Policy in Canada: Strategies and Realities,” Swedish Institute for Growth Policy Studies, A2004:24 (http://www.vinnova.se/upload/EPiStorePDF/InnovationPolicyInCanada.pdf).
450 Industry Canada, Achieving Excellence: Investing in People, Knowledge and Opportunity— Canada’s Innovation Strategy, 2001. (http://dsp-psd.pwgsc.gc.ca/Collection/C2-596-2001E.pdf).
government R&D spending as a percentage of GDP to No. 5 by 2010. That would require research investment to triple.
Canada has made especially strong progress in strengthening its infrastructure for basic research. Canada ranks No. 6 among OCED nations in scientific publications per capita and fifth in quality of publications.451 Much of the credit goes to measures launched in the mid-1990s. The Foundation for Innovation and the Canada Research Chairs program have had an especially broad impact. In 2007, the government unveiled a new science and technology strategy. It stated that Canada “must be connected to the global supply of ideas, talent, and technologies.” Among other things, the plan called for focusing on research relating to the environment, natural resources and energy, health, and information and communication technologies. It included an initiative called Knowledge Advantage to build on Canada’s research strengths to generate innovation and another called People Advantage aimed at developing and recruiting knowledge workers.452
The Foundation for Innovation, established in 1997, awards grants covering up to 40 percent of the cost of university R&D projects. The competitive application process led to a sharp improvement in the quality of research projects, according to Dr. Nicholson. The foundation also allocates funds to upgrade research facilities, spur international collaborations, and help first-time researchers. The foundation’s board includes some government appointees but operates independently.
As of September 2009, the foundation had committed nearly $5.2 billion to 6,300 projects at 130 research institutions across Canada. The program had attracted 8,050 new faculty members to Canadian universities, with nearly 3,200 from other nations. Forty-four percent of the 1,806 new researchers were recruited internationally, and nearly 80 percent of project leaders said the availability of foundation-funded infrastructure was important to their decision to join the institution. More than 21,000 post-doctoral fellows and graduate students used the infrastructure for their research, and the foundation had supported more than 1,600 collaborative research agreements. The foundation also was credited with creating nearly 4,700 jobs and at least 54 new companies. 453 A $61 million round of investments in 245 projects announced in January 2011 offers a flavor of the research that is supported. The projects include design of innovative molecules to treat breast cancer at the University of
______________________
451 Organization for Economic Co-operation and Development, OECD Science, Technology and Industry Outlook 2010: Country Profiles,
452 See Industry Canada, Mobilizing Science and Technology to Canada’s Advantage—2007, 2007 (http://www.ic.gc.ca/eic/site/ic1.nsf/vwapj/SandTstrategy.pdf/$file/SandTstrategy.pdf).
453 Canada Foundation for Innovation, 2009 Report on Results: An Analysis of Investments in Infrastructure (http://www.innovation.ca/docs/accountability/2009/2009%20Report%20on%20Results%20FINALEN.pdf).
Guelph, a project to improve understanding of the brain and spinal cord at Dalhousie University in Halifax, and monitoring of ecosystems in the Canadian Arctic at the Université du Québec à Rimouski.454
Canada Research Chairs complements the foundation by funding development of world-class research capacity at universities and a cadre of researchers. The program has a $300 million annual budget to recruit and retain top-flight academics. Since it began operation a decade ago, the program has established 2,000 chairs at degree-granting institutions. Thirty percent of the 1,845 chairs filled so far are occupied by academics recruited from outside Canada.455
Each degree-granting school receives allocations of chairs based on research grants they win in national competitions, with special consideration for small institutions. Universities nominate academics whose work complements their strategic research plans. Academics recognized by their peers as “world leaders” in their fields are paid $200,000 annually for seven years with indefinite renewal. “Exceptional emerging scholars” receive $100,000 for five years with one renewal. Together, the foundation and chairs program have “powerfully boosted Canada’s research capacity at the front end,” Dr. Nicholson said.456
To spur innovation among small businesses, Canada operates the Industrial Research Assistance Program (IRAP). The program, managed by the National Research Council, has a $281 million budget and employs 240 industrial technology advisors in 147 sites across the country. These advisors work with nearly 8,000 companies, dividing their time between consulting small businesses and supporting projects such as feasibility studies, pre-competitive R&D, hiring, and international sourcing. Seventy-five percent of advisors have masters or Ph. D. degrees, 45 percent had run their own R&D facilities, and 35 percent have been entrepreneurs. IRAP advisors improve business proposals and help connect small and midsized enterprises to national and global innovation networks. Help from the agency often gives small companies credibility in the financial community, making it easier to raise capital.457
IRAP also provides financial support to help small and midsized Canadian enterprises develop technologies for competitive advantage. The program provides up to $1 million a year to some 1,400 firms, 80 percent of which have fewer than 50 employees, with the average receiving around $100,000. Companies receiving funds typically contribute half of a project’s cost. Small contributions can be approved in as little as two weeks.
______________________
454 Canada Foundation for Innovation press release, Jan. 21, 2011.
455 Data: Canada Research Chairs Web site.
456 Nicholson presentation, op. cit.
457 National Research Council, “NRC-Industrial Research Assistance Program,” Power Point presentation, March 2010, (http://acamp.ca/alberta-micro-nano/images/docs-conventionalenergy/Finance/Generic%20IRAP%20PPT_FINAL%20ENG_March-2-2010.pdf).
In most cases, IRAP agrees to work with companies over time, rather than only provide one-time help for specific projects. IRAP charges companies for advisory services, but doesn’t break even. The help contributed to the Canadian economy, however, Dr. Nicholson explained. A 2007 evaluation of IRAP suggested that the approach of supporting development of firms is one reason behind its success. Sales of IRAP client firms averaged 28 percent growth in revenues and 30 percent growth in employment over the previous five years. For each 1 percent increase in IRAP contribution and advisory services, firms exhibited an 11 percent increase in sales, a 12 percent jump in productivity, a 13 percent rise in R&D spending, and a 14 percent increase in employment. The analysis found that the program contributed between $2.3 billion and $6.5 billion to the Canadian economy between 2002 and 2007, meaning that benefits equaled four to 12 times IRAP’s costs.458
Low business investment in R&D has received growing emphasis in recent years. The 2007 federal science and technology plan included a program called Entrepreneurial Advantage to translate knowledge into practical applications. The plan called for improving investment incentives and allowances for capital costs, establishing centers of excellence in commercialization and research, and expanding support for small and midsize companies.459
The Networks of Centers of Excellence program, meanwhile, has been broadened. In 2007, the government committed $46 million to fund large collaborative networks that support private-sector innovation headed by business consortia. Seventeen new Centers of Excellence for Commercialization and Research have opened since 2008 to promote stronger partnerships between researchers and industry.460 They include the Perimeter Institute for Theoretical Physics at the University of Waterloo, the Brain Research Centre at the University of British Columbia, and the National Optics Institute in Quebec City. To date, the Centers of Excellence program is credited with creating more than 100 spin-off companies and training 36,000 personnel. Each year, it generates more than 100 patents and leverages $71 million in added investment.461
Canada also has made generous use of tax credits to entice corporations to build R&D centers and advanced manufacturing facilities in Canada. Under the Scientific Research and Experimental Development incentive scheme, companies can get 30 percent rebates from the government on their R&D spending. The credits are awarded regardless of a company’s size, industry
______________________
458 National Research Council, “Impact Evaluation of the NRC Industrial Research Assistance Program (NRC-IRAP),” Executive Summary, 2008 (http://www.nrccnrc.gc.ca/eng/evaluation/evaluation-irap.html).
459 Mobilizing Science and Technology to Canada’s Advantage, op. cit.
460 Networks of Centres of Excellence Web site.
461 Ibid.
sector, or technology area. Companies can deduct the full cost of R&D machinery and equipment. Large Canadian and foreign corporations can claim 20 percent credits that can be used to offset federal taxes due within the next 20 years. An estimated $3.5 billion in benefits were awarded in 2009.462
Despite all of these programs, striking the right balance with public support of private companies has proved challenging in Canada. In 1996, a program called Technology Partnerships Canada, which had focused on the defense industry, began covering 25 to 30 percent of companies’ cost of industrial research, prototype development, and testing in other industries. Investments targeted “enabling” technologies such as biotech, materials, and information and communications technology. Companies were to repay the funds when they became profitable. As of 2006, only about 3 percent of funds invested by the Technology Partners had been repaid by companies. The program also was criticized for taking too long to approve projects.463 Technology Partnerships was discontinued in 2006 and absorbed into the Industrial Technologies Office, which no longer offers such subsidies.464
Challenges faced by the Technology Partners program offered some lessons regarding public investments. One is that it is difficult to design repayment terms that properly reflect risk and reward of a specific research project, Dr. Nicholson acknowledged. Technology Partners was criticized for taking too long to approve projects. The program’s broad objectives also made it difficult for Technology Partners to maintain a consistent approach. “That tends to invite a lot of objections from people who were disappointed,” Dr. Nicholson said. “Someone can always find a precedent and say, ‘but you approved that one, so what’s wrong with me?’” It also was sometimes hard to demonstrate a direct impact to the Canadian economy from public investments: Recipients of Technology Partners funds included companies like IBM and Pratt & Whitney that operate in a world of global supply chains.465
Business spending on R&D also continues to lag in Canada, falling in 2010 for the third year in a row, to $14.8 billion.466 Although business funding of university research has risen sharply since 2001,467 corporations still account for only about 50 percent of total R&D spending in Canada, one of the lowest among major economies. A 2009 survey of 6,233 Canadian enterprises in 67 industries found that only 18.8 percent said their strategic focus is to regularly
______________________
462 For details of how Canadian R&D tax credits work, see Foreign Affairs and International Trade Canada, “Invest in Canada: We Take Care of Business,” September 2010 (http://investincanada.gc.ca/download/142.pdf).
463 Nicholson presentation, op. cit.
464 Industrial Technologies Office Web site.
465 Nicholson, op. cit.
466 Statistics Canada at http://www40.statcan.ca/l01/cst01/econ151a-eng.htm, accessed November 1, 2011.
467 Science, Technology and Innovation Council, State of the Nation 2010, op. cit.
introduce new or significantly improved goods and services.468 The Science, Technology, and Innovation Council said in a 2008 report that R&D spending by Canadian firms is “falling behind our major competitors and the gap is growing.”469 Business R&D spending equaled around 1 percent of GDP in 2009, compared to a 1.6 percent average for OECD nations.470 [See Figure 5.14] Milway, executive director of the Institute for Competitiveness and Prosperity, recently remarked that this performance “is another bit of evidence that our businesses are not competing on the basis of innovation, value-added and sophistication.”471 Total R&D intensity in Canada has thus been trending downward for the past decade, to 1.81 percent of GDP in 2010. [See Figure 5.15]
There also are concerns that Canada is falling short of its goal of building a sufficient base of knowledge workers. A report by the Canadian Council on Learning in August 2010 said Canada lags in early childhood education. While science, math, and reading test scores still are relatively high in secondary school, other nations are advancing faster. 472 Canada ranks 20th among OECD nations in terms of natural science and engineering degrees as share of total degrees and 17th in the number of people in science and technology occupations.
Such challenges have not slowed Canada’s commitment to investing in the science and technology foundations of an innovation-led economy. It is early to pass judgment on Canada’s efforts to stimulate private investment in R&D, since many of the new programs were implemented just prior to the 2008-2009 recession, which forced companies to cut back. To address challenges in R&D investment and with the skilled workforce, the Canadian government also remains committed to expanding research collaborations with foreign companies and universities, to improving incentives to attract direct foreign investment, and to recruiting top talent.
______________________
468 Industry Canada, Foreign Affairs and International Trade Canada, and Statistics Canada, “Survey of Innovation and Business Strategy,” 2009. A summary of the survey’s findings can be found on the Industry Canada Web site at http://www.ic.gc.ca/eic/site/eas-aes.nsf/eng/h_ra02118.html.
469 Science, Technology, and Innovation Council, State of the Nation 2008 (http://www.sticcsti.ca/eic/site/stic-csti.nsf/eng/00019.html).
470 OCED, Main Science and Technology Indicators, 2010.
471 Rebecca Lindell, “Canadian R&D Spending Continues Downward Spiral: StatsCan,” Postmedia News, Dec. 8, 2010.
472 Canada Council on Learning, Taking Stock of Lifelong Learning in Canada (2005-2010): Progress or Complacency? Aug. 25, 2010.
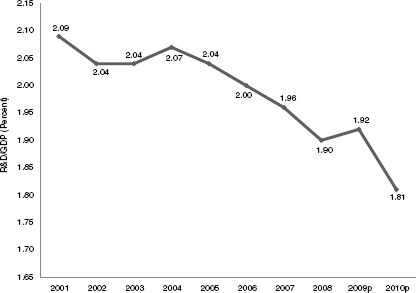
FIGURE 5.15 Canadian R&D intensity has been trending downward in the past decade.
SOURCE: Statistics Canada, CANSIM, tables 358-0001 and 380-0017 and Catalogue nos. 88-001-XIE and 88F0006XIE.
NOTE: Data for 2009 and 2010 are preliminary.
Japan has taken a number of actions since the mid-90s to improve its innovation system, many of them inspired by the United States.473 Japan has strengthened protection of intellectual property, overhauled science and technology policy institutions, enacted its own version of the Bayh-Dole Act to make it easier for universities and research laboratories to commercialize technology, and bolstered industry and academic science partnerships.474 Japan
______________________
473 A National Academy report recently concluded, however, that Japan has still not adequately addressed some longstanding weaknesses in its S&T system “which include immobility of personnel, inadequate entrepreneurialism, insufficient opportunity for younger researchers, and abiding problems with industry-university-government collaboration.” National Academy of Sciences, S&T Strategies of Six Countries, op. cit., p. 43.
474 See Sadao Nagaoka and Kenneth Flamm, “The Chrysanthemum Meets the Eagle— The Coevolution of Innovation Policies in Japan and the United States,” in National Research Council, 21st Century Innovation Systems for Japan and the United States: Lessons from a Decade of Change, Sadao Nagaoka, Masayuki Kondo, Kenneth Flamm, and Charles Wessner, Eds., Washington, DC: The National Academies Press, 2009.
also undertook a number of initiatives to increase entrepreneurialism, including a small-business loan program similar to America’s Small Business Innovation Research program.
To spur corporate R&D spending, Japan grants generous tax credits. Largely as a result, Japanese spending on research and development surged from 2.77 percent of GDP in 1994 to 3.8 percent in 2008 before declining slightly to 3.62 percent in 2009.475 [See Figure 5.16] Japanese companies account for threequarters of that spending, the highest ratio among OECD nations.476
Driving this change was the realization that innovation would be central to restoring growth to the Japan’s stagnating economy in the wake of the financial crash of 1990. Even though Japanese R&D investment and output of patents remained quite strong on world standards throughout the 1990s, Japanese companies stumbled as they tried to make the transition from products derived from well-developed technologies to the creation of more fundamental breakthroughs.477 Japan’s competitiveness in industries such as semiconductors and consumer electronics waned with the rise of new rivals in South Korea and Taiwan. Japan had largely missed out on the U.S.-led booms in biotechnology and software.478 Japan’s commercial scene, dominated by large conglomerates, was not producing many dynamic start-ups. The rapid pace of change ushered in by the information technology revolution and globalization did not play to the strengths of Japan’s large industrial conglomerates.
Japan’s policy shift began in earnest with passage of the Basic Law on Science and Technology in 1995.479 Under that plan, the government spent ¥17 trillion ($206 billion in current U.S. dollars) from 1996 through 2000 on science and technology programs. During the subsequent five-year basic plans, another ¥49 trillion were invested. These funding increases helped Japanese universities and national laboratories upgrade laboratories that had become outdated.480
______________________
475 Japanese Ministry of Internal Affairs and Communications, Statistics Bureau at http://www.stat.go.jp/english/data/kagaku/index.htm. Data refer to fiscal years.
476 OECD, OECD Science, Technology and Industry Scorecard 2011, Figure 2. 5.2.
477 Lee Branstetter and Yoshiaki Nakamura, “Is Japan’s Innovation Capacity in Decline?” National Bureau of Economic Research, Working Paper 9438, January 2003.
478 Some analysts attribute Japan’s decline as a leader in consumer electronics, characterized by innovative products such Sony’s Walkman audio devices, to increased importance of embedded software, an industry dominated by U.S. companies, rather than hardware design. See Ashish Arora, Lee G. Branstetter, and Matej Drev, “Going Soft: How the Rise of Software-Based Innovation Led to the Decline of Japan’s IT Industry and the Resurgence of Silicon Valley,” National Bureau of Economic Research, Working Paper 16156, July 2010.
479 For an unofficial translation of the Science and Technology Basic Law (Law No. 130 of 1995) see http://www.mext.go.jp/english/kagaku/scienc04.htm.
480 National Science Foundation, “The S&T Resources of Japan; A Comparison with the United States,” Access at http://www.nsf.gov/statistics/nsf97324/intro.htm.
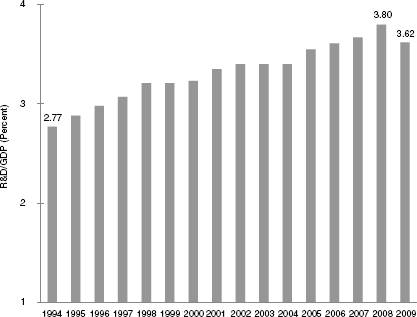
FIGURE 5.16 Japanese R&D intensity peaked at 3.8 percent of GDP in FY2008 before declining slightly in FY2009.
SOURCE: Japan Ministry of Internal Affairs and Communications, Statistics Bureau, Accessed at <http://www.stat.go.jp/english/data/kagaku/index.htm>.
NOTE: Data refer to fiscal years.
Japan also strengthened national coordination of its innovation strategy. The Council for Science and Technology Policy, established in 2001, became part of the Prime Minister’s Cabinet. The council drafts comprehensive science and technology policies to respond to national and social needs, advises on how to allocate resources, and evaluates major projects. Funding focused on life sciences, nanotechnologies and new materials, information and communication, and environmental technologies.481
The government did not, however, assume greater central control over research. To the contrary, in 2004 it gave national universities and research institutes more autonomy to allocate resources, collaborate with industry, and set
______________________
481 For an extensive discussion of changes in Japanese innovation policies, see Akira Goto and Kazuyuki Motohashi, “Technology Policies in Japan: 1990 to the Present,” in 21st Century Innovation Systems for Japan and the United States.
their own research priorities by separating them from the civil-service system. These institutions were transformed into non-profit corporations. Because they account for the bulk of scientific and technological research, the independence given universities and national labs is expected to allow resources to be used more flexibly and efficiently. In another crucial institutional reform, government agencies have begun to allocate much greater shares of R&D funds on the basis of peer-reviewed competition.482
The greater focus on innovation has led to dramatic increases in scientific research in strategic areas.483 In 1992, the government set a goal of tripling investment in life sciences over the next decade. By 2001, the number of biotech companies had risen from a few dozen to 250; the goal was to have 1,000 biotech companies by 2010. In nanotech, Japan was spending almost as much on research as the United States—$940 million—as of 2004. Fuel cells, an important technology not only for portable electronic devices but also for future electrified vehicles, also received heavy emphasis.
Robotics is another top Japanese research priority. The government is especially interested in developing technologies used in core components that can be applied across the industry, such as power sources, control systems, mechanics, software, and structures. Two of Japan’s biggest investments in science were the $1 billion Spring-8, one of the world’s largest synchrotron radiation facilities, and the Earth Simulator, a $450 million scientific computer billed as the world’s fastest when it opened in 2003.
Japan also has resuscitated R&D consortia, a key element of industrial policy until the 1980s. The government cut funds for consortia in areas like semiconductors following trade friction with the U.S., but began to renew such programs after Sematech started to benefit U.S. producers and Japanese chipmakers’ fortunes declined.484
Strengthening University-Industry Partnerships
Japan has moved to strengthen universities’ collaboration with industry. In 1999, Japan enacted a law that gave universities and research institutes the ability to patent investments derived from publicly funded research, similar to the Bayh-Dole Act of 1980. Since then, these institutions have established technology-transfer organizations. The government also helped universities set up Collaborative Research Centers that compete for government grants for joint
______________________
482 A concise analysis of Japan’s shift in innovation policy is found in National Research Council, S&T Strategies of Six Countries: Implications for the United States, Committee on Global Science and Technology Strategies and Their Effect on U.S. National Security, Washington, DC: The National Academies Press, 2010.
483 See presentation by David K. Kahaner of the Asian Technology Information Program in Innovation Policies for the 21st Century, op. cit.
484Nagaoka and Flamm, op. cit.
university-industry research, small-business incubators, and a network of 45 Venturing Business Laboratories, which help young researchers commercialize their work. In addition, the government relaxed rules that had barred university faculty from serving on the boards of private companies.
These efforts led to significant results. University-industry research collaborations surged from around 1,500 in 1995 to more than 6,000 in 2003. Companies spun out of universities increased to around 150 a year as of 2003, nearly half of them in life sciences and information and communication technologies.485
While it is too early to assess the full impact of Japan’s reforms, there have been noticeable improvements. The World Economic Forum ranks Japan 9th overall in its most recent Global Competitiveness Index and 4th in innovation.486 Patent applications by universities and technology-licensing offices increased from 641 in 2001 to 8,527 in 2005, a comparable level to the United States. University-industry joint research projects jumped from less than 1,500 annually in 1995 to more than 10,000 in 2005. Spinoffs from Japanese universities also rose sharply.487 And overall, Japanese patent applications have been increasing in recent years. [See Figure 5.17]
Such data suggest that university-industry partnerships have become “important for science-based innovation in Japan,” said Masayuki Kondo of Japan’s National Institute of Science and Technology. “They narrow the gap between Japanese high science and technology potential and low industrial performance to help strengthen the innovation capability of Japanese industry.” However, Mr. Kondo said, Japanese universities bring in only a fraction of the licensing revenues of American universities. Only a handful of Japanese spinoffs so far have gone public.488
Stronger protection of intellectual property rights has improved Japan’s innovation system since the early 1990s. Initially, the Japanese government responded to pressure from the U.S. to strengthen enforcement of violations. The World Trade Organization’s Trade-Related Aspects of Intellectual Property Rights (TRIPs) agreement in 1995 also had a major impact. The government enacted a series of other reforms since then, including the Basic Law on Intellectual Property in 2003 and establishment of the Intellectual Property High Court in 2005, which is modeled after the U.S. Court of Appeals of the Federal Circuit. Criminal sanctions have been raised, and the scope of invention that is patentable has been greatly broadened.489
______________________
485 Presentation by Masayuki Kondo of Japan’s National Institute of Science and Technology Policy in 21st Century Innovation Systems for Japan and the United States.
486 World Economic Forum, The Global Competitiveness Report 2011-2012, op. cit.
487 Presentation by Masayuki Kondo, op. cit.
488 Ibid.
489 See presentation by Sadao Nagaoka of Hitotsubashi University in 21st Century Innovation Systems for Japan and the United States.
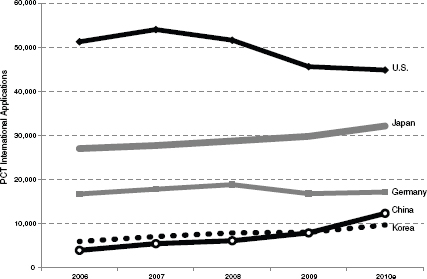
FIGURE 5.17 Japanese patent applications have been increasing in recent years.
SOURCE: WIPO, “International Patent Filings Recover in 2010,” February 2, 2011, PR/2011/678.
NOTE: 2010 data are estimated.
IPR protection in Japan is now widely recognized to be very high. According to Business Software Alliance, Japan has the third-best record of enforcement following the U.S. and New Zealand. Patent-infringement claims have increased sharply. The overall impact on Japanese innovation is more difficult to assess because there are concerns that the IPR system’s complexity and overburdened judiciary may hinder the ability of companies to commercialize technologies efficiently and raise transaction costs.490
Rediscovering Small Companies
Small business played a big role during Japan’s post-war economic takeoff. But starting in the 1970s, new company formation began to fall to the point where entrepreneurship was perceived as stagnant, explained Takehiko Yasuda of Japan’s Research Institute of Economy, Trade, and Industry. One reason was that Japanese policy tended to protect small enterprises from large
______________________
490 Ibid.
firms, rather than see them as sources of innovation and job creation.491 Policymakers also viewed large corporations as bigger contributors of wage and labor productivity. By the 1990s, however, the government recognized that startups were providing major stimulus to the economies of the U.S. and England.492
The government began introducing policies to encourage more startups in 1999. It enacted the Small and Medium Enterprise Basic Law to promote their growth. Two years later, the government launched the Start-up Doubling Plan, which set a goal of increasing the number of start-ups from 180,000 in 2001 to 360,000 in five years. Japan removed minimum capital requirements for new limited-liability companies, established the National Startup and Venture Forum to educate entrepreneurs, reformed the bankruptcy code, and launched a start-up loan program through the government-owned National Life Finance Corporation. The loans required no collateral, guarantors, or personal guarantees. In 2008, this unit was folded into the Japan Finance Corporation, whose small- and medium-sized business unit provided ¥20 trillion in support in 2009.493
Japan also established its own Small Business Innovation Research program, modeled after the one run by the U.S. Department of Commerce. The program aims to enhance the ability of small and midsized enterprises to develop technology and innovative products. As with the U.S. SBIR program, Japanese agencies that make research grants set aside a certain portion of their funds for small and midsized enterprises.
Removing the minimum capital requirement of ¥10 million for jointstock companies in 2004 had an immediate impact. Between Feb. 1, 2004, and Jan. 21, 2006, there were 24,639 confirmed applications with 20,211 notification completions. Based on the success of this policy, the Japanese government enacted the Corporate Law in 2005 to remove the minimum capital requirement for establishing firms in general, which is consistent with the U.S. joint-stock corporation policy.
Remaining Challenges for Start-Ups
One of Japan’s most pressing challenges is to create new companies. A 1997 survey by Japan’s Ministry of Public Management, Home Affairs, Post and Telecommunications found that only one in 50 employed people aspired to become entrepreneurs, a very low level on world standards, and that only half of them were actually preparing to become self-employed.494 The environment has
______________________
491 S&T Policies in Six Nations, op. cit.
492 See presentation by Takehiko Yasuda of the Research Institute of Economy, Trade, and Industry in 21st Century Innovation Systems for Japan and the United States.
493 Japan Finance Corporation Web site.
494 Employment Status Survey by the Ministry of Public Management, Home Affairs, Post and Telecommunications, 1997.
not improved dramatically since then. Of 59 nations studied by the Global Entrepreneurship Monitor, Japan ranks second to the bottom, behind only Italy, in entrepreneurial activity.495
A lack of capital is a major reason. A survey of start-ups found that 49 percent of Japanese entrepreneurs reported that “procuring funds for entry” is a major problem, well ahead of finding customers and hiring high-quality employees.496 To remedy this problem, the National Life Finance Corporation set up a new program to lend up to ¥10 million to start-ups without requiring collateral, guarantors, or personal guarantees. Between 2002 and 2006, the number of recipients rose from 2,975 to 7,942.497
Some Early Progress
Japan’s new innovation system has begun to change the dynamics of the national economy. Patenting and technology transfer from Japan’s top public research institutes have increased sharply. That system is still evolving, however, and inefficiencies remain. America’s National Institutes of Health, for example, coordinates all government-funded biomedical research. In Japan, similar activity is dispersed among many funding agencies that do not share information on researchers, according to a 2006 analysis by Yosuke Oka, Kenta Nakamura, and Akira Tohei.498 Nor are there guiding principles of peer review across agencies. “This could explain why a small number of star scientists receive a large share of research funds from multiple funding agencies,” the authors noted. Government research funding also tends to flow to a handful of top schools. The top 10 universities garner half of research grants in Japan.499
Even though patent filings increased, technology transfer from Japanese research universities was not impressive when measured licensing revenue, according to Dr. Oka, Dr. Nakamura, and Dr. Tohei. Among other things, they attributed the poor performance to rudimentary technology-transfer contract practices and overly restrictive rules on using research funds. University researchers prefer “informal collaborations” to get around red tape. What’s more, despite relaxed rules allowing academics to work in the private sector, most university researchers remain at their jobs rather than circulate
______________________
495 Donna J. Kelley, Niels Bosma, Jóse Ernesto Amorós, “Global Entrepreneurship Monitor 2010 Global Report,” Global Entrepreneurship Research Association, 2011, pg. 23.
496 Applied Research Inc., “Survey of Environment for Start-ups,” November 2006.
497 Data cited in Yasuda presentation, op. cit. For an explanation of the National Life Finance Corporation program, see Jun-ichi Abe, “Small Business Finance & Support for Startups in Japan (Case of NLFC),” National Life Finance Corporation, December 2004 (http://www.afdc.org.cn/upload/18/downloads/JUN-ICHI%20ABE.pdf).
498 Yosuke Oka, Kenta Nakamura, and Akira Tohei, “Public-Private Linkage in Biomedical Research in Japan: Lessons of the 1990s,” in 21st Century Innovation Systems for Japan and the United States.
499 Ibid.
through industry. Sadao Nagaoka and Kenneth Flamm suggest that Japan still may lack the complementary institutions needed to make U.S.-style industryuniversity partnerships more effective, such as infrastructure for supporting high-tech startups, availability of risk capital, and professional services.500
A number of reforms have been proposed in Japan to address many of these shortcomings. While it is too early to measure progress, the changes implemented over the past decade in Japan’s innovation ecosystem have provided a much stronger institutional framework for success in the 21st century global knowledge economy.
______________________
500 Nagaoka and Flamm, op. cit.


