
The U.S. Nuclear Regulatory Commission (USNRC) requested that the National Academy of Sciences (NAS) provide an assessment of cancer risks in populations near USNRC-licensed nuclear facilities. This assessment is being carried out in two consecutive phases. The focus of the Phase 1 scoping study, which is the subject of this report, is to identify scientifically sound approaches for carrying out an assessment of cancer risks. The results of this Phase 1 study will be used to inform the design of the assessment, which will be carried out in Phase 2. The complete study task is shown in Sidebar 1.1.
The USNRC-licensed nuclear facilities referred to in the statement of task are nuclear power reactors and nuclear fuel-cycle facilities that utilize uranium for the production of electricity.1 These facilities are described in Sidebar 1.2. A large number of nuclear facilities have been constructed in the United States during the past six decades. Presently licensed USNRC facilities include:
- 104 operating nuclear reactors (35 boiling water reactors and 69 pressurized water reactors) at 65 sites in 31 states (Table 1.1).
- 13 fuel-cycle facilities in operation in 10 states. The operating facilities include four in situ uranium recovery facilities, one conventional uranium mill,2 one conversion facility, two uranium enrichment facilities, and five fuel fabrication facilities. There are
SIDEBAR 1.1
Statement of Task
The National Academies will provide an assessment of cancer risks in populations living near U.S. Nuclear Regulatory Commission-licensed nuclear facilities. This assessment will be carried out in two consecutive phases:
A Phase 1 scoping study will identify scientifically sound approaches for carrying out the cancer epidemiology study that has been requested by the U.S. Nuclear Regulatory Commission. It will address the following tasks:
1. Methodological approaches for assessing off-site radiation dose, including consideration of:
• Pathways, receptors, and source terms
• Availability, completeness, and quality of information on gaseous and liquid radioactive releases and direct radiation exposure from nuclear facilities
• Approaches for overcoming potential methodological limitations arising from the variability in radioactive releases over time and other confounding factors
• Approaches for characterizing and communicating uncertainties.
2. Methodological approaches for assessing cancer epidemiology, including consideration of:
• Characteristics of the study populations (e.g., socioeconomic factors, all age groups, children only, and nuclear facility workers)
• Geographic areas to use in the study (e.g., county, zip codes, census tracts, or annular rings around the facility at some nominal distances)
• Cancer types and health outcomes of morbidity and mortality
• Availability, completeness, and quality of cancer incidence and mortality data
• Different epidemiological study designs and statistical assessment methods (e.g., ecologic or case-control study designs)
• Approaches for overcoming potential methodological limitations arising from low statistical power, random clustering, changes in population characteristics over time, and other confounding factors
• Approaches for characterizing and communicating uncertainties.
The results of this Phase 1 scoping study will be used to inform the design of the cancer risk assessment, which will be carried out in Phase 2.
additional state-licensed3 conventional uranium milling facilities and in situ leaching facilities that are not shown on Table 1.2.4
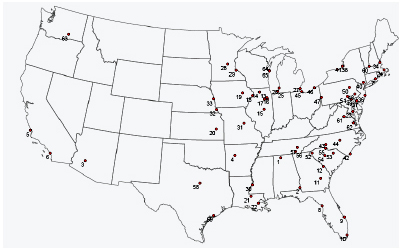
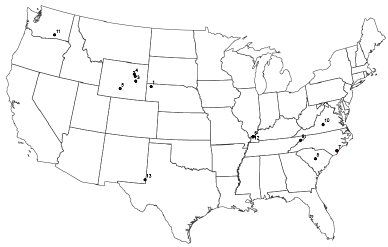
Figures 1.1a and 1.1b show the locations of currently operating nuclear plants and USNRC-licensed fuel-cycle facilities in the United States. Applications for 24 additional nuclear reactors were under active review by the USNRC while the present study was in progress.5
1.1 BACKGROUND ON THE STUDY REQUEST
In the late 1980s, the National Cancer Institute (NCI) initiated an investigation of cancer risks in populations near 52 commercial nuclear power plants and 10 Department of Energy nuclear facilities (including research and nuclear weapons production facilities and one reprocessing plant) in the United States (Jablon et al., 1990). The investigation compared cancer mortality rates in “study” counties (i.e., counties that contained nuclear facilities) with rates in “control” counties (i.e., counties that were similar to the study counties in terms of population size, income, education, and other socioeconomic factors but did not contain nuclear facilities). The NCI investigation also compared cancer registration (i.e., cancer incidence) rates in study and control counties in two states: Connecticut and Iowa. No differences in cancer mortality or incidence rates were observed between study and control counties. The authors of the study concluded that “if nuclear facilities posed a risk to neighboring populations, the risk was too small to be detected by a survey such as this one” (Jablon et al., 1991).
The USNRC has been using the results of this NCI investigation as a primary resource for communicating with the public about cancer risks near the nuclear facilities that it regulates. However, this study is now over 20 years old. There have been substantial demographic shifts in populations around some of these facilities, and the facility inventory itself has changed; some facilities have shut down and new facilities have started up. Additionally, at least one facility that was not included in the NCI investigation (Nuclear Fuel Services in Tennessee) has become a focus of public interest.
The NCI investigation had several limitations: The investigation utilized county-level mortality and, when available, incidence data. The use
3 Section 274 of the Atomic Energy Act of 1954 authorizes the USNRC to enter into agree ments with state governors to discontinue the Commission’s regulatory authority for byproduct materials (radioisotopes), source materials (uranium and thorium), and certain quantities of special nuclear materials. States that have assumed regulatory authority for these materials are referred to as agreement states.
4 A listing of these facilities as of 2010 can be found at http://www.eia.gov/uranium/production/annual/.
5 See http://www.nrc.gov/reactors/new-reactors/col/new-reactor-map.html.
SIDEBAR 1.2
Nuclear Fuel Cycle
The nuclear fuel cycle comprises a set of industrial processes for producing electricity from uranium. These processes are carried out in nuclear fuel-cycle facilities, as illustrated in Figure S.1. Facilities comprising the front end of the nuclear fuel cycle are involved in the extraction of uranium from the environment and its fabrication into fuel for nuclear reactors. The uranium fuel is utilized in nuclear power reactors to produce electricity. Modern reactors typically generate on the order of 3000 megawatts of thermal power and produce about 1000 megawatts of electrical power. Facilities comprising the back end of the nuclear fuel cycle are involved in managing this fuel after it has been utilized in reactors; fuel management activities can involve recycling, storage, and/or disposal. The only civilian back-end facilities currently in operation in the United States are interim storage facilities for managing used fuel, most of which are located at commercial nuclear power plants. In the United States, almost all of these fuel storage facilities are co-located with nuclear plants.
The USNRC regulates five types of front-end fuel-cycle facilities:
Mining facilities: Facilities that are used to extract uranium from the environment. Currently, uranium is extracted using either conventional mining or leaching methods. The former method involves the physical removal of uranium-bearing ores from the subsurface in underground and open-pit mines. The latter method includes in situ leaching, in which solutions are pumped into the subsurface to extract uranium, and heap leaching, in which solutions are sprayed onto piles of mined rock to extract uranium. This study is concerned only with in situ leaching facilities. (The USNRC did not ask the NAS to examine conventional mining facilities because these facilities are not regulated by that agency.)
Milling facilities: Facilities that are used to process uranium ore or leach solutions to produce uranium oxide (U3O8) powder, or yellowcake. Mills can be standalone facilities, or they can be integrated into a uranium extraction operation. The former type of facility is used for conventional mining operations, where a single mill can service several mines, whereas the latter type of facility is used for in situ leaching operations.
Conversion facilities: Facilities that are used to convert yellowcake into a solid hexafluoride form (uranium hexafluoride, UF6). This compound sublimes to form a gas at about 56°C at standard atmospheric pressures. The gaseous form of this material is used in subsequent processing steps.
Enrichment facilities: Facilities that are used to increase the concentration of
of countywide data made it difficult to discern local effects around nuclear facilities, especially in geographically extensive counties. The investigation also focused primarily on cancer mortality, because good-quality cancer incidence data were largely unavailable at the time the study was conducted. (Incidence may be a better indicator of risk than mortality because advances in cancer treatments have lowered mortality rates for many types of cancer, including leukemia.)
uranium-235 in uranium hexafluoride. Almost all natural uranium contains about 99.3 percent uranium-238 and about 0.7 percent uranium-235 by mass. Enrichment increases the mass percentage of uranium-235, the fissile (i.e., the component of the nuclear fuel that can be induced to fission with thermal [low-energy] neutrons) component of nuclear fuel, to between about 4 and 5 percent. In the United States, uranium enrichment is currently being carried out in gaseous diffusion and centrifuge plants. New plants that use laser enrichment technologies are under construction.
Fuel fabrication facilities: Facilities that are used to convert enriched uranium hexafluoride into a uranium dioxide (U02) solid and fabricate it into nuclear fuel for civilian reactors.
Some of the fuel facilities being considered in this study have had or currently have dual civilian and defense missions. Prior to the USNRC assuming regulatory control, some of these facilities were previously regulated by the U.S. Department of Energy and its predecessor agencies.
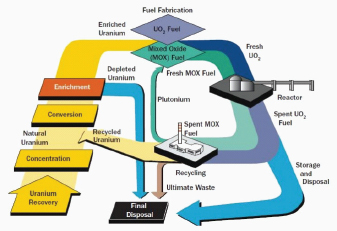
FIGURE S.1 Schematic depiction of the nuclear fuel cycle. SOURCE: USNRC.
The NCI investigation also did not attempt to estimate radiation exposures resulting from the operation of nuclear facilities. However, NCI investigators noted that such exposures are likely to be “too small to result in detectable harm” (Jablon et al., 1991, p. 1407). Absent reliable information about radiation exposures, it is difficult to provide scientifically supportable explanations for any observed associations between a nuclear facility and cancer incidence or mortality.
TABLE 1.1 Civilian Nuclear Power Plants in the United States
| State | Number of Active Reactors in State | Name of Nuclear Power Plant (USNRC-abbreviated plant names) | Reactor Unit | Operating License Issue Date | Shutdown Date |
| Alabama | 5 | Browns Ferry Nuclear Plant (Browns Ferry) | 1 2 3 | 1973 1974 1976 | |
| Joseph M. Farley Nuclear Plant (Farley) | 1 2 | 1977 1981 | |||
| Arizona | 3 | Palo Verde Nuclear Generating Station (Palo Verde) | 1 2 3 | 1985 1986 1987 | |
| Arkansas | 2 | Arkansas Nuclear One (Arkansas Nuclear) | 1 2 | 1974 1978 | |
| California | 4 | Diablo Canyon Power Plant (Diablo Canyon) | 1 2 | 1984 1985 | |
| San Onofre Nuclear Generating Station (San Onofre) | 1 2 3 | 1967 1982 1982 | 1992 | ||
| Humboldt Bay Nuclear Power Plant (Humboldt Bay) | 3 | 1963 | 1976 | ||
| Rancho Seco Nuclear Generating Station (Rancho Seco) | 1974 | 1989 | |||
| Colorado | 1 | Fort Saint Vrain Generating Station (Fort Saint Vrain) | 1973 | 1989 | |
| Connecticut | 2 | Millstone Power Station (Millstone) | 1 2 3 | 1970 1975 1986 | 1998 |
| Haddam Neck (Connecticut Yankee) | 1968 | 1996 | |||
| Florida | 5 | Crystal River Nuclear Generating Plant (Crystal River) | 3 | 1976 | |
| St. Lucie Plant (St. Lucie) | 1 2 | 1976 1986 | |||
| Turkey Point Nuclear Plant (Turkey Point) | 3 4 | 1972 1973 | |||
| Georgia | 4 | Edwin I. Hatch Nuclear Plant (Edwin I. Hatch) | 1 2 | 1974 1978 | |
| Vogtle Electric Generating Plant (Vogtle) | 1 2 | 1987 1989 | |||
| State | Number of Active Reactors in State | Name of Nuclear Power Plant (USNRC-abbreviated plant names) | Reactor Unit | Operating License Issue Date | Shutdown Date |
| Illinois | 11 | Braidwood Station (Braidwood) | 1 2 | 1987 1988 | |
| Byron Station (Byron) | 1 2 | 1985 1987 | |||
| Clinton Power Station (Clinton) | 1 | 1987 | |||
| Dresden Nuclear Power Station (Dresden) | 1 2 3 | 1959 1969 1971 | 1978 | ||
| LaSalle County Station (LaSalle) | 1 2 | 1982 1983 | |||
| Quad Cities Nuclear Power Station (Quad Cities) | 1 2 | 1972 1972 | |||
| Zion Nuclear Power Station (Zion) | 1 2 | 1973 1973 | 1997 1996 | ||
| Iowa | 1 | Duane Arnold Energy Center (Duane Arnold) | 1974 | ||
| Kansas | 1 | Wolf Creek Generating Station (Wolf Creek) | 1 | 1985 | |
| Louisiana | 2 | River Bend Station (River Bend) | 1 | 1985 | |
| Waterford Steam Electric Station (Waterford) | 3 | 1985 | |||
| Maine | 0 | Maine Yankee Nuclear Power Plant (Maine Yankee) | 1972 | 1996 | |
| Maryland | 2 | Calvert Cliffs Nuclear Power Plant (Calvert Cliffs) | 1 2 | 1974 1976 | |
| Massachusetts | 1 | Pilgrim Nuclear Power Station (Pilgrim) | 1972 | ||
| Yankee Rowe Nuclear Power Station (Yankee-Rowe) | 1961 | 1991 | |||
| State | Number of Active Reactors in State | Name of Nuclear Power Plant (USNRC-abbreviated plant names) | Reactor Unit | Operating License Issue Date | Shutdown Date |
| Michigan | 4 | Donald C. Cook Nuclear Plant (Cook) | 1 2 | 1974 1977 | |
| Palisades Nuclear Plant (Palisades) | 1971 | ||||
| Fermi | 1 2 | 1966 1985 | 1992 | ||
| Big Rock Point Nuclear Plant (Big Rock Point) | 1962 | 1997 | |||
| Minnesota | 3 | Monticello Nuclear Generating Plant (Monticello) | 1 | 1970 | |
| Prairie Island Nuclear Generating Plant (Prairie Island) | 1 2 | 1974 1974 | |||
| Mississippi | 1 | Grand Gulf Nuclear Station (Grand Gulf) | 1 | 1984 | |
| Missouri | 1 | Callaway Plant (Callaway) | 1 | 1984 | |
| Nebraska | 2 | Cooper Nuclear Station (Cooper) | 1974 | ||
| Fort Calhoun Station (Fort Calhoun) | 1 | 1973 | |||
| New Hampshire | 1 | Seabrook Station (Seabrook) | 1 | 1990 | |
| New Jersey | 4 | Hope Creek Generating Station (Hope Creek) | 1 | 1986 | |
| Oyster Creek Nuclear Generating Station (Oyster Creek) | 1969 | ||||
| Salem Nuclear Generating Station (Salem) | 1 2 | 1976 1981 | |||
| State | Number of Active Reactors in State | Name of Nuclear Power Plant (USNRC-abbreviated plant names) | Reactor Unit | Operating License Issue Date | Shutdown Date |
| New York | 6 | James A. FitzPatrick Nuclear Power Plant (FitzPatrick) | 1974 | ||
| R. E. Ginna Nuclear Power Plant (Ginna) | 1969 | ||||
| Indian Point Nuclear Generating (Indian Point) | 1 2 3 | 1962 1973 1975 | 1974 | ||
| Nine Mile Point Nuclear Station (Nine Mile Point) | 1 2 | 1969 1987 | |||
| Shoreham Nuclear Power Station (Shoreham) | 1989 | 1992 | |||
| North Carolina | 5 | Brunswick Steam Electric Plant (Brunswick) | 1 2 | 1976 1974 | |
| McGuire Nuclear Station (McGuire) | 1 2 | 1981 1983 | |||
| Shearon Harris Nuclear Power Plant (Harris) | 1 | 1986 | |||
| Ohio | 2 | Davis-Besse Nuclear Power Station (Davis-Besse) | 1 | 1977 | |
| Perry Nuclear Power Plant (Perry) | 1 | 1986 | |||
| Oregon | 0 | Trojan Nuclear Power Plant (Trojan) | 1 | 1976 | 1992 |
| Pennsylvania | 9 | Beaver Valley Power Station (Beaver Valley) | 1 2 | 1976 1987 | |
| Limerick Generating Station (Limerick) | 1 2 | 1985 1989 | |||
| Peach Bottom Atomic Power Station (Peach Bottom) | 1 2 3 | 1967 1973 1974 | 1974 | ||
| Susquehanna Steam Electric Station (Susquehanna) | 1 2 | 1982 1984 | |||
| Three Mile Island Nuclear Station (Three Mile Island) | 1 2 | 1974 1978 | 1979 | ||
| Shippingport Atomic Power Station | 1957 | 1982 | |||
| Saxton | 1962 | 1972 | |||
| State | Number of Active Reactors in State | Name of Nuclear Power Plant (USNRC-abbreviated plant names) | Reactor Unit | Operating License Issue Date | Shutdown Date |
| South Carolina | 7 | Carolinas-Virginia Tube Reactor | 1963 | 1967 | |
| Oconee Nuclear Station (Oconee) | 1 2 3 | 1973 1973 1974 | |||
| H.B. Robinson Steam Electric Plant (Robinson) | 2 | 1970 | |||
| Virgil C. Summer Nuclear Station (Summer) | 1 | 1982 | |||
| Catawba Nuclear Station (Catawba) | 1 2 | 1985 1986 | |||
| South Dakota | 0 | Pathfnder Atomic Plant (Pathfnder) | 1964 | 1967 | |
| Tennessee | 3 | Sequoyah Nuclear Plant (Sequoyah) | 1 2 | 1980 1981 | |
| Watts Bar Nuclear Plant (Watts Bar) | 1 | 1996 | |||
| Texas | 4 | Comanche Peak Nuclear Power Plant (Comanche Peak) | 1 2 | 1990 1993 | |
| South Texas Project | 1 2 | 1988 1989 | |||
| Vermont | 1 | Vermont Yankee Nuclear Power Station (Vermont Yankee) | 1972 | ||
| Virginia | 4 | North Anna Power Station (North Anna) | 1 2 | 1978 1980 | |
| Surry Power Station (Surry) | 1 2 | 1972 1973 | |||
| Washington | 1 | Columbia Generating Station (Columbia) | 1984 | ||
| Wisconsin | 3 | Kewaunee Power Station (Kewaunee) | 1973 | ||
| Point Beach Nuclear Plant (Point Beach) | 1 2 | 1970 1973 | |||
| La Crosse Nuclear Generating Station (La Crosse) | 1969 | 1987 | |||
TABLE 1.2 USNRC-Licensed Facilities that Are Part of the Nuclear Fuel Cycle
| Site Name, Location | Licensee | Operational Status |
| In situ Recovery Facilitiesa | ||
| Crow Butte, NE | Crow Butte Resources, Inc. | Active |
| Crownpoint, NM | Hydro Resources, Inc. | Not yet constructed |
| Moore Ranch, WY | Uranium One | Active |
| Smith Ranch and Highlands, WY | Power Resources, Inc. | Active |
| Willow Creek, WY | Uranium One | Active |
| Conventional Uranium Mill Recovery Facilitiesa | ||
| Ambrosia Lake, NM | Rio Algom Mining, LLC | Decommissioning |
| Church Rock, NM | United Nuclear Corp. | Decommissioning |
| Homestake, NM | Homestake Mining Co. | Decommissioning |
| Bear Creek, WY | Bear Creek Uranium Co. | Decommissioning |
| Gas Hills, WY | American Nuclear Corp. | Decommissioning |
| Gas Hills, WY | Umetco Minerals Corp. | Decommissioning |
| Highlands, WY | Exxon Mobil Corp. | Decommissioning |
| Lucky Mc, WY | Pathfnder Mines Corp. | Decommissioning |
| Shirley Basin, WY | Pathfnder Mines Corp. | Decommissioning |
| Split Rock, WY | Western Nuclear, Inc. | Decommissioning |
| Sweetwater, WY | Kennecott Uranium Corp. | Stand-by |
| Uranium Hexafuoride Conversion Facility Metropolis, IL | Honeywell International, Inc. | Active |
| Uranium Fuel Fabrication Facilities Wilmington, NC | Global Nuclear Fuels-Americas, LLC | Active |
| Columbia, SC | Westinghouse Electric Company, LLC Columbia Fuel Fabrication Fac. | Active |
| Erwin, TN | Nuclear Fuel Services, Inc. | Active |
| Lynchburg, VA | AREVA NP, Inc. Mt. Athos Road | Inactive |
| Lynchburg, VA | B&W Nuclear Operations Group | Active |
| Richland, WA | AREVA NP , Inc. | Active |
| Mixed Oxide Fuel Fabrication Facility Aiken, SC | Shaw AREVA MOX Services, LLC | Under construction |
| Gaseous Diffusion Uranium Enrichment Facilities | ||
| Paducah, KY | USEC Inc. | Active |
| Piketon, OH | USEC Inc. | In cold shutdown |
| Gas Centrifuge Uranium Enrichment Facilities | ||
| Piketon, OH | USEC Inc. | In construction |
| Eunice, NM | Louisiana Energy Services | Active |
| Idaho Falls, ID | AREVA Enrichment Services | Under review |
| Laser Separation Enrichment Facility | ||
| Wilmington, NC | GE-Hitachi | Under review |
| Uranium Hexafuoride Deconversion | Facility | |
| Hobbes, NM | International Isotopes | Under review |
aThere are additional in situ recovery facilities and conventional uranium mill recovery facilities that are licensed by USNRC agreement states. See the text for details.
SOURCE: USNRC (2011).
The USNRC initially contracted with the Center for Epidemiologic Research at Oak Ridge Associated Universities (ORAU) to assess the feasibility of updating the 1990 NCI investigation. Two methodological approaches were outlined by ORAU: The first was the methodology used in the original 1990 NCI investigation, which utilized county-level data. The second involved an analysis of cancer mortality within 3, 10, 30, and 50 miles from nuclear facilities using more advanced spatial analysis techniques. The ORAU investigators concluded that both approaches were feasible (ORISE, 2009a).
ORAU also studied the feasibility of utilizing cancer incidence data collected either at the county level or by spatial analysis using census tracts or residential addresses. ORAU investigators concluded that there was sufficient cancer incidence data available in electronic form that could be used to update the NCI investigation (ORISE, 2009b).
Subsequently, the USNRC requested that the NAS undertake a de novo assessment of methodologies for carrying out an assessment of cancer risks that could go well beyond an update of the 1990 NCI study. That request resulted in the present study.
The NAS was asked to develop a design for a cancer epidemiologic study to assess potential cancer risks associated with living near USNRC-licensed nuclear facilities (see Sidebar 1.1). A decision about whether to carry out the Phase 2 epidemiologic study is the responsibility of the USNRC. In making this decision, the USNRC will consider a number of factors, some of which are outside the charge for this Phase 1 study. Factors may include scientific merit; the priority of addressing public concerns about cancer risks near USNRC-licensed nuclear facilities versus other agency priorities; and cost.
Epidemiologic studies may have a limited ability to discern associations between radiation exposure and cancer risk at low doses, even when large populations are examined. Additionally, epidemiologic studies of populations exposed to low radiation doses are likely to produce “false positive” associations (i.e., associations that occur purely by chance) if multiple comparisons are made (e.g., for multiple cancer types) as well as “false negative” associations (i.e., associations not established because statistical power is low) because effect size is small. There is little way of knowing whether any such associations (or lack of associations) are anything more than statistical effects.
| Index | Nuclear Power Plant, State |
| 1 | Browns Ferry, Alabama |
| 2 | Farley, Alabama |
| 3 | Palo Verde, Arizona |
| 4 | Arkansas Nuclear, Arkansas |
| 5 | Diablo Canyon, California |
| 6 | San Onofre, California |
| 7 | Millstone, Connecticut |
| 8 | Crystal River, Florida |
| 9 | St. Lucie, Florida |
| 10 | Turkey Point, Florida |
| 11 | Edwin I. Hatch, Georgia |
| 12 | Vogtle, Georgia |
| 13 | Braidwood, Illinois |
| 14 | Byron, Illinois |
| 15 | Clinton, Illinois |
| 16 | Dresden, Illinois |
| 17 | LaSalle, Illinois |
| 18 | Quad Cities, Illinois |
| 19 | Duane Arnold, Iowa |
| 20 | Wolf Creek, Kansas |
| 21 | River Bend, Louisiana |
| 22 | Waterford, Louisiana |
| 23 | Calvert Cliffs, Maryland |
| 24 | Pilgrim, Massachusetts |
| 25 | Cook, Michigan |
| 26 | Palisades, Michigan |
| 27 | Fermi, Michigan |
| 28 | Monticello, Minnesota |
| 29 | Prairie Island, Minnesota |
| 30 | Grand Gulf, Mississippi |
| 31 | Callaway, Missouri |
| 32 | Cooper, Nebraska |
| 33 | Fort Calhoun, Nebraska |
| 34 | Seabrook, New Hampshire |
| 35 | Hope Creek, New Jersey |
| 36 | Oyster Creek, New Jersey |
| 37 | Salem, New Jersey |
| 38 | Fitzpatrick, New York |
| 39 | Ginna, New York |
| 40 | Indian Point, New York |
| 41 | Nine Mile Point, New York |
| 42 | Brunswick, North Carolina |
| 43 | McGuire, North Carolina |
| 44 | Harris, North Carolina |
| 45 | Davis-Besse, Ohio |
| 46 | Perry, Ohio |
| 47 | Beaver Valley, Pennsylvania |
| 48 | Limerick, Pennsylvania |
| 49 | Peach Bottom, Pennsylvania |
| 50 | Susquehanna, Pennsylvania |
| 51 | Three Mile Island, Pennsylvania |
| 52 | Oconee, South Carolina |
| 53 | Robinson, South Carolina |
| 54 | Summer, South Carolina |
| 55 | Catawba, South Carolina |
| 56 | Sequoyah, Tennessee |
| 57 | Watts Bar, Tennessee |
| 58 | Comanche Peak, Texas |
| 59 | South Texas Project, Texas |
| 60 | Vermont Yankee, Vermont |
| 61 | North Anna, Virginia |
| 62 | Surry, Virginia |
| 63 | Columbia, Washington |
| 64 | Kewaunee, Wisconsin |
| 65 | Point Beach, Wisconsin |
FIGURE 1.1a Currently operating nuclear power plants in the United States.
| Index | Licensee, State |
| 1 | Crow Butte Resources, Inc., Nebraska |
| 2 | Uranium One, Wyoming |
| 3 | Power Resources, Inc, Wyoming |
| 4 | Uranium One, Wyoming |
| 5 | Kennecott Uranium Corp.,a Wyoming |
| 6 | Honeywell International, Inc, Illinois |
| 7 | Global Nuclear Fuels-Americas, LLC, North Carolina |
| 8 | Westinghouse Electric Company, LLC Columbia Fuel Fabrication Fac., South Carolina |
| 9 | Nuclear Fuel Services, Inc., Tennessee |
| 10 | B&W Nuclear Operations Group, Virginia |
| 11 | AREVA NP, Inc., Washington |
| 12 | USEC Inc., Kentucky |
| 13 | Louisiana Energy Services, New Mexico |
aStandby
FIGURE 1.1b Currently operating USNRC-licensed nuclear fuel-cycle facilities in the United States.
On the other hand, epidemiologic studies provide the most direct evidence for associations between suspected risk factors (e.g., radiation) and disease (e.g., cancer). Perhaps for this reason, epidemiologic studies continue to be used to assess cancer risks in populations near nuclear facilities in other countries (see Section 1.2 in this chapter and Appendix A). A well-designed
epidemiologic study can be used to formulate or test hypotheses about cancer risks in populations around nuclear facilities.
The committee received two somewhat conflicting messages from presenters at its information-gathering meetings (see Section 1.4 in this chapter) and peer reviewers for this report: (1) A Phase 2 epidemiologic study should be carried out; (2) the study will be a “political” rather than a “scientific” exercise. The committee has endeavored to recommend a technically sound approach for carrying out an epidemiologic study while at the same time clearly identifying the challenges for assessing cancer risks at low doses. The committee hopes that the USNRC will be able to use this information to help make an informed decision about whether to undertake a new epidemiologic study and what type of study to conduct.
1.2 PREVIOUS STUDIES OF CANCER RISKS
Concerns about the potential health impacts from living near nuclear facilities are not new or unique to the United States. A British television program in 1983 reported a cluster of childhood leukemia in Seascale, a village located on the coast of the Irish Sea about 3 kilometers from the nuclear fuel reprocessing facility at Sellafield. The television program reported on seven childhood leukemia cases in the village over the previous 30 years, whereas fewer than one case was expected (Urquhart et al., 1984). Given the proximity of the village to Sellafield, and the absence of other obvious causative agents, radioactive discharges from the reprocessing plant were hypothesized to be responsible for the excess leukemia.
The British government appointed an independent advisory group to investigate these claims. The group (Black, 1984) confirmed the leukemia cluster but could not link it to radioactive discharges. A governmental Committee on Medical Aspects of Radiation in the Environment (COMARE) was subsequently established in 1985 to undertake further investigations. To date, this committee has published 14 reports using data from the national registry of children’s tumors (see Appendix A for literature review).
Since 1985, epidemiologic studies of cancer risks in populations near nuclear facilities have been carried out in at least 11 countries.6 The majority of these studies investigated rates of cancer deaths or cancer occurrence in populations living in various-size geographic areas including counties and municipalities, zones of increasing distance, or zones based on models of dispersion of releases from the nuclear facilities (see Table 4.2, Chapter 4). These studies have come to different conclusions, with some suggesting a positive association between living in proximity to a nuclear facility
6 Canada, Finland, France, Germany, Great Britain, Israel, Japan, Spain, Sweden, Switzerland, and the United States.
and cancer risk. However, studies have been unable to attribute positive associations to radioactive releases from the facilities.
A widely publicized study with a positive finding is the German Kinderkrebs in der Umgebung von Kernkraftwerken (KiKK) study, which was carried out by researchers from the German Childhood Cancer Registry in Mainz on behalf of the Federal Office of Radiation Protection. Study results were published in 2008 (Kaatsch et al., 2008; Spix et al., 2008). They indicated that for a child of age 0-5 years, the risk of developing leukemia doubles if that child lives in close vicinity of a nuclear plant. However, the methodology, presentation, and interpretation of results from the study have been strongly criticized by others (COMARE, 2011; Kinlen, 2011). Additional information about these studies is provided in Appendix A.
Results from two other epidemiologic studies were published during this Phase 1 study: the 14th report of COMARE, which provided further consideration of the incidence of childhood leukemia around nuclear plants in Great Britain (COMARE, 2011), and a study on the risk of childhood leukemia and all childhood cancers in the vicinity of Swiss nuclear plants (Spycher et al., 2011). Neither provided significant evidence of a positive association between distance from nuclear plants and cancer risk.
A third report from France showed that children living within 5 kilometers of nuclear plants are twice as likely to develop leukemia compared to those living 20 kilometers or farther away from the plants. However, analysis of the same population of children using a dose-based geographic zoning approach, instead of distance, did not support the findings. The authors suggest that the absence of any association with the dose-based geographic zoning approach may indicate that the observed association of distance and cancer risk may be due to some unidentified factors other than the releases from the nuclear power plants (Sermage-Faure et al., 2012). Current joint efforts from France and Germany are focusing on developing studies that would improve understanding of the positive associations between childhood leukemia and distance from nuclear power plants by improving current knowledge on the etiology of the disease.
Epidemiologic studies of cancer risks in populations near nuclear facilities have used a number of approaches to assess exposures of study populations to radiation from facility releases (see Section 4.2.1 in Chapter 4). In most cases, exposures are based on surrogate measures (e.g., distance from a facility) that are not related to quantifiable radiation doses. However, some recent studies have attempted to obtain dose estimates based on facility effluent releases. Evrard et al. (2006) grouped communes within 40 kilometers of nuclear plants in France into five categories based on estimated doses based on airborne radioactive effluent discharges (see Chapter 2) and local climate data. The Nuclear Safety Council and the Carlos III
Institute of Health (2009) estimated effective doses in populations living in municipalities at various distances from nuclear facilities in Spain.
More detailed dose reconstructions have been carried out for other applications. These include reconstruction of doses for World War II atomic bombing survivors in Japan; U.S. military personnel exposed to radiation from atmospheric nuclear-weapons testing; U.S. Department of Energy workers who were exposed to occupational radiation at nuclear weapons production and testing facilities and residents in nearby states who were exposed to radiation that was released from these facilities; and individuals who responded to the 1986 Chernobyl accident. These dose reconstruction efforts are described in a number of reports; see, for example, NCRP (2009) and NAS (1995).
1.3 STRATEGY TO ADDRESS THE STUDY CHARGE
This study was carried out by a committee of experts appointed by the NAS. The committee consists of 20 members with expertise that spans the disciplines relevant to the study task: biostatistics, contaminant fate and transport, environmental exposure monitoring, epidemiology, medicine, public health, radiation dosimetry, radiobiology, social science and risk communication, and toxicology. In selecting the committee, the NAS sought to obtain a balance between experts in the design and execution of risk assessment studies for low-dose radiation exposures and experts with relevant disciplinary expertise but no direct experience with low-dose radiation risk assessment. Biographical sketches of the committee members are provided in Appendix B.
The committee was tasked to recommend appropriate study design(s) to assess cancer risks associated with living near nuclear facilities. The selection of suitable study designs primarily involved judgments about scientific soundness, data availability and accessibility, and level of effort versus likely scientific return. The committee’s judgments were also informed by information that it received from technical experts (see Appendix C) and comments from the public (see Chapter 5). The committee attempted to identify study approaches that were scientifically sound and that addressed public concerns.
The focus for this study is on cancer risks arising from exposures to radiation from nuclear plants and fuel-cycle facilities past and present in the course of their ordinary day-to-day operations. The study is not focused on risks arising from nuclear accidents (e.g., Chernobyl or, more recently, Fukushima). Nevertheless, the committee recognizes that public perceptions about the risks related to nuclear plants and fuel-cycle facilities may be shaped by these events.
One of the scientific challenges for carrying out assessments of cancer risks in populations near nuclear facilities is the lack of sufficient statistical power7 to detect relatively small associations between cancer incidence or mortality and exposures to radiation from facility releases. This is primarily the result of the small radiation doses that are typically received by individuals living near nuclear facilities as a result of normal operations at those facilities (see Chapter 3). As a consequence, epidemiologic assessments of cancer risk require the study of very large populations to have any hope of having adequate statistical power to detect positive associations between cancer and radiation exposure. Modest improvements in the statistical power can be achieved by examining dose-response gradients, especially when the population under study is exposed to a range of doses.
Tables 1.3 and 1.4 show the populations living within 5 and 30 miles of currently operating nuclear facilities in the United States as determined in the 2010 census.8 As can be seen in this table, there was a wide variation in the numbers of persons living near nuclear facilities in 2010:
- Approximately 1 million people lived within 5 miles of operating nuclear plants in 2010; over 45 million people lived within 30 miles.
- Approximately 116,000 people lived within 5 miles of USNRC-licensed operating fuel-cycle facilities in 2010; over 2 million people lived within 30 miles.
- Approximately 210 people lived within 5 miles of a USNRC-licensed operating in situ recovery or conventional uranium mill recovery facility in 2010; about 11,000 lived within 30 miles.9
The committee decided to focus most of its efforts in this Phase 1 study on nuclear plants because of their large associated populations. The committee decided not to consider mining and milling facilities in this Phase 1 study because of their low associated populations. The committee recognizes that people who live near these mining and milling facilities may be just as concerned about cancer risks as people who live near nuclear plants. However, epidemiologic studies of cancer risk would have no statistical
7 That is, the ability of a statistical test to detect a predetermined difference in risk (e.g., a doubling in cancer mortality associated with radiation exposure) if it exists. In this context, statistical power depends on the risk in the control population, the smallest increase in risk the investigator wants to be reasonably sure of finding (if it is present), and the acceptable probabilities of a false positive result (if there is no increase) and a false negative result (if there is an increase of at least the size to be sought).
8 The 2010 census data are used here simply to illustrate population differences for various facilities. The 2010 data do not reflect the population distribution around sites in prior years.
9 Note: These are median estimates for individual in situ recovery or conventional uranium mill recovery facilities, not total populations for all facilities.
TABLE 1.3 Populations in the 5- and 30-Mile (Approximately 8- and 50-Kilometer) Zones around Currently Operating Nuclear Power Plants Based on the 2010 U.S. Census Data
|
|
||||
| Index | State | Name | 5 Mile | 30 Mile |
|
|
||||
| 1 | Alabama | Browns Ferry Nuclear Plant | 6,098 | 530,011 |
| 2 | Joseph M Farley Nuclear Plant | 2,534 | 186,768 | |
| 3 | Arizona | Palo Verde Nuclear Generating Station | 1,117 | 273,806 |
| 4 | Arkansas | Arkansas Nuclear One | 14,177 | 137,107 |
| 5 | California | Diablo Canyon Power Plant | 1,648 | 338,602 |
| 6 | San Onofre Nuclear Generating Station | 23,525 | 2,410,113 | |
| 7 | Connecticut | Millstone Power Station | 53,321 | 667,492 |
| 8 | Florida | Crystal River Nuclear Generating Plant | 6,142 | 271,625 |
| 9 | St. Lucie Plant | 34,017 | 584,465 | |
| 10 | Turkey Point | 7,963 | 1,838,689 | |
| 11 | Georgia | Edwin I. Hatch Nuclear Plant | 2,063 | 135,568 |
| 12 | Vogtle Electric Generating Plant | 1,941 | 398,181 | |
| 13 | Illinois | Braidwood Station | 16,834 | 971,587 |
| 14 | Byron Station | 12,339 | 600,581 | |
| 15 | Clinton Power Station | 1,643 | 419,698 | |
| 16 | Dresden Nuclear Power Station | 22,872 | 1,815,892 | |
| 17 | LaSalle County Station | 3,211 | 345,966 | |
| 18 | Quad Cities Nuclear Power Station | 6,252 | 451,281 | |
| 19 | Iowa | Duane Arnold Arnold Energy Center | 12,180 | 351,236 |
| 20 | Kansas | Wolf Creek Generating Station | 1,690 | 75,810 |
| 21 | Louisiana | River Bend Station | 5,647 | 536,645 |
| 22 | Waterford Steam Electric Station | 13,774 | 1,119,079 | |
| 23 | Maryland | Calvert Cliffs Nuclear Power Plant | 18,438 | 443,962 |
| 24 | Massachusetts | Pilgrim Nuclear Power Station | 23,108 | 1,245,016 |
| 25 | Michigan | Donald C. Cook Nuclear Plant | 16,977 | 563,815 |
| 26 | Palisades Nuclear Plant | 7,693 | 288,716 | |
| 27 | Fermi | 18,035 | 2,230,762 | |
| 28 | Minnesota | Monticello Nuclear Generating Plant | 21,107 | 964,863 |
| 29 | Prairie Island Nuclear Generating Plant | 6,650 | 789,039 | |
| 30 | Mississippi | Grand Gulf Nuclear Station | 1,657 | 87,677 |
| 31 | Missouri | Callaway Plant | 1,620 | 225,301 |
| 32 | Nebraska | Cooper Nuclear Station | 892 | 54,338 |
| 33 | Fort Calhoun Station | 9,305 | 829,567 | |
| 34 | New Hampshire | Seabrook Station | 47,004 | 1,667,009 |
| 35 | New Jersey | Hope Creek Generating Station | 5,681 | 1,512,768 |
| 36 | Oyster Creek Nuclear Generating Station | 44,156 | 1,010,661 | |
| 37 | Salem Nuclear Generating Station | 5,434 | 1,490,771 | |
| 38 | New York | James A. Fitzpatrick Nuclear Power Plant | 10,838 | 615,046 |
| 39 | R.E. Ginna Nuclear Power Plant | 14,788 | 894,227 | |
| 40 | Indian Point Nuclear Generating | 88,189 | 5,695,758 | |
| 41 | Nine Mile Point | 6,729 | 307,622 | |
| 42 | North Carolina | Brunswick Steam Electric Plant | 13,398 | 315,360 |
| 43 | McGuire Nuclear Station | 51,561 | 2,014,369 | |
| 44 | Shearon Harris Nuclear Power Plant | 29,445 | 1,567,691 | |
| 45 | Ohio | Davis-Besse Nuclear Power Plant | 3,390 | 733,031 |
| 46 | Perry Nuclear Power Plant | 24,164 | 810,777 | |
| 47 | Pennsylvania | Beaver Valley Power Station | 16,181 | 1,656,510 |
| 48 | Limerick Generating Station | 97,649 | 4,453,399 | |
| 49 | Peach Bottom Atomic Power Station | 11,326 | 1,787,122 | |
| 50 | Susquehanna Steam Electric Station | 15,462 | 664,767 | |
| 51 | Three Mile Island Nuclear Station | 48,714 | 1,520,777 | |
| 52 | South Carolina | Oconee Nuclear Station | 15,616 | 634,339 |
| 53 | H.B. Robinson Steam Electric Plant | 11,927 | 292,920 | |
| 54 | Virgil C. Summer Nuclear Station | 2,940 | 663,629 | |
| 55 | Catawba Nuclear Station | 50,337 | 1,768,246 | |
| 56 | Tennessee | Sequoyah Nuclear Plant | 29,485 | 714,473 |
| 57 | Watts Bar Nuclear Plant | 5,152 | 362,142 | |
| 58 | Texas | Comanche Peak Nuclear Power Plant | 6,842 | 285,159 |
| 59 | South Texas Project | 1,691 | 66,066 | |
| 60 | Vermont | Vermont Yankee Nuclear Power Station | 12,737 | 345,863 |
| 61 | Virginia | North Anna Power Station | 6,903 | 507,945 |
| 62 | Surry Power Station | 13,081 | 984,927 | |
| 63 | Washington | Columbia Generating Station | 407 | 282,505 |
| 64 | Kewaunee Power Station | 2,974 | 324,911 | |
| 65 | Wisconsin | Point Beach Nuclear Plant | 3,297 | 304,151 |
| Total: | 934,488 | 45,020,247 | ||
|
|
||||
| NOTE: Plants in close geographic proximity may have overlapping population could be included (i.e., counted) in more than one plant population. the bottom of the table corrects for multiple counting is only counted once). As a consequence, the sum of plants does not equal the population total at the bottom of the table corrects for multiple counting (i.e., each person living near a plant is only counted once). As a consequence, the sum of the populations for the individual plants does not equal the population total at the bottom of the table. | ||||
TABLE 1.4 Populations in the 5- and 30-Mile (Approximately 8- and 50-Kilometer) Zones around Currently Operating USNRC-Licensed Facilities that Are Part of the Nuclear Fuel Cycle Based on the 2010 U.S. Census Data
|
|
|||||
| Index | State | Licensee | Type | 5 mile | 30 mile |
|
|
|||||
| 1 | Nebraska | Crow Butte Resources, Inc | Mining | 196 | 10,796 |
| 2 | Wyoming | Uranium One | Mining | 237 | 5,986 |
| 3 | Power Resources, Inc | Mining | 72 | 14,378 | |
| 4 | Uranium One | Mining | 123 | 5,340 | |
| 5 | Wyoming | Kennecott Uranium Corp.a | Milling | 21 | 1,438 |
| 6 | Illinois | Honeywell International, Inc | Conversion | 11,334 | 184,442 |
| 7 | North Carolina | Global Nuclear Fuels-Americas, LLC | Fuel Fabrication | 35,854 | 349,780 |
| 8 | South Carolina | Westinghouse Electric Company, LLC Columbia Fuel Fabrication Fac. | Fuel Fabrication | 14,512 | 796,391 |
| 9 | Tennessee | Nuclear Fuel Services, Inc. | Fuel Fabrication | 12,765 | 432,825 |
| 10 | Virginia | B&W Nuclear Operations Group | Fuel Fabrication | 21,810 | 280,396 |
| 11 | Washington | AREVA NP, Inc. | Fuel Fabrication | 33,253 | 276,038 |
| 12 | Kentucky | USEC Inc. | Enrichment | 7,370 | 190,772 |
| 13 | New Mexico | Louisiana Energy Services | Enrichment | 934 | 48,631 |
| Total: | 116,282 | 2,308,747 | |||
|
|
|||||
| NOTE: Facilities in close geographic proximity may have overlapping populations, so persons living near those facilities could be included (i.e., counted) in more than one facility population. The population total shown at the bottom of the table corrects for multiple counting (i.e., each person living near a facility is only counted once). As a consequence, the sum of the populations for the individual facilities does not equal the population total at the bottom of the table. aStandby |
|||||
power to detect associations between radiation and cancer because of these small populations.
With respect to the other types of fuel-cycle facilities, the committee focused most of its efforts on one facility, Nuclear Fuel Services in Erwin, Tennessee, primarily because of the public interest in cancer risks resulting from radioactive releases from that facility. The methodology proposed by the committee for assessing cancer risk at this facility is applicable to other fuel-cycle facilities as well.
1.4 INFORMATION GATHERING AND REPORT ORGANIZATION
The committee held five information-gathering meetings to receive briefings from subject-matter experts, including experts in the fields of epidemiology, dosimetry, and social science; representatives of the USNRC and the nuclear industry; representatives of cancer registries; and interested members of the public. Small groups of committee members visited the Dresden Nuclear Power Station (Illinois) in April 2011, the San Onofre Nuclear Generating Station (California) in July 2011, and the Nuclear Fuel Services facility (Tennessee) in October 2011 to learn about the design and operation of these facilities’ radioactive effluent release and environmental monitoring programs. A list of committee meeting briefings is provided in Appendix C.
The committee’s information-gathering sessions were webcast in an effort to enhance public awareness and participation in the study. Copies of these webcasts are available at http://www.nationalacademies.org/ cancerriskstudy.
The committee received a large number of oral and written comments from nongovernmental organizations and other members of the public. These were helpful for informing the committee about public concerns related to the study and for uncovering data sources and documents that were useful to the committee.
This report is organized into five chapters that address the statement of task (Sidebar 1.1) in its entirety:
- Chapter 1 (this chapter) provides background on the study.
- Chapter 2 describes the effluent releases from nuclear facilities.
- Chapter 3 describes methods to estimate radiation exposure and dose from radioactive effluent releases and other sources.
- Chapter 4 describes epidemiologic study designs that could be used to investigate whether populations near nuclear facilities are at an increased risk of developing cancer.
- Chapter 5 describes the public engagement process used in this Phase 1 study and suggests how it can be extended for Phase 2.
Definitions of terms and acronyms are provided in Appendixes N and O, respectively.
REFERENCES
Black, D. (1984). Investigation of the possible increased incidences of cancer in West Cumbria. London: Her Majesty’s Stationary office.
COMARE (Committee on Medical Aspects of Radiation in the Environment) (2011). Four-theenth report: Further consideration of the incidence of childhood leukemia around nuclear power plants in Great Britain, Health Protection Agency, may 2011.
Evrard, A. S., D. Hemon, et al. (2006). Childhood leukaemia incidence around French nuclear installations using geographic zoning based on gaseous discharge dose estimates. Br J Cancer 94(9):1342-1347.
Jablon, S., Z. Hrubec, J. D. Boice, Jr., and B. J. Stone (1990). Cancer in populations living near nuclear facilities, Volumes 1-3, NIH Publication No. 90-874.
Jablon, S., Z. Hrubec, et al. (1991). Cancer in populations living near nuclear facilities. A survey of mortality nationwide and incidence in two states. JAMA 265(11):1403-1408.
Kaatsch, P., C. Spix, et al. (2008). Leukaemia in young children living in the vicinity of German nuclear power plants. Int J Cancer 122(4):721-726.
Kinlen, L. (2011). A German storm affecting Britain: Childhood leukaemia and nuclear power plants. J Radiol Prot 31(3):279-284.
NAS (National Academy of Sciences) (1995). Radiation dose reconstruction for epidemiologic uses. Washington, DC: National Academy Press.
NCRP (National Council on Radiation Protection and Measurements) (2009). Ionizing radiation exposure of the populations of the United States. Report 160.
Nuclear Safety Council and the Carlos III Institute of Health (2009). Epidemiological study of the possible effect of ionizing radiations deriving from the operation of Spanish nuclear fuel cycle facilities on the health of the population living in their vicinity, Spain.
ORISE (Oak Ridge Institute for Science and Education) (2009a). Protocol for an analysis of cancer risk in populations living near nuclear-power facilities, Rev. 1, September 30. ORISE (2009b). Cancer incidence feasibility study, October 22.
Sermage-Faure, C, D. Laurier, S. Goujon-Bellec, M. Chartier, A. Guyot-Goubin, J. Rudant, D. Hémon, and J. Clavel. Childhood leukemia around French nuclear power plants—the Geocap study, 2002-2007. Int J Cancer. [Epub ahead of print]
Spix, C, S. Schmiedel, et al. (2008). Case-control study on childhood cancer in the vicinity of nuclear power plants in Germany 1980-2003. Eur J Cancer 44(2):275-284.
Spycher, B. D., M. Feller, et al. (2011). Childhood cancer and nuclear power plants in Switzerland: a census-based cohort study. Int J Epidemiol 40(5):1247-1260.
Urquhart, J., M. Palmer, et al. (1984). Cancer in Cumbria: The Windscale connection. Lancet 1(8370):217-218.
USNRC (U.S. Nuclear Regulatory Commission) (2011). 2011-2012 Information Digest. NUREG-1350, Vol. 23.


