
Sea level rose during the 20th century, and observations and projections suggest that it will rise at a higher rate during the 21st century. Rising seas increase the risk of coastal flooding, storm surge inundation, coastal erosion and shoreline retreat, and wetland loss. The cities and infrastructure that line many coasts are already vulnerable to damage from storms, which is likely to increase as sea level continues to rise and inundate areas further inland.
Global mean sea level is rising primarily because global temperatures are rising, causing ocean water to expand and land ice to melt. However, sea-level rise is not uniform; it varies from place to place. Sea-level rise along the coasts of California, Oregon, and Washington (referred to hereafter as the U.S. west coast) depends on the global mean sea-level rise and also on regional factors, such as ocean and atmospheric circulation patterns in the northern Pacific Ocean, the gravitational and deformational effects of land ice mass changes, and tectonics along the coast. The comparative importance of these factors determines whether local sea level is higher or lower than the global mean, and how fast it is changing. Such information has enormous implications for coastal planning.
California Executive Order S-13-08 directed state agencies to plan for sea-level rise and coastal impacts, and it also requested the National Research Council (NRC) to establish a committee to assess sea-level rise to inform these state efforts. The states of Washington and Oregon, the U.S. Army Corps of Engineers, the National Oceanic and Atmospheric Administration, and the U.S. Geological Survey subsequently joined California in sponsoring this study to evaluate sea-level rise in the global oceans and along the coasts of California, Oregon, and Washington for 2030, 2050, and 2100. The charge to the committee is given in Box S.1.
The most comprehensive estimates of global sea-level rise are made by the Intergovernmental Panel on Climate Change (IPCC), which assesses the state of knowledge on climate change every 5 to 6 years. The last IPCC assessment, published in 2007, evaluated research results published until mid-2006. This report summarizes the IPCC (2007) findings on global sea-level change and updates them with more recent results. In contrast, no comprehensive assessments of the rate of sea-level rise off the coasts of California, Oregon, and Washington have been carried out. Consequently, this report summarizes published research results on the processes that contribute to sea-level change in the region and also presents the committee’s analysis of relevant data and model results. Projections of global and local sea-level rise for 2030, 2050, and 2100 are based on model results and data extrapolations, as described below.
GLOBAL SEA-LEVEL RISE
Following a few thousand years of relative stability, global sea level has been rising since the late 19th or early 20th century, when global temperatures began to increase. The IPCC (2007) estimated that global sea level rose an average of 1.7 ± 0.5 mm per year over the 20th century, based on tide gage measurements from around the world. Rates for 1993–2003 were 3.1 ± 0.7 mm per year, based on precise satellite altimetry measurements and confirmed by tide gage
BOX S.1
Committee Charge
The committee will provide an evaluation of sea-level rise for California, Oregon, and Washington for the years 2030, 2050, and 2100. The evaluation will cover both global and local sea-level rise. In particular, the committee will
1. Evaluate each of the major contributors to global sea-level rise (e.g., ocean thermal expansion, melting of glaciers and ice sheets); combine the contributions to provide values or a range of values of global sea-level rise for the years 2030, 2050, and 2100; and evaluate the uncertainties associated with these values for each timeframe.
2. Characterize and, where possible, provide specific values for the regional and local contributions to sea-level rise (e.g., atmospheric changes influencing ocean winds, ENSO [El Niño-Southern Oscillation] effects on ocean surface height, coastal upwelling and currents, storminess, coastal land motion caused by tectonics, sediment loading, or aquifer withdrawal) for the years 2030, 2050 and 2100. Different types of coastal settings will be examined, taking into account factors such as landform (e.g., estuaries, wetlands, beaches, lagoons, cliffs), geologic substrate (e.g., unconsolidated sediments, bedrock), and rates of geologic deformation. For inputs that can be quantified, the study will also provide related uncertainties. The study will also summarize what is known about
a. climate-induced increases in storm frequency and magnitude and related changes to regional and local sea-level rise estimations (e.g., more frequent and severe storm surges);
b. the response of coastal habitats and geomorphic environments (including restored environments) to future sea-level rise and storminess along the west coast;
c. the role of coastal habitats, natural environments, and restored tidal wetlands and beaches in providing protection from future inundation and waves.
records. More recent tide gage and altimetry data confirm that the higher rate of sea-level rise is continuing. However, because of natural climate variability, which affects sea level on decadal and longer timescales, more data are needed to determine whether the higher rates since the 1990s mark an acceleration in the long-term sea-level trend.
Components of Global Sea-Level Rise
A warming climate causes global sea level to rise by (1) warming the oceans, which causes sea water to expand, increasing ocean volume, and (2) melting land ice, which transfers water to the ocean. Human activities that transfer water between the land and ocean also affect global sea-level change. In particular, water withdrawn from aquifers eventually reaches the ocean, raising global sea level, whereas water stored behind dams effectively lowers global sea level.
The IPCC (2007) estimated that ice melt from glaciers, ice caps, and ice sheets contributed about 40 percent of the observed sea-level rise for 1961–2003 and that thermal expansion of ocean water contributed one-quarter of the observed rate for 1961–2003 and one-half for 1993–2003. Contributions from groundwater extraction and reservoir storage were poorly quantified but were thought to account for less than 10 percent of the observed rise. More recent data have changed these estimates. After the IPCC (2007) report was published, a bias was discovered in some ocean temperature measurements, which gave systematically warmer temperatures than the true values. Data sets corrected for this bias yield significantly lower rates of thermal expansion for the 1993–2003 period than were found by the IPCC (2007).
New research results also indicate that the relative contribution of land ice to global sea-level rise is increasing. Since 2006, the ice loss rate from the Greenland Ice Sheet has increased, and, according to most analyses, the contribution of Antarctic ice to sea-level change has shifted from negative (lowering sea level by accumulating ice) to positive (raising sea level). Ice loss rates from glaciers and ice caps have declined over the same period, but not enough to offset the increases in ice sheet melt. As a result of higher observed ice loss rates and a lower (corrected) contribution from thermal expansion, land ice is currently the largest contributor to global sea-level rise. In the most recent published estimate, land ice accounted for about 65 percent of the total sea-level rise from 1993 to 2008.
The contributions of groundwater withdrawal and reservoir storage to sea-level change remain poorly
constrained, largely due to sparse data and inadequate models. Each process likely has a significant but opposite effect on sea-level change, on the order of 0.5 mm per year.
SEA-LEVEL RISE OFF CALIFORNIA, OREGON, AND WASHINGTON
The sea level at any particular place along the coast is commonly measured using tide gages, which record the height of the sea surface with respect to the land surface, both of which may change over time. Relative sea level will rise if ocean levels rise and/or land levels fall. Records from 12 west coast tide gages indicate local variability in sea-level change along the coast, although most of the gages north of Cape Mendocino, California, show that relative sea level has been falling over the past 6–10 decades, and most of the gages south of Cape Mendocino show that relative sea level has been rising.
Factors That Affect Northeast Pacific Ocean Levels
Along the west coast of the United States, climate patterns such as the El Niño-Southern Oscillation and, to a lesser extent, the Pacific Decadal Oscillation, affect winds and ocean circulation, raising local sea level during warm phases (e.g., El Niño) and lowering sea level during cool phases (e.g., La Niña). Large El Niño events can raise coastal sea levels by 10 to 30 cm for several winter months.
The large mass of glaciers and ice sheets exerts a gravitational pull that draws ocean water closer. As the ice melts, the gravitational pull decreases, ice melt enters the ocean, and the land and ocean basins both deform as a result of this loss of land ice mass. These gravitational and deformational effects produce a spatial pattern of regional sea-level change called a sea-level fingerprint. Melting from Alaska and, to a lesser extent, Greenland, causes relative sea level to fall at decreasing rates from northern Washington to southern California, whereas melting from Antarctica causes relative sea level to rise along all three states. The net effect is a reduction in the contribution of the three ice sources to relative sea-level rise by 42 percent along the north coast (Neah Bay), 24 percent along the central coast (Eureka), and 14 percent along the south coast (Santa Barbara) for 1992–2008.
Factors That Affect Land Elevation in California, Oregon, and Washington
Although modern melting of land ice has a significant effect on sea-surface heights in the northeast Pacific Ocean, the melting and eventual disappearance of North American ice sheets that began more than 20,000 years ago has a significant effect on land levels in California, Oregon, and Washington. The massive loss of ice from the ancient ice sheets continues to cause uplift of about 1 mm per year in northernmost Washington, which had been covered by an ice sheet, and subsidence of about 1–2 mm per year in areas at the ice margin and beyond, which includes the rest of Washington, Oregon, and California.
Tectonics causes substantial regional uplift along much of the Washington, Oregon, and northernmost California coast, where ocean plates are descending below North America at the Cascadia Subduction Zone. South of Cape Mendocino, California, the Pacific and North American plates are sliding past one another along the San Andreas Fault Zone, creating relatively little vertical land motion along the coast. Local tectonics, as well as compaction of sediments, pumping of water or hydrocarbons from subsurface reservoirs, and fluid recharge can produce locally high rates of land subsidence or uplift. Water or hydrocarbon extraction, which can lower surface elevations up to tens of centimeters per year if fluids are not returned to the subsurface, is most important in California.
The total vertical land motion from all of these geological processes and human activities can be estimated from Global Positioning System (GPS) measurements, which show that much of the coast is rising about 1.5–3.0 mm per year north of Cape Mendocino. The coast south of Cape Mendocino is sinking at an average rate of about 1 mm per year, although GPS-measured rates vary widely (-3.7–0.6 mm per year).
PROJECTIONS OF SEA-LEVEL RISE FOR 2030, 2050, AND 2100
Global Projections
Projections of global sea-level rise are generally made using models of the ocean-atmosphere-climate system, extrapolations, or semi-empirical methods.
Ocean-atmosphere models are based on knowledge of the physical processes that contribute to sea-level rise, and they predict the response of those processes to different scenarios of future greenhouse gas emissions. These models provide a reasonable estimate of the water density (steric) component of sea-level rise (primarily thermal expansion), but they underestimate the land ice contribution because they do not fully account for rapid changes in the behavior of ice sheets and glaciers as melting occurs (ice dynamics). The IPCC (2007) projections were made using this method, and they are likely too low, even with an added ice dynamics component. Estimates of the total land ice contribution can be made by extrapolating observations of recent ice loss rates from glaciers, ice caps, and ice sheets into the future. Extrapolations of future ice melt are most reliable for time frames in which the dynamics controlling behavior are stable, in this case, up to several decades. Semi-empirical methods, exemplified by Vermeer and Rahmstorf (2009), avoid the difficulty of estimating the individual contributions to sea-level rise by simply postulating that sea level rises faster as the Earth gets warmer. This approach reproduces the sea-level rise observed in the past, but reaching the highest projections would require acceleration of glaciological processes to levels not previously observed or understood as realistic.
Given the strengths and weaknesses of the different projection methods, as well as the resource constraints of an NRC study, the committee chose a combination of approaches for its projections. The committee projected the steric component of sea-level rise using output from global ocean models under an IPCC (2007) mid-range greenhouse gas emission scenario. The land ice component was extrapolated using the best available compilations of ice mass accumulation and loss (mass balance), which extend from 1960 to 2005 for glaciers and ice caps, and from 1992 to 2010 for the Greenland and Antarctic ice sheets. The contributions were then summed. The committee did not project the land hydrology contribution because available estimates suggested that the sum of groundwater extraction and reservoir storage is near zero, within large uncertainties.
Based on these calculations, the committee estimates that global sea level will rise 8–23 cm by 2030 relative to 2000, 18–48 cm by 2050, and 50–140 cm by 2100. The ranges reflect uncertainties related to the fit of the data; the level of future greenhouse emissions, which affects the steric component; and any future changes in the rate of ice flow, which affects the total ice contribution. These uncertainties, and hence the ranges, grow with the length of the projection period.
The committee’s global projections for 2030 and 2050 are similar to the Vermeer and Rahmstorf (2009) projections for the same periods, but they have a wider range. For 2100, when IPCC (2007) projections are also available, the committee’s projection is substantially higher than IPCC’s projection (18–59 cm with an additional 17 cm if rapid dynamical changes in ice flow are included), mainly because of a faster growing cryosphere component, and lower than Vermeer and Rahmstorf’s projection (78–175 cm).
Projections for California, Oregon, and Washington
Sea-level rise off the west coast of the United States is influenced by a variety of local factors; therefore, sea-level projections for California, Oregon, and Washington differ from global projections. The factors that affect local sea-level projections include steric variations; wind-driven differences in ocean heights; gravitational and deformational effects (sea-level fingerprints) of melting of ice from Alaska, Greenland, and Antarctica; and vertical land motions along the coast. The local steric and wind-driven components were estimated by extracting northeast Pacific data from the same ocean models used for the global projections. The cryosphere component was adjusted for gravitational and deformational effects and then extrapolated forward. Finally, vertical land motion was projected using continuous GPS measurements for two tectonically distinct areas: Cascadia, where the coastline is generally rising, and the San Andreas region, where the coastline is generally subsiding.
The projections for California, Oregon, and Washington are illustrated in Figure S.1. The steep change in projected sea-level rise at Cape Mendocino reflects the transition from land subsidence in California, which effectively increases sea-level rise, to land uplift in Oregon and Washington, which effectively decreases sea-level rise. The slight slope in the projection curves from north to south reflects the sea-level fingerprints, which lower relative sea level, especially along the Washington coast. For the California coast south of Cape
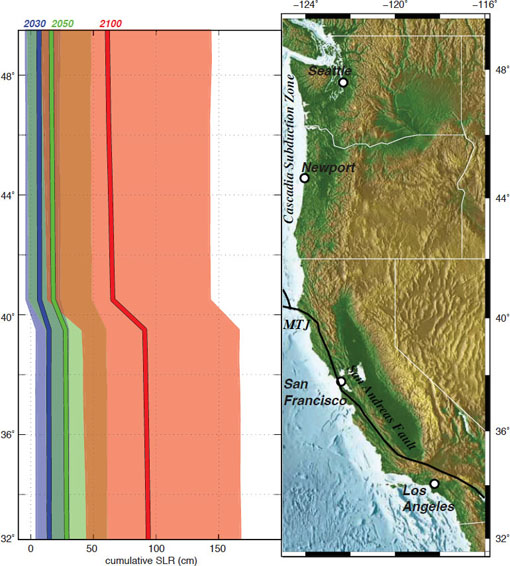
FIGURE S.1 Projected sea-level rise off California, Oregon, and Washington for 2030 (blue), 2050 (green), and 2100 (pink), relative to 2000, as a function of latitude. Solid lines are the projections, and shaded areas are the ranges. Ranges overlap, as indicated by the brown shading (low end of 2100 range and high end of 2050 range) and blue-green shading (low end of 2050 range and high end of 2030 range). MTJ = Mendocino Triple Junction, where the San Andreas Fault meets the Cascadia Subduction Zone.
Mendocino, the committee projects that sea level will rise 4–30 cm by 2030 relative to 2000, 12–61 cm by 2050, and 42–167 cm by 2100. For the Washington, Oregon, and California coasts north of Cape Mendocino, sea level is projected to change between -4 cm (sea-level fall) and +23 cm by 2030, -3 cm and +48 cm by 2050, and 10–143 cm by 2100. Major sources of uncertainty in the regional projections are related to assumptions about future ice losses and a constant rate of vertical land motion over the projection period. Uncertainties are larger for the regional projections than for the global projections because more components are considered and because uncertainties in the steric and ocean dynamic components are larger at a regional scale than at a global scale.
The combination of land uplift and gravitational and deformational effects reduces the threat of future sea-level rise for Washington and Oregon. However, the land is rising along the Washington and Oregon coasts likely because interseismic strain is building in the Cascadia Subduction Zone. A great earthquake (magnitude larger than 8), which has occurred in the area every few hundred to 1,000 years, would cause some coastal areas to immediately subside and relative sea level to suddenly rise. If this occurs, relative sea level could rise an additional meter or more over projected levels.
The committee’s projections for the California coast are slightly higher than its global projections, primarily because much of the coastline is subsiding. The California projections are somewhat lower but have wider ranges than the Vermeer and Rahmstorf (2009) global projections, which are being used by California on an interim basis for coastal planning.
The projections of future sea-level rise have large uncertainties resulting from an incomplete understanding of the global climate system, the inability of global climate models to accurately represent all important components of the climate system at global or regional scales, a shortage of data at the temporal and spatial scales necessary to constrain the models, and the need to make assumptions about future conditions (e.g., greenhouse gas emissions, large volcanic eruptions) that drive the climate system. As the projection period lengthens, uncertainty in the projections grows. At short timescales (2030 and perhaps 2050), when the models more closely represent the future climate system, confidence in the global and regional projections is relatively high. By 2100, however, projections made using process-based numerical models, extrapolations, and semi-empirical methods all have large uncertainties. The actual sea-level rise will almost surely fall somewhere within the wide uncertainty bounds, although the exact value cannot be specified with high confidence.
SEA-LEVEL RISE AND STORMINESS
Most of the damage along the California, Oregon, and Washington coasts is caused by storms—particularly the confluence of large waves, storm surges, and high astronomical tides during a strong El Niño. The water levels reached during these large, short-term events have exceeded mean sea levels projected for 2100, so understanding their additive effects is crucial for coastal planning.
Changes in Storm Frequency and Magnitude
Climate change has been postulated to induce changes in storm frequency, magnitude, and direction. To date, there is no consensus among climate model simulations about whether the number and severity of storms will change in the northeast Pacific. A number of climate models predict a northward shift in the North Pacific storm track over the course of the 21st century, which could lessen the impact of winter storms in southern California and possibly increase their impact in Oregon and Washington. However, these changes may not emerge for a few decades, and most observational records are not yet long enough to determine conclusively whether storm tracks are moving north.
Several observational studies have reported that the largest waves have been getting higher and that winds have been getting stronger in the northeastern Pacific over the past few decades. Interpretation of these trends is controversial because wave and wind records are short, extending back only about 35 years. At least part of the observed increase likely reflects natural climate variability of the Pacific atmosphere-ocean system, particularly the occurrence of large El Niños and interdecadal fluctuations. If some or all of the increase represents a long-term trend, the frequency and magnitude of extremely high coastal wave events will likely increase.
Even if storminess does not increase in the future, sea-level rise will magnify the adverse impact of storm surges and high waves on the coast. For example, a model using the committee’s sea-level projections predicts that the incidence of extreme high water events (1.4 m above historical mean sea level) in the San Francisco Bay area will increase substantially with sea-level rise, from less than 10 hours per decade today to a few hundred hours per decade by 2050 and to several thousand hours per decade by 2100.
Coastal Responses to Sea-Level Rise and Storminess
The natural shoreline can provide partial protection for coastal development against sea-level rise and storms. Coastal cliffs, beaches, and dunes take the brunt of storm waves and are therefore eroding over the long term. The net result of storms and sea-level rise is coastline retreat, with rates ranging from a few centimeters per year for cliffs made of resistant bedrock to several meters per year for beaches and dunes, which consist primarily of unconsolidated sand. These rates will increase with rising sea level and are likely to further increase if waves become higher. Although seawalls and revetments can make the shoreline more resistant to wave attack, they prevent beaches from migrating landward and will eventually be overwhelmed by sea-level rise.
Marshes and mudflats protect inland areas by storing flood waters and damping wave height and energy. To continue providing these services as sea level rises, marshes must be able to maintain their elevation relative to sea level and to move inland in places where they are subject to erosion at the seaward edge. Building elevation requires a sufficient supply of sediment and accumulation of organic material. Most studies of west coast marshes have focused on the supply of sediment. The frequent storms and associated floods in central and southern California potentially provide enough sediment for marshes to keep pace with the sea-level rise projected for 2030 and 2050 by the committee. In Oregon and Washington, rivers also potentially carry enough sediment for marshes to maintain elevation, despite upstream dams, especially because the projections of sea-level rise are lower. For 2100, marshes will need room to migrate, a high sediment supply, and uplift or low subsidence to survive the projected sea-level rise.


