
Current Dam and Levee Infrastructure, Management, and Governance
This chapter summarizes current dam and levee physical infrastructure, and management approaches with respect to safety, including methods and standards used in design, inventory, operation and maintenance, and emergency management. It also addresses the governance framework in place to facilitate and guide dam and levee safety, including the legal framework and the roles and authorities of agencies at different levels. Gaps in current practice and governance related to fostering community resilience are identified. Because policies, management, and jurisdictional responsibility for safety differ between dams and levees, this chapter describes dam and levee issues separately.
“Safety” to many dam and levee professionals is associated primarily with reducing the likelihood of flooding. Dam safety efforts since the 1972 failure of Buffalo Creek Dam1 have therefore focused on strengthening safety programs, reducing the potential for future failures, conducting periodic inspections, remedying deficiencies, and preparing emergency action plans (EAPs). Progress in those endeavors has been substantial on a national scale. There has also been consistent movement in recent years toward risk-informed dam safety assessments among many dam owners. Development of EAPs and the carrying out of tabletop and full-field exercises have also become established dam safety practices among many owners.
Despite such challenges as limitations in safety program resources, a large number of dams rated as having “high” or “significant” potential of death or loss of property in the event of failure (see Box 3.1for description of the rating system) are inspected in a timely manner according to guidance from the Association of State Dam Safety Officials (ASDSO)2 (e.g.,
_____________
1Information about the Buffalo Creek Dam failure can be found at www.wvculture.org/history/disasters/buffcreekgovreport.html (accessed December 23, 2011).
2ASDSO was established in 1983 and represents state, federal, and local dam professionals, academics, and manufacturers and suppliers. The organization was established to provide guidance for nonfederal dam owners. Although it holds no regulatory authority, it has played a major role in coordinating dam safety efforts across the country and between the states and the federal agencies. It has been the major advocate for dam safety policy, technical guidelines, and training. See www.damsafety.org/about/?p=1ca717dd-18d5-4803-a7eb-cd45aad31210 (accessed February 7, 2012).
ASDSO, 2005). As a result of these inspections, many dams have undergone safety modifications for hydrologic, seismic, and other deficiencies. But efforts to improve dam safety are not complete; about half of the dams that should have EAPs do not (Altinakar et al., 2008; see Box 3.2), and there is a backlog of safety repairs to be addressed. Moreover, improving safety needs to be a continuing and adaptive process that is responsive to changing structural and societal conditions. The concept of safety among dam and levee professionals has not evolved beyond reducing the likelihood of failure.
BOX 3.1
Dam and Levee Hazard Classification
The National Inventory of Dams (NID) hazard classification system (see Table 1) is broad, qualitative, and based on the potential threat to life and property in the event of dam failure. The criteria for inclusion in the inventory are provided in Table 2. A dam is given a "high" hazard rating if its failure can result in fatalities, whether the dam is small or large and has the potential for a single or thousands of fatalities. The rating is also regardless of its condition (e.g., its likelihood of failure). Current emphasis is appropriately on high-hazard dams, but there can be a wide disparity in the consequences of failures of these structures. Other consequences of dam failure, such as economic and environmental losses, are qualitatively evaluated and defined in equally broad terms. The hazard classification process does not include an assessment of the sociological or other effects on a community, nor does it consider the broader local and regional effects (economic and other) of the loss of a critical infrastructure (power, water supply, flood protection). Hazard classification is assigned primarily by state or federal regulatory agencies. The Federal Emergency Management Agency guidance states that classifications "should be based on the worst-case, probable scenario of failure or mis-operation of the dam, i.e., the assigned classification should be based on failure consequences that will result in the assignment of the highest hazard potential classification of all probable failure and mis-operation scenarios" (FEMA, 2004b, p. 7).
TABLE 1 Hazard Classification for Dams
|
|
||
|
LifeLikelihood of Economic, Environmental, or |
||
|
Hazard Classification |
Likelihood of Loss of Human Life |
line Loss |
|
|
||
|
Low |
None expected |
Low and generally limited to owner |
|
Significant |
None expected |
Yes |
|
High |
Probable; one or more expected |
Yes (but unnecessary for this classification) |
|
|
||
SOURCE: FEMA (2004b).
TABLE 2 National Inventory of Dams, Dam or Reservoir Size Criteria
|
|
||
|
Categorya |
Criteria |
Excluded |
|
|
||
|
Dam height |
Over 25 ft |
6 ft or lower, regardless of reservoir capacity |
|
Reservoir size |
At least 50 acre-ft |
Maximum, 15 acre-ft or less, regardless of dam height |
|
Hazard |
Any dam that poses a man life or property in “significant threat to hu- the event of its failure” |
|
|
|
||
_____________
aHeight is measured from the dam crest to the downstream toe; size is reservoir impoundment capacity. SOURCE: USACE (2011a).
Before a community can address risks associated with dam or levee failure, it must know that a dam or levee is present and poses risk. Information on dam and levee location, physical properties (e.g., size and type), design requirements, ownership, maintenance responsibility, and regulatory framework is critical for understanding the hazards and risks
associated with the infrastructure. The National Inventory of Dams (NID) and the National Levee Database (NLD) were established to provide information about dams and levees in the country. The next sections describe those inventories and information in them about dam and levee physical infrastructure and ownership.
National Inventory of Dams
The National Dam Inspection Act of 1972,3 passed after the failure of multiple dams, required the U.S. Army Corps of Engineers (USACE) to create the NID. The first version of the NID was delivered in 1975, and is generally updated on a 2-year cycle (the last update was in 2009).4 Since 1975, the NID has been managed by USACE or the Federal
_____________
3See Public Law 92-367 (available at npdp.stanford.edu/ndia.html).
4See damsafety.org/media/Documents/PDF/2009NIDupdate_March2010.pdf.
BOX 3.2
Emergency Action Plans
An Emergency Action Plan (EAP) identifies the actions and responsibilities of different parties in the event of an emergency, including uncontrolled flow from a reservoir or other controlled waters. As defined by FEMA (1998, p. 3), an EAP for a dam is
a formal document that identifies potential emergency conditions at a dam and specifies pre-planned actions to be followed to minimize property damage and loss of life. The EAP specifies actions the dam owner should take to moderate or alleviate the problems at the dam. It contains procedures and information to assist the dam owner in issuing early warning and notification messages to responsible downstream emergency management authorities of the emergency situation. It also contains inundation maps to show the emergency management authorities the critical areas for action in case of an emergency.
The requirements for EAPs are established by dam safety regulatory agencies at the national level, by such individual agencies as the Federal Energy Regulatory Commission, or by individual states. Figure 1 indicates that 48 percent of high-hazard dams that should have EAPs do not (Altinakar et al., 2008). Figure 2 indicates that about 71 percent of significant-hazard dams do not have EAPs (Altinakar et al., 2008). EAP oversight occurs primarily at the state level, but EAPs are examined by the Association of State Dam Safety Officials and the National Dam Safety Review Board. The latter two organizations have no authority to mandate revisions of EAPs to make them more effective, and state agencies often operate under tight budgets, making EAP oversight a challenge. Nevertheless, EAPs serve important functions for the dam owners and the broader community. Consequences of not having an EAP have been demonstrated, for example by the 1982 failure of the Lawn Lake Dam in the Rocky Mountain National Park in Colorado which caused the deaths of three people and $31 million in damage (NPS, 2004). A district court found that the government “in creating this relationship with citizens, also creates a duty for itself to develop orderly procedures for dealing with emergencies.”a
EAP effectiveness is dependent on the correctness of the underlying assumptions (e.g., accurate estimation of risks and appropriate responses), reasonable care in the regular review and modification of plans, and appropriate education and training of those with responsibility in the execution of the plan.
____________
aSee Coates v. United States, 612 F. Supp. 592 (C.D. Ill. 1985).
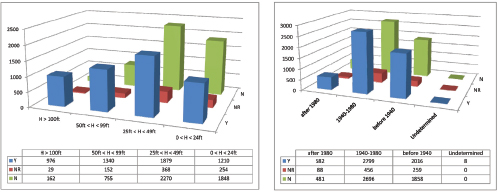
FIGURE 1 (a) Classification of high-hazard dams by height vs status of EAPs. (b) Classification by age vs status of EAPs. Based on entries in National Inventory of Dams as of September 28, 2008. Y = Yes, EAP exists; NR = EAP not required; and N = No, EAP does not exist. SOURCE: Modified from Altinakar et al. (2008). Used with permission from the authors, copyright 2012.
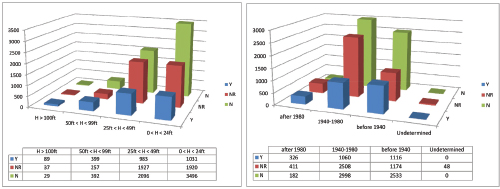
FIGURE 2 (a) Classification of significant-hazard dams by height vs status of EAPs. (b) Classification by age vs status of EAPs. Based on entries in National Inventory of Dams as of September 28, 2008. Y = Yes, EAP exists; NR = EAP not required; and N = No, EAP does not exist. SOURCE: Modified from Altinakar et al. (2008). Used with permission from the authors, copyright 2012
Emergency Management Agency (FEMA). It is currently maintained and updated by USACE. Before the September 11, 2001, terrorist attacks on the United States, the NID was freely accessible online and distributed on CD. The NID is still online,5 but information on hazard classifications, locations of nearest downstream towns, and dam conditions are password protected and not available to nongovernment users.
The NID includes information about the location, physical characteristics, dam type, foundation type, designer, owner, and hazard-potential classification of about 84,000 dams. Dams in the database are more than 25 ft high, hold at least 50 acre-ft of water, or are considered to pose a significant hazard if they fail (USACE, 2011a). Dams included in the NID meet the criteria listed in Table 2 of Box 3.1. The hazard-class distribution of all dams in the NID is shown in Figure 3.1. High-hazard dams (at least one death expected in the event of failure) make up almost 17 percent of the inventory. Some 31 percent of the dams in the inventory (those classified as having high or significant hazard potential) are expected to result in economic, environmental, and lifeline losses in the event of failure. Because the states have primary regulatory authority over dams, and because they have different criteria for defining the dams they regulate, the available information on dams that meet the NID criteria varies. Figure 3.2 shows the distribution of dams in the NID. Box 3.3 provides some statistics about the nation’s dams derived from the NID.
Since its development, there have been concerns about the accuracy and completeness of the NID. Recently, for example, the state of Washington conducted a focused survey to identify nonpermitted dams that should be in the inventory and regulated by the state (Johnson, 2010).6 The survey identified 28 dams classified as high-hazard dams (including 11 that had safety deficiencies requiring immediate attention) and 11 classified as significant-hazard dams. According to Washington state, high-hazard dams are those whose failure would place three or more homes at risk downstream, and significant-hazard dams one or two homes.7
National Levee Database
The NLD is less mature than the NID, having been initiated as a result of the National Levee Database Authority (Public Law 109-148) following Hurricane Katrina. The NLD was constructed and populated under the authority of USACE and made available online to the public on October 27, 2011. To date, it contains information only on USACE levees. Although the National Levee Database Authority calls for inventorying all levees in the country, state and federal funding has not been made available to gather data on nonfederal levees.
_____________
5See nid.usace.army.mil (accessed November 4, 2011).
6Washington State has jurisdiction over any dam that can impound 10 or more acre-ft of water at the dam crest.
7See WAC 173-175-130, Engineering Design Reports (available at apps.leg.wa.gov/WAC/default.aspx?cite=173-175-130).
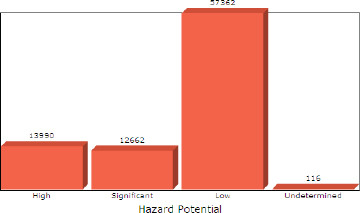
FIGURE 3.1 Hazard-class distribution of dams in the United States. SOURCE: USACE (2012).
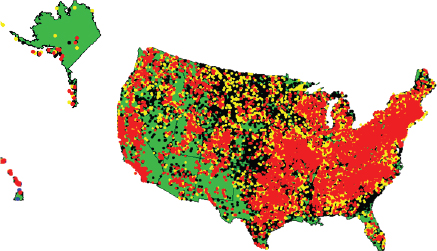
FIGURE 3.2 Distribution of dams cataloged in the National Inventory of Dams. Red dots indicate high-hazard dams; yellow dots indicate significant-hazard dams; and black dots indicate low-hazard dams. Hazard classification refers to the consequences of a dam’s failure or misoperation, not to its condition. SOURCE: USACE (2011a).
BOX 3.3
Characteristics of U.S. Dams Based on the National Inventory of Dams
About 84,000 dams are described in the National Inventory of Dams. Figures 1 and 2 show the distribution of dams by type (e.g., earth or rock embankments and concrete gravity) and by height, respectively. About half the dams are 25 ft or less in height, and the vast majority are earth embankments. Figure 3 shows the distribution of dam completion dates as listed in the NID. About one- third are older than 50 years, and by the end of this decade, about 56 percent will be older than 50 years. Figure 4 shows the distribution of dam ownership in the United States. Nearly 69 percent of dams are privately owned, and less than 4 percent are owned by the federal government. Federally owned dams, however, include many of the largest dams in the country (e.g., Hoover Dam, Grand Coulee Dam, and Bonneville Dam). Only a small percentage of dams in the United States pose a risk to communities.
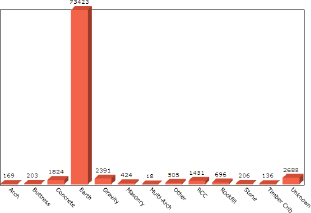
FIGURE 1 Distribution of dams by type in United States. SOURCE: USACE (2012).
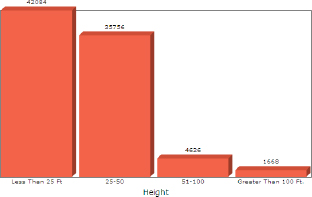
FIGURE 2 Distribution of dams by height in United States. SOURCE: USACE (2012).
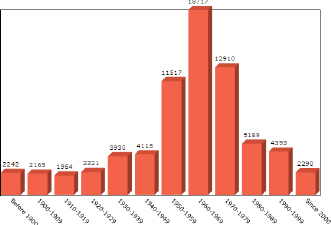
FIGURE 3 Distribution of dams by date of completion in United States. SOURCE: USACE (2012).
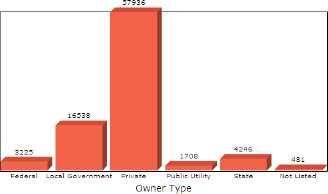
FIGURE 4 Distribution of dams by ownership in United States. SOURCE: USACE (2012).
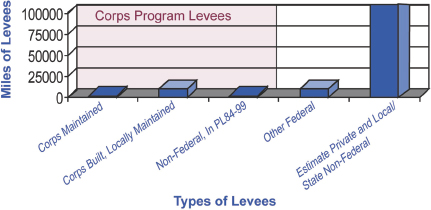
FIGURE 3.3 Distribution of levees by ownership in the United States. SOURCE: NCLS (2009).
Tens of millions of people reportedly live behind levees (NCLS, 2009).The NLD describes about 14,700 mi (22,500 km) of USACE levees.8 Little is known about the size of the national levee portfolio, especially about levees not under federal jurisdiction. It is estimated that there may be 14,000–16,000 mi (22,500–26,000 km) of levees operated by agencies other than USACE. The National Committee on Levee Safety (NCLS) estimates there may be up to 100,000 mi (161,000 km) of nonfederal levees in the nation (see Figure 3.3). Integration of levee data collected by the FEMA National Flood Insurance Program (NFIP) into the NLD, which is under way, will increase the total number of miles of levee systems in the NLD. More than 21,000 communities currently participate in the NFIP (FEMA, 2011b).
An NLD steering committee that comprises USACE and state representatives has been formed, in part, to begin integrating information on nonfederal levees into the NLD. Some states are making their own efforts to inventory levees. In California, for example, the Department of Water Resources has built a levee database of its estimated 9,000 mi (14,500 km) of nonfederal levees since 1997,9 effort on which increased after Hurricane Katrina. The inventory is about 30-40 percent complete; a target date for completion has not been set. USACE is developing guidance and providing assistance to states to improve submission of voluntary information for the NLD.
The National Committee on Levee Safety has proposed a levee hazard potential classification system, shown in Table 3.1, similar in overall structure to that for dams (NCLS, 2009). USACE has used this hazard classification system for some of its levees, but
_____________
8See www.usace.army.mil/LeveeSafety/Activities/Pages/act_nldb.aspx (accessed November 1, 2011).
9S. Ekanayake, CA DWR, personal communication, August 10, 2011.
TABLE 3.1 Proposed Hazard Potential Classification for Levees
| Hazard-Potential Classification | Number of People Potentially Inundated | Number of People Potentially Inundated to Depths of 3 ft or More | Additional Considerations |
| High | ≥10,000 | ≥10,000 | Includes areas of consequences where critical life-safety infrastructure is at risk (e.g., major hospitals, regional water treatment plants, and major power plants) |
| Significant | >1,000 | <10,000 | Includes areas of consequence where the number of people potentially inundated is low, but there may be significant potential for large economic impacts or losses |
| Low | <1,000 | 0 | – |
NOTE: These classifications use parameters and definitions consistent with those in use by other agencies. For example, California defines an urban area as having 10,000 people and subject to higher flood protection requirements (Senate Bill 5), and FEMA considers shallow flooding to be less than 3 ft (see www. fema.gov/plan/prevent/floodplain/nfipkeywords/sfha.shtm). SOURCE: NCLS (2009).
inspection ratings are not included for most levee systems in the NLD. In October 2011, the state government website Governing.com reviewed 744 levee ratings listed in the NLD: 77 percent were found to be rated “minimally acceptable,” indicating minor deficiencies that would not impair levee performance; 12 percent were rated “unacceptable,” indicating they are not expected to provide reliable flood protection; and the remaining 10 percent were rated “acceptable,” indicating they were in satisfactory condition and expected to function (Maciag, 2011). Many of the levees rated as unacceptable may be as much as 70 years old.
Frequent inspections are critical for understanding the condition of levees and the risks that they pose. Updating the NLD with new information is important not only for appropriate risk assessment but also because the NLD could influence how priorities for infrastructure funding are set. Levees operated by USACE undergo routine annual inspections and comprehensive inspections every 5 years. The NLD will be updated regularly as levee conditions change. States might not follow the same inspection schedules.
ASDSO distributed a questionnaire to individual state dam safety officials in 2006 to determine what authorities and activities to manage and regulate levee safety existed in the
states. None of the 48 that responded indicated that their states had comprehensive levee safety programs.10 The survey also revealed that only 23 states have an agency with some responsibility for levee safety, and only 10 states keep a list of levees within their borders.
Dam safety programs, in contrast, can be much more extensive, with formalized processes for dam engineering and design (including construction inspection and design requirements), periodic dam safety inspections, development of EAPs, and public outreach—all important for increasing community resilience. Programs still vary, however, in criteria and practice. For example, state and federal regulatory agencies have established requirements for periodic dam safety inspection requirements. In general, high-hazard dams are inspected annually and low-hazard dams at 5- to 10-year intervals, but inspection frequencies vary among agencies and depend on hazard classification. Vermont, for example, requires annual inspections for high-hazard dams and mandates that low-hazard dams be inspected every 7–10 years (VTDEC, 2007). Massachusetts has additional inspection guidelines for dams based on size and has an inspection frequency range of 1–10 years (ASDSO, 2000).
The next sections highlight aspects of engineering, design, and public relations in dam safety programs, generalizing some current practices and their contributions to resilience.
Engineering and Design
Deterministic standards-based approaches dominate dam and levee design in the United States; they focus on the engineering design of system components (in the case of dams, e.g., superstructure, gates, intake towers, and spillways). Current standards suggest that hazards be characterized using either deterministic approaches (design flood) or probabilistic approaches (flood based on return period), but uncertainty of structural or system performance is dealt with by using factor of safety approaches rather than probabilistic reliability. Further, standards in place do not take into account infrastructure performance. Factor of safety approaches are limited because uncertainty is not quantified and because they are based on assumptions about relevant failure modes. For example, floodwall levee systems along the outfall canals in New Orleans were designed with a factor of safety of 1.3 (about a 30 percent overdesign to accommodate surprise or unknowns). The failure mode that actually caused structure breach during Hurricane Katrina was not considered in the design—the walls failed before overtopping—and the factor of safety proved inadequate (IPET, 2007b).
USACE has published multiple guidance and engineering memoranda on the design and construction of levees, but few standards are in place for levee design and operation outside of USACE. The criterion established for the NFIP has become a de facto standard for levee design and protection. Current focus on levee designs for 100-year flood protection
_____________
10M. Ogden, ASDSO, personal communication, September 7, 2011.
places communities at considerable risk for the larger but less common floods that can cause levee failure. There is a growing interest, however, in the use of risk-based methods to evaluate dams and make risk-informed decisions related to dam safety modifications. Risk-based methods can provide information concerning both the hazard (e.g., the chance of a flood) and the type and severity of consequences (e.g., loss of life, safety, and property). The U.S. Bureau of Reclamation and USACE (since Hurricane Katrina) are using risk-based methods to evaluate dam safety.
Public Relations Versus Public Involvement
Dam and levee safety programs recognize the need for public outreach and public relations; they are vital for building relationships with the broader community that can lead to community resilience. ASDSO has a developed a “model” state dam safety program that includes public relations (ASDSO, 2007). It admits that although dam safety professionals recognize the desirability of improved public relations, they “generally make no conscious effort to reach out to the public through a well-planned effort” (p. 41). Communicating with the public, according to ASDSO, includes promoting awareness of the dam safety program, including awareness among elected officials, state and federal organizations, and the regulated community. Effective programs involve the public in permitting processes if necessary and develop “a public relations contingency/emergency plan in case of incident” (ASDSO, 2007).
Such a “public relations” approach is a good first of many necessary steps in the process of enhancing community resilience. Next steps include embracing the notion of regulator and owner engagement and collaboration with public officials and the broader public to avoid or reduce the effects of a dam failure. Disasters may sometimes be unavoidable, but community-appropriate collaboration in planning of land use and development, public safety and health, economic growth, protection of the environment, and geopolitical stability (e.g., consistency in decision criteria and community priorities related to time and space) can contribute to decision making that mitigates and potentially avoids major disasters and supports effective recovery if disasters do occur (see, e.g., Mileti, 1999).
DAM AND LEVEE SAFETY GOVERNANCE
The United Nations European and Social Commission for Asia and the Pacific defined governance as “the process of decision-making and the process by which decisions are implemented (or not implemented).” This definition can be applied in the corporate, international, national, and local contexts by formal and informal actors and through structures for decision making (UNESCAP, 2012). Governing structures reflect the nature of
governance for dam and levee safety, in which shared authorities and processes involve both governmental and nongovernmental entities.
Governance is a key driver of dam and levee safety. How decisions are made and implemented control the level of risk that community members and stakeholders knowingly or unknowingly assume. The United States manages its waterways and water resources through a complex web of regulatory systems which sometimes overlap or leave gaps in management (see Box 3.4). Governance is made more challenging by variability in weather and climate around the country. Further complicating management of waterways is the fact that the country operates primarily under the system of riparian doctrine11 in the East and primarily under prior appropriation doctrine12 in the West (California operates under both doctrines). The growing influence and involvement of the private sector in water resources policy and investments also add complexity. If changes in dam and levee safety are to be made to facilitate increased regional and community resilience, governance systems will have to accommodate and facilitate those changes.
Generally speaking, most non-federally owned dams are regulated by the states. Most of the high-hazard dams listed in the NID are under the jurisdiction of the states, but state dam safety programs vary widely. States define their own regulatory jurisdiction (e.g., the height and volume of dams to be regulated), but statutes vary from state to state. Even the best programs are struggling to develop EAPs and keep up with recommended inspection frequencies. Almost all states lack sufficient funds to rehabilitate or remove unsafe dams (Galloway et al., 2011).
Federal regulatory authority for nonfederal dams is limited to the roughly 2,100 dams used for hydropower projects regulated by the Federal Energy Regulatory Commission (FERC), and mine-tailings dams regulated by the Mine Safety and Health Administration. In some cases, states have jurisdiction over dams that are also regulated by a federal agency. For example, the California Division of Safety of Dams also regulates hydropower dams, but in most states hydropower projects are excluded from the states’ regulatory authority. Federally owned dams are regulated not by an independent agency but according to the policies and guidance of the individual federal agencies that own the dams.
Governance of dam and levee safety programs is discussed in the next sections with respect to the principal laws that define responsibilities, the policies that define how responsibilities are met, and practices—standards and guidelines—that are in place to comply with policies in place to achieve “safety.” Finally, the status of the governance processes
_____________
11Riparian doctrine states that the right to water depends on ownership of land adjacent to water. AH owners have equal rights to water, and water shortages are shared among owners. See www.fws.gov/mountain-prairie/wtr/water_rights_def.htm#RIPARIAN (accessed February 7, 2012).
12Appropriation doctrine (developed primarily for arid regions) awards water rights to the earliest appropriator for beneficial use of water from a stream. See www.fws.gov/mountain-prairie/wtr/water_rights_def.htm≠APPROPRIATION (accessed February 7, 2012).
BOX 3.4
Complexity in River Basin Management
The following statement is extracted from Managing and Transforming Water Conflicts (Delli Priscoli and Wolf, 2009, p. 135), in which the authors describe the types of river basin organizations that exist or have existed in North America and around the world. It is indicative of the political framework that has shaped dam and levee safety governance.
The United States of America is a federal system. The states are sovereign entities and they have control over water resources. Like other large countries in the world, river basin operations and organizations revolve first around the alignment of powers among these sovereign entities, which rar ely fit river boundaries. Second, they revolve around the exercise of bureaucratic power within the federal and state governments. Multiple agencies work with water usually within their own mandates and sector.
However, there are major federal interests affecting water distribution and use. Beyond interstate commerce, federal control over water has been established in a variety of areas, such as for emergencies, flood control, irrigation, public health, environmental issues, and fish and wildlife. Many of these interests have been institutionalized in numerous federal agencies, which present a formidable coordination task. Complex formulas for the mix of federal and state money in water resources development have evolved for different project purposes and water uses, such as flood control, navigation, recreation, water supply for irrigation, and hydroelectric power.
is examined as it may be related to regional and community resilience. Governance with respect to legal liability will not be discussed in this chapter, but the committee recognizes how influential liability concerns can be with respect to dam and levee safety programs and decision making (see Box 3.5).
The Legal and Policy Framework
Numerous federal committees and professional associations in the United States have missions that include shaping dam safety policy and identifying and disseminating best practices. There is fragmentation of authority and responsibility across federal agencies and among states and private dam owners. These organizations often send mixed or incomplete messages to local and state programs that find themselves with too many responsibilities and too few resources. There are uniform federal guidelines, but these are not mandatory when most dams are state regulated. State laws and authorities vary greatly. The National Dam Safety Program (NDSP) facilitates collaboration among federal agencies, states, and
BOX 3.5
Liability and Safety
Liability for flood damages resulting from dam and levee failure is an important consideration in decision making related to dam and levee safety. According to Edward A. Thomas, author of a paper on liability for damage due to the failure of flood control infrastructure for the Association of State Floodplain Managers, "strict liability for damage caused by the release of water from a water control facility is the general rule of law in the United States" (Thomas, 2006). Strict liability means that any financial loss due to the failure of a water control facility as a result of inadequacies in design, construction, operation, or maintenance will be subject to compensation by the owner or operator.a In determining legal liability, the argument often revolves around the analysis of negligence of reasonable care that "either prevent[s] or minimize[s] risks of an accident or the resulting injuries" (Binder, 2002).
Exposure to liability is a strong incentive for safety programs to limit risk. According to Jon A. Kusler, managing exposure to liability includes giving due consideration to reducing residual risk of flooding due to storm events that exceed the design parameters of dams and levees (Kusler, 2008). Kusler also notes other ways of reducing potential liability, including incorporating wide safety factors in the design of dams and levees, informing local governments and owners and occupants of property in the floodplain of risks, and taking care in dam and levee maintenance. But such considerations beg questions such as how much should safety factors be widened? Lack of quantification and design standards may expose safety professionals to unjust liabilities and compel them to make overly conservative and costly decisions, or to take no action at all if the cost is too great.
____________
aIn some cases, awards for damages can run to hundreds of millions of dollars, as occurred in California when Central Valley levees failed catastrophically (see Paterno v. State, 113 Cal. App. 4th 998,(2003) review denied, March 17, 2004).
owners, and provides a means of supporting research and development, training, and grants, but it does not mandate uniform standards.
States also are the primary regulators of levees, often through local or regional entities such as levee boards, water boards, and private owners. There is no national levee safety program to allow collaboration and unification of levee safety standards, authorities, or management. The regulatory structure for levees is growing stronger with increased emphasis by federal agencies, but state programs remain nonexistent, fragmented, or dependent on local levee boards or local governments for management. They generally lack authority to enforce needed zoning or land-use management to control development in floodplains.
All states but one have formal dam safety programs tied to federal guidelines (Alabama does not have a dam safety program). Some state dam safety initiatives predate the 1979 national dam safety initiatives. The California State Dam Safety Program was established in 1929 (FEMA, 2004c). Ohio first enacted dam safety laws in 1963, requiring construction
permits for new dams.13 Ohio’s law was revised in 1969 to require periodic inspection of dams, and the revised law included levees.
Professional associations have a role in assisting strategy development that could ultimately create an environment more conducive to enhancing community resilience. The Association of State Floodplain Managers (ASFPM)14 and the National Association of Flood & Stormwater Management Agencies (NAFSMA),15 for example, are both national-level nongovernment organizations that examine floodplain issues such as levee management and safety. Both have roles in policy development, training, and professional certification.
Dam and levee safety program governance in the United States is shaped by laws, policies, and practice, and is similar to the governance that has evolved for emergency response in the United States. Most of the responsibility for governance is in the hands of local and state governments. Separate and different authorities exist at each level. Dam and levee safety governance in other countries often follows a top-down model. The complexities of multiple layers of government, private owners and operators, multiple supporting agencies at each level, and many interdependencies result from legislation that prescribes how policy will be implemented.
Dam owners are ultimately responsible for dam safety and thus are the focus of effective programs and measures for safety. About 5 percent of the dams listed in the NID are owned or regulated by the federal government (FEMA, 2009). Most dams are owned privately or by the states. Organizations such as ASDSO provide a forum for cooperation and collaboration and in many respects have knitted state programs together.
The policy frameworks for dams and levees are discussed in more detail below.
DAM SAFETY LAWS AND POLICIES: HISTORICAL SETTING, ORGANIZATIONAL ROLES, GUIDANCE, AND STANDARDS
Past program emphasis has been on the physical safety and security of dam infrastructure; only secondary emphasis has been given to downstream issues or communities. The principal laws and policies that shape the governance of dam safety in the United States are provided in a simplified chronologic list in Appendix C as Table C.1. Many of the laws have been amended, and programs for flood management established in them have been reauthorized over the years. This has resulted in a complex, layered, and interwoven set of legal guidelines for dam safety. The laws and their relevant implementation policies have
_____________
13See www.dnr.state.oh.us/tabid/3322/default.aspx.
14ASFPM is an organization of professionals at all levels of government and the private and public sectors who are involved in floodplain management, the NFIP, and hazard mitigation, preparedness, and recovery. The organization's mission is to promote policy and information dissemination to minimize loss and preserve beneficial use of floodplains (see www.floods.org, accessed February 8, 2012).
15NAFSMA is an organization of public agencies that advocate for stormwater and floodwater management policy in the interest of public-service functions of its members (see www.nafsma.org, accessed February 8, 2012).
spawned a variety of initiatives and technical guidance at different levels of government and in other organizations established to facilitate dam operation and maintenance.
In 1979, President Carter signed Executive Order 12148, creating FEMA. Also in 1979, the Ad Hoc Committee on Dam Safety (1979) released the first federal dam safety guidelines for federally owned dams. The guidelines were management oriented, not technical, and remain the basic principles for dam safety. The first formal NDSP was authorized in 1986 as part of the Water Resources Development Act16 and created the NID, a first National Dam Safety Review Board (NDSRB), and provided for assistance to states.
In 1996, the National Dam Safety Program Act17 was passed, It placed the NDSP under the director of FEMA and expanded the NDSRB to advise the director. The director was given no regulatory authority over dam safety but was charged with “encouraging the establishment and maintenance of effective federal and state programs, policies and guidelines”18 National security considerations were added to the legal framework in 2002, and the program was reauthorized again in 2006.19 Since 1996, the Interagency Committee on Dam Safety (ICODS)20 has generated and released a series of guidance documents in an attempt to provide a uniform and consistent dam safety framework for federal, state, and private dam owners and regulators. The guidance, however, is not mandatory.
The nation has evolved from total dependence on dam owners to demonstrate “due diligence” with respect to dam safety in the first half of the 20th century, to the development of guidelines and regulations for the safety of federal dams in midcentury, and to guidance to encourage best practices among the states (as owners and regulators) and private owners by the end of the century. In the 21st century, dam safety remains a distributed responsibility of many agencies and owners. FEMA has oversight but no regulatory authority for implementing safety. In most cases, nonfederal owners are responsible for safety.
Table 3.2 highlights federal agencies that have responsibilities related to the safety of dams they own or regulate in the United States. As already stated, FEMA has oversight of the NDSP and provides guidelines that are the foundation of dam safety policy but has no management or regulatory authority over dam owners or operators. That responsibility is vested in individual federal agencies that construct, own, operate, and regulate dams under laws and policies as discussed above. Dams not expressly the responsibility of a federal agency—the majority in the NID—are regulated by the states. Individual agencies and the states supplement legislation and policies to reflect state management structures and financial responsibilities.
_____________
16See www.fws.gov/policy/361fw1.html.
17The National Dam Safety Act was passed as part of the Water Resources Development Act of 1996. See epw.senate. gov/dam.pdf.
19See www.fws.gov/policy/361fw1.html.
20ICODS, established in 1980, is chaired by FEMA to serve as a forum to coordinate federal activities related to dam safety and security. See www.fema.gov/plan/prevent/damfailure/partners.shtm (accessed February 7, 2012).
TABLE 3.2 Roles of Federal Agencies in Dam Safety
|
|
||
|
Agency |
Primary Roles |
Dams Under Jurisdiction |
|
|
||
|
Federal Emergency Management Agency |
Lead agency for National Dam Safety Program; chairs National Dam Safety Review Board and Interagency Committee on Dam Safety |
Does not own any dams |
|
U.S. Department of Agriculture (USDA) |
Owns or regulates dams; supports private owners with planning, design, finance, and construction |
More than one-third of dams in National Inventory of Dams (NID) are associated with USDA |
|
Department of Defense (DOD) |
Plans, designs, finances, constructs, owns, operates, and permits dams; limited to military lands with exception of USACE civil works programs |
DOD has a total of 267 dams under its jurisdiction on military lands |
|
U.S. Army Corps of Engineers |
Plans, designs, constructs, operates, and regulates dams; permits and inspects dams |
Jurisdiction over USACE dams, dams constructed by USACE but operated by others, and other flood control dams subject to federal regulation; 631 dams in the NID are associated with USACE |
|
Department of the Interior |
Plans, designs, constructs, operates, and maintains dams |
About 2,000 dams in the NID under five bureaus |
|
Department of Labor |
Regulates safety- and health- related aspects of miners |
About 1,400 dams under Mine Safety and Health Administration |
|
Federal Energy Regulatory Commission |
Issues licenses for, provides inspections of, and regulates nonfederal dams with hydroelectric capability |
2,530 dams in the NID affecting navigable waters |
|
Tennessee Valley Authority |
Plans, designs, constructs, operates, and maintains dams |
49 dams in Tennessee River Valley |
|
|
||
SOURCE: FEMA (2009).
Table 3.3 summarizes dam safety governance, guidance, and standards. The principal governance documents are provided in FEMA federal guidelines. Other guidance and standards, mostly technical, come from FERC, USACE, and the Bureau of Reclamation. A single technical specification (e.g., using the probable maximum flood for spillway design) can dominate design considerations.
There have been substantial improvements in dam safety practice, but in general, practice fails to take a systems approach in its efforts. For example, the development of the Potential Failure Mode Analysis (PFMA) process (FERC, 2005) requires a deliberate effort to systematically identify and document all potential modes of failure of a dam from all sources. PFMA is used by the Bureau of Reclamation, USACE, FERC, and others in the dam safety community, however, PFMA, as currently applied, lacks a systematic basis for relating the infrastructure-based analyses to the larger river system or to the communities at risk. Thus the utility of PFMA in terms of risk-informed decision making is limited. The PFMA process will likely continue to be used, but the practice could be improved if it evolved to recognize and address epistemic sources of uncertainty, became more detailed to address modes of failure unique to different initiating events (e.g., earthquakes), and was executed using a systems analysis approach in which interactions and interdependencies between system elements are evaluated.
Another substantial evolution in guidance provided at the federal level has been the development of a risk assessment framework for dams. It has come about particularly in a collaborative effort between USACE, the Bureau of Reclamation, and FERC. Figure 3.4 outlines the emerging Federal Dam Safety Portfolio Risk Management Process (USACE, 2011b). This process employs the Dam Safety Action Classification (DSAC), a categorization scheme ranging from “Urgent and Compelling” to “Normal” for safety-related actions. Interim risk reduction measures (IRRMs) are formulated and undertaken for dams not considered tolerably safe until more permanent remedial measures are implemented. The authority for applying risk has existed for some time (USACE, 2006); it is becoming a reality. Application of risk measures will be important in moving from deterministic standards-based approaches to estimating and applying resilience measures that include both the probability and consequence components of risk assessment.
LEVEE SAFETY LAWS AND POLICIES: HISTORICAL SETTING, ORGANIZATIONAL ROLES, GUIDANCE, AND STANDARDS
The principal laws and policies that shape the governance of levee safety in the United States are provided in a simplified chronological list in Appendix C as Table C.2. Just as for laws that define dam safety policy, many laws related to levee safety have been amended multiple times. Because the legal and policy setting for levees is less mature than that for dams, there is less definitive legislation, policy, and technical and management guidance.
TABLE 3.3 Dam Safety Governance-Related Guidelines and Standards
|
|
||
|
Responsible Agency |
Publication |
Scope |
|
|
||
|
Interagency Committee on Dam Safety |
FEMA 93: Federal Guidelines for Dam Safety, (FEMA, 2004c; reprinted from 1979) |
Federal agency owners; addresses management practices; no technical standards |
|
Federal Emergency Management Agency |
Federal guidelines for dam safety: |
Technical guidelines that augment FEMA 93 and create a big-picture framework for state dam safety programs |
|
FEMA 64: Emergency Action Planning for Dam Owners (FEMA, 1998) |
||
|
FEMA 333: Hazard Potential Classification System for Dams (FEMA, 2004b) |
||
|
FEMA 65: Earthquake Analysis and Design of Dams (FEMA, 2005) |
||
|
FEMA 94: Selecting and Accommodating Inflow Design Floods for Dams (FEMA, 2004d) |
||
|
FEMA 148: Glossary of Terms ( FEMA, 2004a) |
||
|
Federal Energy Regulatory Commission |
Chapter 14: Engineering Guidelines updated July 1, 2005 (FERC, 2005) |
Dam Safety Performance Monitoring Program and Potential Failure Modes Analysis |
|
U.S. Army Corps of Engineers |
ER 1100-2-1156, Safety of Dams—Policy and Procedure (USACE, 2011b) |
New Policy on application of risk and portfolio methods to dam safety throughout USACE |
|
Bureau of Reclamation |
Dam Safety Risk Analysis Best Practices Training Manual (USBR, 2011a) |
Summary of best practices in spectrum of technical subjects relevant to dam safety; collaborative with USACE |
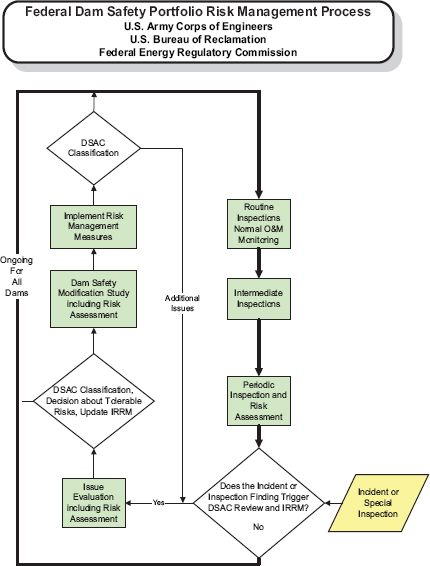
FIGURE 3.4 Schematic of emerging Federal Dam Safety Portfolio Risk Management Process. Green boxes represent routine dam safety processes executed under the federal dam safety guidelines (outer loop) or nonroutine safety processes (inner-loop). For any process, "yes" indicates further effort and another decision; "no" indicates return to routine activities. Scrutiny of a potential problem (yellow diamond) triggers a nonroutine process, and a decision made regarding if and what actions are necessary, and if actions taken have been sufficient. DSAC (Dam Safety Action Classification) depicts the degree of urgency of safety-related actions. IRRMs (Interim Risk Reduction Measures) are formulated and undertaken for dams not considered tolerably safe until more permanent remediation measures are implemented. SOURCE: USACE (2011b).
Defining legislation is emerging only recently, and is limited to the requirement to create a National Committee on Levee Safety and a proposal for a national levee safety program.
Levee safety has been a concern for most of the last century, but other than individual federal-agency programs and state-level initiatives, efforts have been ad hoc. Although intended only to be a requirement for the NFIP,21 the NFIP 100-year flood—rather than hydrograph shape and duration—has become a de facto national standard. The 100-year water elevation now serves as a baseline for many levee applications.
The 2005 authorization of the NLD and the 2007 Water Resources Development/National Levee Safety Act have placed levee safety in phase with where dam safety was in the 1980s.22 These steps constitute an initial legal and policy scaffold from which levee safety can be designed and constructed into a nationally consistent and rigorous effort (given the appropriate attention and resources). It will be crucial to bring diverse community members and stakeholders together to create a uniform structure for management and technical decision making. An important development will be the application of risk assessment.23 The NCLS (2009) has submitted a report and recommendations for policy and organization for a national levee safety program, but its recommendations remain under consideration (as of this writing).
The current Economic and Environmental Principles and Guidelines for Water and Related Land Resources Implementation Studies (P&G) are the fundamental policies that govern how federal agencies evaluate proposed water resource development projects, emphasizing national economic benefits as the primary criterion for project justification (WRC, 1983). The secretary of the Army was tasked with updating the P&G under the Water Resources Development Act (WRDA) of 2007.24 The Obama Administration is expanding the scope of the P&G to include all federal water resources agencies.25
Major responsibilities in levee safety rest with FEMA and USACE and in some cases with the states. FEMA administers the NFIP, through which it defines its responsibilities related to levees, particularly regarding levee accreditation and mapping areas protected by levees.FEMA is examining the impact of levee mapping on the NFIP, initiatives such as the Map Modernization program26 (which, among other things, establishes criteria for levee accreditation), and is examining risk-based approaches. FEMA also cochairs the National Committee on Levee Safety. USACE is responsible for the 14,700 miles of levees it has constructed, operates, and maintains, as well as levees it has constructed but are operated and maintained by others, and levees included in the Rehabilitation and Inspection
_____________
21See a www.fema.gov/business/nfip/.
22See 140.194.146.135/LeveeSafety/Documents/timeline.pdf.
23Some states are developing new flood hazard criteria. California, for example, has a draft standard in place for using the 200-year return-period peak flood as its design criterion for urban and urbanizing areas (CA DWR, 2012b).
24See www.gpo.gov/fdsys/pkg/PLAW-110publ114/content-detail.html.
25See www.whitehouse.gov/administration/eop/ceq/initiatives/PandG.
26See www.fema.gov/plan/prevent/fhm/mm_main.shtm (accessed February 8, 2012).
Program (per Public Law 84-99).27 The Secretary of the Army is responsible for carrying out activities of the new National Levee Safety Program Act.28 The USACE Director of Civil Works chairs the NCLS tasked with developing policy and recommendations for a National Levee Safety Program under that act. Their report, delivered in January 2009 remains under review by the Office of Management and Budget and, as of the writing of this report, the recommendations remain unaddressed.29 Other federal agencies, including the Department of Interior (DOI) and U.S. Department of Agriculture, have roles in levee safety. The DOI Bureau of Reclamation manages some levees associated with water supply and flood control projects and oversees levees associated with some irrigation projects that are owned and operated by others. The USDA Natural Resources Conservation Service designs levees to provide protection to support agricultural use of land (ILPRC, 2006).
Table 3.4 summarizes guidance and standards for levee safety. As for dam-related guidance, these are technical in nature and support governance by informing decisions. An important technical issue affecting governance is standards related to the extent that hazards affect design and operation. For example, USACE standards for levee design were once based on the Standard Project Flood (SPF), a flood that can be expected from the most severe combination of meteorologic and hydrologic conditions considered reasonably characteristic of the region. The SPF was often considered to be equivalent to a 300-year (or more) return-period event when plotted on an extrapolated flood-frequency curve for the location (USACE, 1965, 2006). With the acceptance of a 100-year peak flood as the standard in accordance with the NFIP, the design criterion was effectively changed (e.g., from a 300-year to a 100-year return period). More recently, USACE has been moving to risk-based design, creating a new design paradigm for the United States (USACE, 2011b). FEMA is considering incorporating risk-based standards into the NFIP; this would constitute a major shift in design guidance and standards for levees (see Box 3.6).
Given the lack of national policy, guidance, or standards for states, NFIP criteria influence management decisions via local government or community initiatives established to qualify for flood insurance. But as stated earlier, few states keep lists of levees within their borders, and about half the states have no formal authority or program at the state level for levee safety or inspection programs (as of 2006).30 Fewer than one-third of states have even modest safety programs, whose implementation is often delegated to local authorities or programs, and only about 20 percent of the states have relatively comprehensive authorities and programs. Management of levees in some states is through levee boards or similar organizations. Levee boards in Louisiana, for example, are managed through the Department of Transportation and Development and consist of community members appointed
_____________
27 See www.saj.usace.army.mil/Divisions/Operations/Branches/EmergencyMgt/programs_RIP.htm.
28 See uscode.house.gov/download/pls/33C46.txt.
29 See www.leveesafety.org/faq_committee.cfm.
30M. Ogden, ASDSO, personal communication, September 7, 2011.
TABLE 3.4 Levee-Safety Governance-Related Guidance and Standards
|
|
||
|
Date |
Responsible Organization |
Publication |
|
|
||
|
October 2010 |
U.S. Army Corps of Engineers (USACE) |
Proceedings of the Workshop, "Exploration of Tolerable Risk Guidelines for the USACE Levee Safety Program," Institute for Water Resources Report 10-R-8 |
|
April 2009 |
USACE |
ETL 1110-2-571, Guidelines for Landscape Planting and Vegetation Management at Levees, Floodwalls, Embankment Dams, and Appurtenant Structures |
|
October 2008 |
State of California |
Draft Interim Levee Design Criteria for Urban and Urbanizing Areas (200-year protection by 2015) |
|
April 2000 |
USACE |
EM 1110-2-1913, Design and Construction of Levees |
|
May 2005 |
USACE |
ETL 1110-2-569, Design Guidance for Levee Underseepage |
|
August 2010 |
USACE |
EC 1110-2-6067, USACE Process for the NFIP Levee System Evaluation |
|
August 2005 |
Federal Emergency Management Agency (FEMA) Procedure Memorandum 34 |
Procedure Memorandum 34 , Interim Guidelines for Studies Including Levees. Requires Certification Data on Levees |
|
July 2008 |
FEMA Procedure Memorandum 43 |
Procedure Memorandum 43, Guidelines for Identifying Provisionally Accredited Levees. Removes levee from NFIP if not accredited and allows provisional accreditation for 2 years |
|
October 2002 |
44 CFR § 65.10 |
Section 65.10 of National Flood Insurance Program Regulations: FEMA guidance on mapping areas protected by levee systems (not risk based) |
by the governor. Louisiana has a state association of levee boards, ostensibly to coordinate activities of all Louisiana levee boards.31 Of formal state levee-safety programs, California’s, in its Department of Water Resources, appears to be the most advanced (see Box 3.7).
_____________
31See www.albl.org (accessed February 8, 2012).
BOX 3.6
Uncertainty in Hazard Characterization
The uncertainty in hazard characterization is increasingly recognized in applying risk-based procedures (and setting policy related to their use). Calculations of the frequency of flood events, for example, are improved with larger, accurate, and complete historical-event databases. The greater the number and accuracy of events in the database, the smaller the uncertainty in the estimate of the frequency of future events. This can be demonstrated through the calculation of return-period frequency of hurricanes in the Gulf of Mexico.
Hurricane return-period calculations have long been based on the atmospheric pressure at the hurricane center (its central pressure). Table 1 illustrates the change in estimated return period for a storm like Katrina, given the size of the historical-event database. The return period of a hurricane with a central pressure and maximum wind speeds similar to those of Hurricane Katrina would have been calculated at 900 years by using the historical database as of 1959, but at only at 98 years on the basis of the historical record as of 2005 (Irish et al., 2008). In addition, the use of central pressure alone, as was previously done, is not adequate to characterize the surge generation potential of a hurricane. It is necessary to consider both central pressure (storm intensity) and radius to maximum winds (physical size) of the storm to represent its ability to generate storm surge. Therefore, using the Saffir-Simpson Scale (representing the intensity of sustained winds) as a basis of characterizing return period relevant to surge levels is inadequate.
In the 1960s, the levee systems for hurricane protection around New Orleans were designed according to the USACE criteria that, at the time, were thought to accommodate a 200- to 300-year event. The uncertainty analysis conducted by IPET (2009) as a component of the risk assessment of the levee and floodwall systems in place during Katrina estimated that the system had a mean failure period of 40-50 years (caused by catastrophic breaching, given the 2005 knowledge base of hurricane hazards in the gulf).
TABLE 1 Variability of Return Period of Hurricane Hazard in Gulf of Mexico
| Publication (Year) and Period of Record | |||
| Meteorological Parameter | U.S. Weather Bureau Tech Report 33 (1959) 1900-1956 | National Weather Service Tech Report 23 (1979) 1900-1975 | National Oceanic and Atmospheric Administration and National Climatic Data Center Preliminary Analysis (2006) 1900-2005 |
| 100-year central pressure index (millibars) | 934.6 | 926.2 | 901.7 |
| 100-year peripheral pressure (millibars) |
1,013.2 | 1,008.1 | 1,007.9 |
| Return period for a storm of Hurricane Katrina intensity (905 mb) (years) | 900 | 285 | 98 |
SOURCE: IPET, (2007a, 2009).
BOX 3.7
Levee Safety in California
California has a highly developed levee safety program. The Division of Water Management in the California Department of Water Resources (DWR) was established in 1977 and is divided into five offices responsible for forecasting, integrated environmental stewardship and flood management, design and construction of flood control projects, rehabilitation of California system levees, and operation and maintenance of federally constructed flood control structures.a The California FloodSAFE initiative, formulated in 2007, is aimed at more effective floodplain management, risk reduction, and development of a comprehensive, systemwide flood management plan for the Central Valley of California.
A major tenet of the FloodSAFE initiative is to require that building codes include flood damage-reduction measures for the estimated 200-year floodplain.b This applies to areas protected by facilities of the Central Valley Flood Protection Plan where flood depths exceed 3 ft for the 200-year flood event (0.5 percent annual chance of flood). Code updates are planned in cycles and include such measures as requiring flood evacuation locations to be above the 200-year water-surface elevation, and requiring that flood vents be designed to reduce the potential for structural collapse (by reducing hydrostatic differential on walls).c FloodSAFE also includes preparation of 200-year flood inundation-area maps and flood information for owners and residents. The program is the focal point of the Division of Flood Management in the DWR. Resources in the DWR have been divided into seven "functional areas" as depicted in the figure to prepare for implementation of the program. Limited financial resources will be the major challenge for full implementation of FloodSAFE.
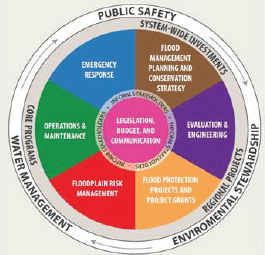
Organization and alignment of DWR resources to prepare for the implementation of the DWR FloodSAFE initiative. SOURCE: CA DWR (2012a).
____________
aSee www.water.ca.gov/floodmgmt/ (accessed March 8, 2012).
bSee www.ca.gov/floodsafe/ (accessed March 8, 2012).
cSee www.water.ca.gov/BuildingCod (accessed March 8, 2012).
This page is blank


