
A Plan for Implementing the AEO
The panel was convened to investigate the technical and operational feasibility of using data from the American Community Survey (ACS) to expand the availability of free school meals under a new special provision of the National School Lunch Program (NSLP) and School Breakfast Program (SBP). Under an ACS Eligibility Option (AEO), the ACS would provide estimates for the development of claiming percentages for use by the U.S. Department of Agriculture (USDA) in reimbursing school districts for the federal government’s share of the costs of providing free school meals to all enrolled students in participating schools. Expanding the availability of free meals would likely lead to increased participation by students, which in turn could well lead to such desired outcomes as improved nutrition, health, and school performance.
Another benefit of using the AEO would be sparing families and school districts the burden and costs of completing and processing annual application forms. In contrast, two existing special provisions, Provisions 2 and 3, require periodic administration of applications to provide the baseline for claiming percentages for the next 3-4 years (unless it can be demonstrated that economic conditions have not changed substantially). The Community Eligibility Option (CEO), which is currently being pilot-tested in districts in three states, requires less paperwork than Provisions 2 and 3, but it requires direct certification (determination of eligibility on the basis of matching to lists of participants in other programs for low-income families and children) at least every 4 years. The major disadvantage of the CEO is that it can be used only by districts or
schools with 40 percent or more of enrolled students who are identified as eligible for free meals through direct certification or the use of local lists of categorically eligible students. According to the form FNS-742 data set for 2009-2010, only 3.5 percent of school districts would be eligible to adopt the CEO districtwide, although it is more widely applicable for schools or groups of schools.
Because school districts must use nonfederal funds to make up any difference between their costs and the USDA reimbursement, Provisions 2 and 3, the CEO, and the AEO are likely to be most attractive to schools with high percentages of students eligible for free or reduced-price meals. Assuming for the sake of illustration that the AEO would appeal to school districts with 75 percent or more eligible students, then according to Table 3-1 in Chapter 3, the AEO might be attractive to as many as 1,291 districts.1 These districts are a relatively small percentage (10 percent) of the total number of districts nationwide, yet they enroll a larger percentage of total students (13 percent). Table 5-1 shows that of the districts that reported operating under Provision 2 or 3, not in a base year, in the FNS-742 data set for 2009-2010, 296 (79 percent) had implemented the provision districtwide. Of these districts, 69 percent had 75 percent or more of students certified for free or reduced-price meals, while the others were almost evenly split between those with 50 to 75 percent of students eligible for free or reduced-price meals and those with 50 percent or fewer of students eligible. Although this evidence supports the statement that the AEO may appeal to districts with free or reduced-price eligibility percentages greater than 75 percent, it also shows that there must be reasons why districts with smaller percentages of free- and reduced-price-eligible students may choose to participate. The panel observes further that because many districts with less than 75 percent eligible students districtwide include some schools that exceed the 75 percent cutoff, still more students could benefit from a universal free meals program should these districts adopt the AEO for a subset of their schools.
The panel’s original expectation regarding the AEO was based on the assumption that the U.S. Census Bureau would be able to estimate accurate ACS-based claiming percentages straightforwardly for every school district in the United States, and the Food and Nutrition Service (FNS) would allow districts to use the ACS-based estimates to claim reimbursements under a universal free meals option. With a universally applicable method providing accurate estimates, districts that wanted to adopt the AEO districtwide could proceed with confidence that the ACS estimates would be satisfactory. As with Provisions 2 and 3, districts could determine whether the benefits of implementation would outweigh the
____________
1 Some of these districts are likely to be participating in Provision 2 or 3 already.
TABLE 5-1 Districts Operating Under Provision 2 or 3 in 2009-2010, Not in a Base Year
| Percentage Free or Reduced Price | ||||
| Less Than or Equal to 50% | Greater Than 50%, Less Than or Equal to 75% |
Greater Than 75% | Total | |
| Districtwide | ||||
| Number | 34 | 29 | 233 | 296 |
| Percentage | 11 | 10 | 79 | |
| Some Schools | ||||
| Number | 43 | 61 | 31 | 135 |
| Percentage | 32 | 45 | 23 | |
| Total | 77 | 90 | 264 | 431 |
| Total Districts in United States | 12,257 | |||
| Percentage of Total Districts Under Provision 2 or 3 | 4 | |||
SOURCE: Prepared by the panel.
costs in their own situations. Should adoption of the AEO for a subset of schools be preferable to districtwide adoption, the district would have to complete an additional step of providing geographic boundaries for the applicable school attendance areas to the Census Bureau, which would prepare ACS estimates for those areas.
As demonstrated in the preceding chapter, however, ACS estimates are not sufficiently accurate for use in a one-size-fits-all version of the AEO. The remainder of this chapter briefly summarizes the reasons why the panel’s initial goal of a universal method could not be achieved and then provides a detailed description of a tailored approach to implementing the AEO for consideration by FNS. In the subset of districts that decides to investigate the AEO and for which accurate claiming percentages can be developed, it might still be possible to achieve the AEO’s advantages of providing universal free meals and eliminating applications. The panel’s recommendations for research and development in Chapter 6 are directed toward improvements in data and estimation methods that would enhance prospects for using the AEO more widely in the future.
The panel’s initial goal was to identify a universally applicable method for estimating ACS-based claiming percentages and, if sufficient data on school district costs and increased participation under a universal free meals program could be obtained, to specify when it would be cost-beneficial for a school district to adopt the AEO for some or all of its schools. With regard to ACS-based claiming percentages, we anticipated that one or more simple adjustments might be needed to account for consistent differences between ACS eligibility estimates and administrative estimates derived from the application and certification processes conducted by districts.
As noted earlier, the data the panel collected and the extensive analyses we undertook did not enable us to recommend a universally applicable method for implementing the AEO for the school meals programs. This conclusion should not be taken as a general indictment of the ACS, which was not designed specifically to support the school meals programs but as a multipurpose survey covering a variety of subject areas. Moreover, the significant variations in school district characteristics, such as enrollment size, populations served, and organization (for example, open enrollment and charter schools) make it unlikely that any general-purpose survey could serve as the basis for a universally applicable new special provision. That being said, the quality of the ACS reporting of income and program participation could undoubtedly be improved, and our findings identify promising areas for research and development to that end (see Chapter 6).
Systematic Differences
The first, and most important, impediment to a universal, one-size-fits-all approach for the AEO is that in districts with more than 50 percent of students eligible for free or reduced-price meals, ACS direct estimates,2 when compared with administrative estimates for all such school districts and for all the schools in the panel’s five case study districts, generally understate the percentage of students eligible for free meals and overstate the percentages eligible for reduced-price and full-price meals. This pattern of differences is especially pronounced in districts and schools with very high percentages (75 percent or more) of students eligible for free and reduced-price meals, which are precisely those districts most likely to be interested in the AEO if accurate claiming percentages could be
____________
2 For small districts, for which the gains in precision from model-based estimates are greatest, the systematic differences between model-based and administrative estimates are substantially larger than the systematic differences between direct and administrative estimates.
developed. Moreover, the differences between administrative and ACS estimates of students eligible for free and reduced-price meals likely vary substantially among school districts. Consequently, despite extensive investigation, we were unable to develop a set of universally applicable adjustments to ACS-based estimates of students eligible for free and reduced-price meals that would achieve reasonable consistency with administrative estimates from the current certification process. As described in Chapter 4, many factors appear to underlie the differences between the ACS estimates and administrative data (including errors in those data), and the importance of each factor varies among districts.
Sampling Variability
In addition to the systematic differences between ACS eligibility estimates and administrative data, the ACS estimates exhibit sampling variability, which could cause claiming percentages and reimbursements to fluctuate excessively from year to year. However, the panel found that while 1-year ACS estimates are more variable than the administrative estimates to which districts are accustomed, 3- and 5-year ACS estimates are less variable than administrative estimates for large districts. For typical medium-sized districts, the ACS 3-year estimates have about the same variability as administrative estimates, and the 5-year estimates have less variability. For small districts with enrollments of at least 400 students, the 5-year ACS estimates would be somewhat more stable than administrative estimates; for smaller districts, however, the ACS estimates might be less stable than administrative estimates.
Timeliness Bias and Overall Accuracy
The 5-year ACS estimates are less variable—that is, more stable—over time than the 1-year and 3-year ACS estimates. However, because the 5-year estimates average the most recent data with older data over a 5-year period, the 5-year estimates are less responsive to real changes in socioeconomic conditions, such as those occurring during the recent “Great Recession,” than the 1- and 3-year estimates. Likewise, the 3-year estimates are more stable but less responsive to changes than the 1-year estimates.
School food authority directors who participated in the panel’s workshop (refer back to Chapter 3) indicated that the stability of claiming percentages from year to year was generally more important than their timeliness. The reason is that dramatic changes in claiming percentages due to sampling variability or a rapid improvement in economic conditions (or both) would leave a school district scrambling for funds if a large drop in federal reimbursements occurred. (Of course, changes in claiming percentages that increased reimbursements would benefit the district.)
This concern leads to a preference for using ACS estimates based on more rather than fewer years of data even though the estimates would be less reflective of current economic conditions. This preference is reinforced by our finding that for medium-sized districts, 5-year estimates are likely to be more accurate than 3-year estimates when one takes into account error from both variability and timeliness bias. For large districts, both 3-and 5-year estimates are likely to be more accurate than 1-year estimates, although whether the 3- or 5-year estimates are more accurate is less clear. Based on these findings, we outline below how a school district might approach the stability-timeliness trade-off in evaluating the AEO.
Calculation of Costs and Benefits
Because of a lack of sufficient data, the panel was unable to develop universally applicable estimates of the expected additional costs due to offering free meals to all students versus the savings due to eliminating the application, certification, and verification processes and to economies in the meal-serving process (such as eliminating the need to count meals by eligibility category or to collect money). The data available to the panel suggest that the net costs would likely vary significantly among school districts.
Also because of a lack of data, the panel was unable to develop universally applicable estimates of the expected increase in participation among students in different eligibility categories (free, reduced-price, full-price) under a universal free meals program. Accurate estimates of participation by category are essential not only for estimating claiming percentages that accurately reflect changed participation patterns so the federal government appropriately reimburses school districts, but also for accurately calculating the net costs to school districts of implementing universal free meals. Our suggested approach for implementing the AEO accommodates the lack of data on changes in participation by using the same mechanism used for Provision 2—namely, using a base year during which all meals are served free, but applications are taken, verifications are conducted, and reimbursement is based on meal counts by category. The base-year participation rates will reflect any changes in participation due to providing free meals to all students, and they can be used in conjunction with ACS eligibility estimates for establishing claiming percentages.
Of course, a full cost-benefit calculation also needs to account for nonpecuniary benefits, such as an improved environment in the cafeteria due to elimination of stigma and improvements in diet quality that may ultimately lead to improvements in student health and school performance. There may also be nonpecuniary costs, such as possible dissatisfaction among some stakeholders because of perceived increased costs for
universal free meals. At the panel’s workshop, some of the participants representing school districts indicated that they would probably consider only districtwide adoption of the AEO to reflect public opinion in their districts, while others would probably consider implementing the AEO only in some schools. All of these officials, however, emphasized that their district would need to “run the numbers” to determine whether the AEO was financially viable in terms of the district being able to cover the costs of the meals programs through federal reimbursements and other sources of funds while providing free meals to all students attending schools in which the AEO might be adopted.
As noted above, the AEO proposed by the panel, like Provision 2, begins with a base year during which districts collect applications, conduct verifications, and count meals but feed all students free of charge. Reimbursement in the base year makes use of meal counts by category, as in the traditional approach. ACS eligibility estimates and the district’s own administrative data for a minimum of 4 years (including the base year) are used to compute benchmarked ACS claiming percentages that are used to determine reimbursements in future years, when all meals are free. The benchmarked ACS claiming percentages are updated annually when the new ACS data become available.
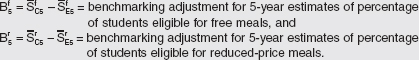
The benchmarking approach proposed by the panel automatically adjusts for systematic differences between the ACS estimates and a district’s administrative data. As discussed in Chapter 4, many of the reasons for these systematic differences relate to issues affecting the ACS estimates, particularly in high-poverty areas: underreporting of Supplemental Nutrition Assistance Program (SNAP, formerly the Food Stamp Program) benefits; use of annual rather than monthly income to determine eligibility; omission of students who live in group quarters or nontraditional housing; differential inclusion of part-time residents, such as migrant workers, who live in traditional housing; and school choice. Benchmarking is likely to remove these causes of systematic errors. Because it is based on certification data, however, benchmarking can perpetuate the effects of certification error. That is, if certification error is present in a district’s administrative data, it will continue to be present in AEO benchmarked estimates. Furthermore, all else being equal, the AEO will be more attractive to districts with higher levels of overcertification.3
____________
3 Further research could be undertaken to develop an approach for adjusting administrative estimates to remove certification error. Prior to approval of a district’s request to adopt the AEO, FNS might want to review the district’s verification results and consider corrections to the district’s benchmarking adjustments for certification error.
This section provides an overview of the implementation of the AEO, beginning with the provision of ACS tabulations for school districts to use in deciding whether to adopt this new provision. The approach discussed here requires one or more interagency agreements between the Census Bureau, FNS, and possibly the National Center for Education Statistics (NCES) addressing schedules for activities, resources to be devoted to those activities, and other issues that ultimately will determine whether the panel’s recommended methods and procedures are operationally feasible. FNS and states will need to provide technical assistance to school districts, including the AEO Calculator, a web-based tool or spreadsheet designed to perform all calculations proposed by the panel (described in further detail below).
The AEO, like other special provisions for the school meals programs, would be offered as an option for districts. It would not be imposed universally or on any particular district. Therefore, each district would have to make its own decision about whether to adopt the AEO. The decision a district makes and the effects of that decision will be independent of what other districts decide because the reimbursement of districts under the school meals programs is different from the allocation of funds under a program that has a fixed amount to allocate. In the latter case, one jurisdiction’s gain is another’s loss, whereas in the school meals programs, one district’s reimbursement does not affect that of any other district. To determine whether to adopt the AEO, a district would weigh the benefits and costs of this new special provision in its own socioeconomic and political context.
For a school district to adopt the AEO, it must be confident that ACS-based claiming percentages will satisfy its own requirements for stability over time and for reimbursements large enough to cover costs when combined with other available funds. From a federal perspective, however, reimbursements should not be excessive; to control total program costs, amounts should be consistent with eligibility and participation as established by law. The requirement that reimbursements be sufficient but not excessive implies, above all, that the estimated claiming percentages must be reasonably accurate for a district or subset of schools adopting the AEO. As described in more detail below, it will be important for FNS to monitor the accuracy of ACS eligibility estimates, the accuracy of administrative certification estimates, and the accuracy and stability of differences between ACS and administrative estimates. If FNS detects substantial changes, the causes and implications of such changes will need to be investigated.
Derivation and Provision of ACS Estimates at the School District Level
Under the proposed AEO, FNS will arrange with the Census Bureau to provide annually for each school district in the country ACS direct estimates and the associated standard errors for the percentage of students in each eligibility category—free, reduced-price, and full-price— prepared according to the panel’s specifications (as updated based on further research). FNS should request that 1-year, 3-year, and 5-year school district-level estimates for all past ACS years, from 2005 through 2011, be made public in 2013, with new estimates being released annually thereafter. Clear lines of communication and authority must be established among FNS, states, local authorities, and the Census Bureau if this new approach is to work effectively. Moreover, there are financial implications, probably for FNS, of commissioning a new set of services from the Census Bureau.
The Census Bureau maintains up-to-date school district boundary information and already provides special tabulations of the ACS for school districts to NCES. The Census Bureau also provides estimates from its Small Area Income and Poverty Estimates (SAIPE) Program for all school districts included in its geographic database. Hence, it should be relatively straightforward for the Census Bureau to prepare estimates for school districts according to the panel’s specifications.4
The AEO Calculator
The panel envisions that FNS will provide the AEO Calculator, a web-based tool for districts to use in analyzing the feasibility of the AEO, calculating benchmarked ACS eligibility percentages, and calculating claiming percentages for use under the AEO. The AEO Calculator will enable separate analyses for the NSLP and the SBP, although bench-marked eligibility rates will be the same for both programs. Claiming percentages will be computed using the same eligibility percentages but program-specific participation data. The AEO Calculator also will enable districts currently operating under Provision 2 or 3 to determine whether it would be advantageous for them to switch to the AEO. The AEO Calculator will make district-level ACS estimates available. Districts will need to enter their own certification and participation data, and the Calculator will guide them as to the data that are needed. Ideally, the Calculator will also be a useful tool for FNS and districts to use in communicating about
____________
4 Optimally, NCES and FNS would coordinate their tabulation requests, and both agencies would use the panel’s specifications for eligibility estimates for school meals.
the AEO. For example, a district might inform FNS through the Calculator that it was interested in participating in the AEO and provide FNS with all of the input and calculated output from the Calculator for approval and accountability purposes.
District Assessment of ACS Estimates
School districts will have to be comfortable with a decision to implement the AEO because once a community has become accustomed to a universal free meals program with no application requirements, it will be difficult to retreat from that decision—a point made by the district officials participating in the panel’s workshop based on their experience with Provision 2. To minimize financial uncertainty, districts must be able to envision new operating systems and accurately estimate changes in operating costs and participation.5 Many state and local financial systems do not appear to collect data at an appropriate level of detail to support the development of sound cost and savings estimates. Moreover, many districts appear to lack experience and expertise in large-scale systems change. These factors appear to make districts risk adverse and likely to persist in old ways of doing business. Since use of ACS estimates may be perceived as a more radical departure from the current application and certification processes than the existing special provisions, local hesitancy to adopt the AEO may be magnified. This possibility argues for outreach and technical assistance from the federal government. It also argues for a strong state agency role. Many districts reported to the panel that their state officials did not provide useful information or technical assistance regarding implementation of the existing special provisions. In some cases, states appeared to actively discourage their use. On the other hand, some states, such as Texas, have successfully promoted the use of special provisions and serve as a model in this regard.
A district considering whether to implement the AEO would compare the impact of using the AEO relative to the current method. To this end, the district would enter multiple years of its own administrative data into the AEO Calculator. The AEO Calculator would produce benchmarked estimates—that is, estimates adjusted to reflect local circumstances, such as a large migrant population or other systematic differences between the ACS data and local administrative data. The district would assess the relationship among district administrative data, the ACS eligibility estimates, and ACS benchmarked estimates and determine whether the
____________
5 The panel found a paucity of consistent data on costs of administrative processes for school districts. Similarly, few data were available on the extent of changes in participation that result from providing free meals to all students.
ACS benchmarked estimates would satisfy its criteria for currency, accuracy, and temporal stability if used to establish claiming percentages for reimbursement.6
If a district decided that the ACS benchmarked estimates were insufficiently stable or too inaccurate, it might decide not to implement the AEO. If the district decided that the ACS benchmarked estimates appeared to be acceptable, it would apply to FNS or the state to initiate a base year for implementation of the AEO. After approval, the district could conduct a base year, providing free meals to all children but continuing to collect applications, conduct verifications, and count meals.7 During the base year, as in Provision 2, participation should increase as a result of making meals free to all students. These increases in participation would be accounted for in the AEO claiming percentages, although during the base year, reimbursements would be based on the traditional approach. The district would enter base-year data on certification percentages and participation by eligibility group into the AEO Calculator, which would have been updated by FNS with the latest ACS eligibility estimates. Bench-marked eligibility percentages, blended reimbursement rates (BRRs), and claiming percentages would then be produced. The district would verify that the benchmarked ACS BRRs were sufficiently stable and within an acceptable range for operating a universal free meals program.
Should the district decide to go forward with the AEO, the benchmarking adjustments and participation rates derived during the base year would be used to produce updated benchmarked ACS eligibility estimates and claiming percentages in future years as new ACS data were released. After the initial base year, no additional base years would be required.
Derivation and Release of ACS Estimates for School Attendance Areas
Many districts have pockets of poverty within their borders. Thus an entire district may have less than 75 percent of students eligible for free or reduced-price meals, but selected schools within the district may have higher percentages of such students and may therefore be good candidates for a special provision whereby all meals are served free. The problem in this situation is that less than districtwide implementation limits
____________
6 Districts should examine especially carefully the ACS estimates for 2010 and 2011 because they will reflect the effects of using the new ACS population controls based on the 2010 decennial census. If the calculated reimbursement rates for these years are substantially higher or lower than those for previous years, the district should consider waiting another year until 2012 ACS estimates are released, allowing the assessment of 3 years of reimburse ment rates constructed from ACS estimates based on the new population controls.
7 A district could conduct two base years if it did not yet have at least 3 years of consistent ACS and administrative data.
a district’s ability to simplify operations and as a consequence lowers administrative savings, which is one of the sources of revenue for funding the cost of providing free meals to all students. Additionally, some districts reported to the panel that they would not consider implementing a free program less than districtwide since the community reaction would be negative. Because this situation may be fairly common, the panel suggests that FNS and state agencies provide special help and encouragement to those districts that have pockets of poverty within their boundaries as these districts face special implementation challenges.
One challenge associated with providing estimates for schools or groups of schools in districts that declined to adopt the AEO districtwide for financial or other reasons is that the Census Bureau does not maintain boundary information at this level of geographic detail. Hence, FNS would need to establish an annual process by which school districts that chose to implement the AEO only for some schools in the district would provide boundary information in the form of census blocks that make up a school attendance area or an attendance area for a group of schools. The district would provide this information to FNS, which would aggregate all such school district requests and provide them to the Census Bureau. In return, the Census Bureau would provide ACS estimates for these areas according to the panel’s specifications. FNS would make these estimates available to the districts; the estimates would also be available from the Census Bureau to the public at large on request in accordance with the Bureau’s policy for special tabulations.8
Many local planning offices maintain geographic boundaries for school catchment areas. By contacting the local planning office, a district might find it easy to obtain geographic boundaries or lists of census blocks for the groups of schools it proposed for the AEO. Where there was no active local planning office or the school food authority director was unfamiliar with the local planning office, districts might find obtaining appropriate geographic information daunting. It also is not yet clear whether there would be a cost to school districts for obtaining annual ACS estimates for groups of schools. If there were such a cost, it might discourage participation.
The Census Bureau has indicated that if school districts were to provide sufficiently accurate digitized school attendance area boundaries or lists of the census blocks associated with school attendance areas (or both), it would be able to provide special ACS tabulations of students eligible for free and reduced-price school meals for those areas. The estimates for school attendance areas for schools or groups of schools would be based on 1-year, 3-year, or 5-year ACS data, depending on the population size
____________
8 See http://www.census.gov/population/www/cen2000/sptabs/faq.html#7.
of the attendance area for a school or group of schools. School-level detail is most likely to be available only from the 5-year ACS data. The Census Bureau expressed concern about the burden of preparing these tabulations should many districts decide to adopt this approach. Based on the tabulations presented in Table 5-2, however, only 101 districts with enrollments of more than 12,000 students (0.9 percent of all districts) fall in the heterogeneous low or medium need categories, and only 252 districts with fewer than 12,000 students (2 percent of all districts) fall in these cat-egories.9 Hence, only a minority—perhaps a small minority—of districts would likely be interested in the AEO at the subdistrict level. Table 5-1 presented earlier displays counts of districts that reported participating in Provision 2 or 3 (not in a base year) on form FNS-742 in 2009-2010. It shows counts separately for those districts operating under Provision 2 or 3 for all schools in the district versus only some schools. According to this table, only 4 percent of districts were implementing Provision 2 or 3 not in a base year in 2009-2010. Of these, 69 percent were implementing Provision 2 or 3 districtwide. Of the districts using Provision 2 or 3 dis-trictwide, 79 percent were in the very high FRPL category, 10 percent were in the high FRPL category, and 11 percent were in the low to moderate FRPL category. Among districts implementing Provision 2 or 3 for some schools, 23 percent were in the very high FRPL category, 45 percent were in the high FRPL category, and 32 percent were in the low to moderate FRPL category.
A PROCEDURE FOR BENCHMARKING ACS ESTIMATES AND UPDATING CLAIMING PERCENTAGES DISTRICTWIDE
This section details the panel’s proposed procedure for benchmarking ACS estimates and updating claiming percentages districtwide for purposes of implementing the AEO. After ACS estimates have been derived by the Census Bureau according to the procedures described above and released, a district that is potentially interested in districtwide adoption of the AEO can follow these steps:
- Calculate preliminary benchmarked ACS eligibility estimates and BRRs.
- Conduct a preliminary assessment of the use of benchmarked ACS estimates to implement the AEO.
____________
9 In a heterogeneous district, a substantial percentage (at least 25 percent) of schools have at least 75 percent of students eligible for free or reduced-price meals. A substantial percentage (at least 25 percent) of its schools also have less than 50 percent of students eligible for free or reduced-price meals.
| Need: School District Percentage Approved for Free or Reduced-Price Meals | ||||||
| Low (< 50%) | Medium (50 to 75%) | High (≥ 75%) | ||||
| Enrollment Size | Homogeneous Schools | Heterogeneous Schools | Homogeneous Schools | Heterogeneous Schools | Homogeneous Schools | Heterogeneous Schools |
| ≥ 25K | 125 (1.0%) |
8 (0.1%) |
59 (0.5%) |
47 (0.4%) |
41 (0.3%) |
0 (0.0%) |
| 12 to 25K | 204 (1.6%) |
12 (0.1%) |
115 (0.9%) |
34 (0.3%) |
52 (0.4%) |
0 (0.0%) |
| < 12K | 7,107 (54.9%) |
72 (0.6%) |
3,684 (28.5%) |
180 (1.4%) |
1,177 (9.1%) |
21 (0.2%) |
SOURCE: Prepared by the panel.
- Conduct an AEO base year (with necessary approvals).
- Update the benchmarked ACS eligibility estimates and BRRs.
- Conduct a final assessment of the use of benchmarked ACS estimates to implement the AEO.
- Make a decision about adopting the AEO, and obtain necessary approvals.
- Update claiming rates for ongoing operation of the AEO.
All of the calculations required to complete these steps will be performed by the AEO Calculator.
The following subsections describe these steps in detail. The next section describes variations on these procedures to reflect special circumstances, including the steps that can be followed by a district that either is considering adopting the AEO in only some schools within the district or is already operating under Provision 2 or 3. Also discussed is further refinement a district can consider to account specifically for students who do not live in traditional housing and are not included in the ACS estimates based on the household population.
Step 1: Calculate Preliminary Benchmarked ACS Eligibility Estimates and BRRs
The first step for a district that is interested in the AEO is to use the AEO Calculator to obtain preliminary benchmarked ACS estimates and BRRs based on those estimates. For purposes of this discussion, we assume that it is early 2013, just after the Census Bureau has provided 2011, 2009-2011, and 2007-2011 ACS estimates of students eligible for the school meals programs to FNS. At that time, small districts (with populations under 20,000) will have three 5-year estimates available (2005-2009, 2006-2010, and 2007-2011); medium districts (with populations of 20,000 to 65,000) will also have five 3-year estimates available (2005-2007, 2006-2008, 2007-2009, 2008-2010, and 2009-2011); and large districts (with populations above 65,000) will also have seven 1-year estimates available for each year from 2005 through 2011. All of these ACS estimates will have been preloaded into the AEO Calculator by FNS. In response to prompts from the Calculator, the district will input its administrative data on total enrollment and the numbers of students certified for free and for reduced-price meals for each year from 2005 through 2011, or at least their data for 2009, 2010, and 2011.10
The AEO Calculator will benchmark the ACS estimates to the district’s administrative estimates, using the differences between average admin-
____________
10 The preliminary benchmarking adjustments require at least 3 years of data.
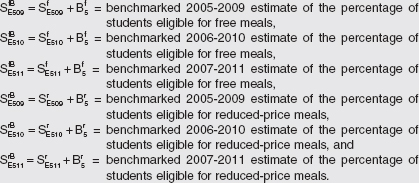
istrative certification percentages and average ACS eligibility percentages as benchmarking adjustments.11 These calculations are illustrated in Box 5-1. Each set of estimates that is available for a district will be bench-marked. The calculations for benchmarking 5-year estimates are shown in Box 5-2. The AEO Calculator will perform similar computations for benchmarking 3- and 1-year estimates. For large districts, benchmarked 1-, 3-, and 5-year estimates will be produced. For small districts, there will be only benchmarked 5-year estimates. The AEO Calculator will also provide BRRs based on the benchmarked ACS estimates, as illustrated in Box 5-3. The benchmarked ACS eligibility estimates and BRRs derived in this step are preliminary. Final values will be calculated in a later step when additional estimates are available.
Step 2: Conduct a Preliminary Assessment of the Use of Benchmarked ACS Estimates to Implement the AEO
The second step for a district is to examine the BRRs calculated in Step 1 to determine whether they are sufficiently stable from year to year and within an acceptable range for operating the school meals programs. The district will also be able to compare estimates from the AEO Calculator of the total reimbursements it would have received based on the benchmarked ACS estimates and the reimbursements it actually received, as well as compare the BRRs based on benchmarked ACS estimates with those based on the district’s administrative data on certified students. While small districts will examine the benchmarked 5-year estimates in their assessment, medium districts will also be able to consider the benchmarked 3-year estimates, and large districts will be able to consider not only benchmarked 5-year and 3-year estimates but also benchmarked 1-year estimates. If a large district determines that the BRRs based on 1-year estimates fluctuate too much from year to year, it may find that the BRRs based on 3- or 5-year estimates are sufficiently stable. A district should keep in mind that its participation rates will likely increase—although differentially across categories—and the total meals served will increase if it offers free meals to all students (see Step 3 below, which entails conducting an AEO base year to observe participation effects).12
When conducting its preliminary assessment, a district should examine especially carefully the 1-year estimates for 2010 and 2011 (if it is a large
____________
11 We propose an additive benchmarking adjustment because that is consistent with the additive nature of the ACS multiyear estimates and the model used in Chapter 4 to derive empirical results on precision, temporal stability, and responsiveness to change.
12 Allowing a district to input alternative participation rates to assess the effects on BRRs and total reimbursements would likely be a useful capability of the AEO Calculator.
BOX 5-1
Calculating ACS and Administrative Averages
and Benchmarking Adjustments
Step 1a: Calculate averages of ACS estimates
![]()
where k = 1, 3, or 5, indicating whether the average pertains to 1-, 3-, or 5-year ACS estimates.
Step 1b: Calculate averages of administrative estimates
![]()
where k indicates whether the average will be used for comparison with ACS 1-, 3-, or 5-year estimates.
For comparison with ACS 5-year estimates for 2005-2009, 2006-2010, and 2007-2011, the AEO Calculator will average across administrative estimates for October 2009, October 2010, and October 2011. For comparison with ACS 3-year estimates for 2005-2007, 2006-2008, 2007-2009, 2008-2010, and 2009-2011, the Calculator will average across administrative estimates for October 2007, October 2008, October 2009, October 2010, and October 2011.
Step 1c: Calculate preliminary benchmarking adjustments (illustrated for 5-year estimates)
SOURCE: Prepared by the panel.
district), the 3-year estimates for 2008-2010 and 2009-2011 (if it is a large or medium district), and the 5-year estimates for 2006-2010 and 2007-2011. These estimates will reflect the effects of using the new ACS population controls based on the 2010 decennial census. If the BRRs based on these estimates are substantially higher or lower than the BRRs based on estimates for prior years (2005, 2006, 2007, 2008, and 2009 for 1-year estimates; 2005-2007, 2006-2008, and 2007-2009 for 3-year estimates; and 2005-2009 for
BOX 5-2
Preliminary Benchmarking of ACS Estimates
Step 1d: Calculate preliminary benchmarked ACS eligibility percentages (illustrated for 5-year estimates)
SOURCE: Prepared by the panel.
5-year estimates), the district should consider waiting another year until the 2012, 2010-2012, and 2008-2012 ACS estimates are released, allowing the assessment of BRRs constructed from benchmarked ACS estimates based on the new population controls for 3 years.13
If a district concludes from its assessment that it would be financially viable to operate under the AEO using benchmarked ACS estimates and that BRRs are likely to be sufficiently stable, it should proceed to the next step. If the BRRs fall outside an acceptable range or are excessively variable, the district can either cease its consideration of the AEO or conduct further research to determine, for example, whether a different adjustment method would improve the estimates.
Step 3: Conduct an AEO Base Year
If a district remains interested in the AEO after its assessment of preliminary estimates, it should conduct an AEO base year (after receiving any necessary approvals). During the base year, as under Provision 2, the
____________
13 If a district does not want to wait for another year of ACS estimates, an alternative is to conduct 2 base years instead of 1; see Step 3 below.
BOX 5-3
Calculating Preliminary Blended Reimbursement Rates Based on Benchmarked ACS Estimates and a District’s Most Recent Participation Rates
Step 1e: Calculate preliminary BRRs (illustrated with 5-year estimates)
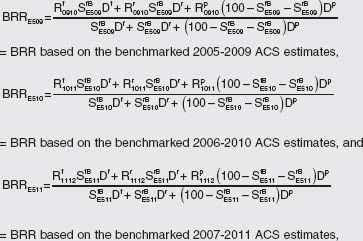
where Rf, Rr, and Rp are the district’s per meal reimbursement rates for free, reduced-price, and full-price meals, respectively (with subscripts referencing school years), and Df, Dr, and Dp, respectively, are the district’s most recent free, reduced-price, and full-price October participation rates (average daily meals served in category divided by certified students in category).
SOURCE: Prepared by the panel.
district will conduct its traditional application, verification, certification, and meal counting procedures but offer free meals to all students. The district should track the costs of the traditional procedures that will be eliminated under the AEO. It should also monitor changes in the total number of meals served and record the number of meals served to students in each eligibility category during October of the base year.14 These figures
____________
14 If the student enrollment in a district fluctuates seasonally with, for example, the movement of families of migrant workers, the district may be able to use average administrative estimates of certified students and meals served for the entire school year, rather than figures just for October, in the calculations performed to benchmark ACS estimates and derive claiming percentages.
will be used by the AEO Calculator to compute participation rates that capture the effects on participation of offering free meals to all students.15
Step 4: Update the Benchmarked ACS Eligibility Estimates and BRRs
During the AEO base year, new 1-year, 3-year, and 5-year ACS estimates will be released. If the base year is conducted during school year 2013-2014, these ACS estimates will be for 2012, 2010-2012, and 2008-2012. In this step, the district will input base-year administrative data on enrollment, counts of certified students by category, and participation (average daily meals served) by category, and the AEO Calculator will update the benchmarked estimates from Step 1 to include the new ACS and administrative estimates. The benchmarking adjustments calculated in this step by the Calculator will be the final adjustments, and if the district adopts the AEO, they will be used for ongoing operation under the AEO. The AEO Calculator will also compute updated BRRs using each set of bench-marked ACS estimates and the district’s participation rates for October of the AEO base year.
Step 5: Conduct a Final Assessment of the Use of Benchmarked ACS Estimates to Implement the AEO
In Step 5, a district will perform an assessment that is similar to the preliminary assessment conducted in Step 2. It will examine the BRRs from Step 4 to determine whether they are within a financially acceptable range and sufficiently stable from year to year. In comparing the BRRs with its historical experience, the district should keep in mind that the BRRs reflect the participation rates of the AEO base year, when free meals were provided to all students. Furthermore, it is important to examine not only the average reimbursement rates per meal (the BRRs) but also the total reimbursements for all meals served, as estimated by the AEO Calculator. The district should also consider in its assessment how the total number of meals served has been affected by offering free meals to all students and the effect of any change in this total on, for example, the cost structure of its food service operations. Medium districts should compare the temporal stability and financial acceptability of the BRRs based on 3- and 5-year estimates, weighing the generally greater stability associated with 5-year estimates against the generally greater responsiveness to socioeconomic change associated with the 3-year estimates. Large districts
____________
15 A district with a very high FRPL percentage and a BRR close to the reimbursement rate for free meals could be given the option of skipping the AEO base year if it already had at least four sets of ACS estimates to use for establishing a benchmarking adjustment.
should include in their comparison the BRRs based on 1-year estimates, which are generally the least stable but the most responsive to change.
Step 6: Make a Decision About Adopting the AEO and Obtain Necessary Approvals
Based on its assessment in Step 5, a district will decide whether to adopt the AEO. If it wishes to adopt the AEO, it will be able to obtain claiming rates from the AEO Calculator. A large district will have to determine whether it wishes to base its claiming rates on benchmarked 1-, 3-, or 5-year estimates, while a medium district will have to choose between benchmarked 3- and 5-year estimates as the basis for its claiming rates. As shown in Box 5-4, the initial set of claiming rates will be based on the most recent release of ACS estimates (assumed to be the 2012, 2010-2012, or 2008-2012 estimates) and participation data from the base year. To obtain approval for adopting the AEO, the district will have to comply with any regulations or other requirements imposed by FNS and state and local authorities.
BOX 5-4
Calculating AEO Claiming Rates for Use in First Year After Base Year
Step 6: Calculate initial claiming rates
If a district chooses to base its claiming rates on the benchmarked k-year estimates, where k = 1, 3, or 5, the initial claiming rates are
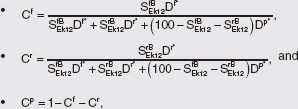
where Df*, Dr*, and Dp*, respectively, are the free, reduced-price, and full-price participation rates from the AEO base year, and SEk12fB and SEk12B are the bench-marked k-year eligibility percentages (k = 1, 3, or 5) from the most recent release of ACS estimates.
SOURCE: Prepared by the panel.
Step 7: Update Claiming Rates for Ongoing Operation of the AEO
If a district’s request for approval to adopt the AEO is granted, the district will be able to use the AEO Calculator to benchmark each newly released set of ACS eligibility percentages, as illustrated in Box 5-5. These benchmarked estimates will be used by the AEO Calculator along with participation rates from the AEO base year to compute updated claiming rates, as shown in Box 5-6. Both the base-year participation rates and the final benchmarking adjustments will be used indefinitely unless the district returns to the use of traditional operating procedures or another special provision on a permanent basis (that is, it drops the AEO) or conducts a new AEO base year. The district should continuously assess whether the AEO is meeting the district’s objectives. If it is not, the district will be able to return to traditional operating procedures or adopt another special provision at any time, subject to whatever conditions are specified by FNS or state or local authorities.
Examples of Calculations for Case Study Districts
The panel’s recommended procedure is illustrated here with calculations for the case study districts. For these illustrative calculations, we use the ACS 1-year estimates because enough sets of 3- and 5-year estimates
BOX 5-5
Benchmarking Future ACS Eligibility Estimates
Step 7a: Benchmark each new set of ACS estimates
If the district is using the k-year estimates to establish claiming rates, the benchmarked eligibility percentages are
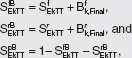
where TT is the last year in the reference period for the k-year estimates; e.g., TT = 13 for the 5-year estimates for 2009-2013. Bkf,Final and Bkr,Final are the final benchmarking adjustments calculated (in Step 4) after the AEO base year.
SOURCE: Prepared by the panel.
BOX 5-6
Updating AEO Claiming Rates
Step 7b: Update AEO claiming rates
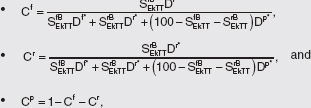
where Df*, Dr*, and Dp*, respectively, are the free, reduced-price, and full-price participation rates from the AEO base year.
SOURCE: Prepared by the panel.
are not yet available. As shown in Chapter 4, even the districts for which 1-year estimates are available may prefer to use the 3- or 5-year estimates, which will generally be more stable from year to year. Therefore, conclusions about the performance of the ACS estimates should not be drawn on the basis of these purely illustrative examples.
For the sake of illustration, we assume that the districts are beginning to consider the AEO in early 2009, just after the release of the ACS 1-year estimates for 2007, the third set of estimates after the previous release of estimates for 2005 and 2006. Tables 5-3, 5-4, 5-5, and 5-6 illustrate the calculation of the average of ACS eligibility percentages, the average of district certification percentages, the preliminary ACS benchmarking adjustments, and the preliminary benchmarked ACS eligibility percentages. When the ACS estimates for 2007 are released, the most recent October participation estimates that are available are for October 2008. These estimates are used in Table 5-7 to illustrate the calculation of preliminary BRRs, which concludes the computations performed under Step 1.
Tables 5-8, 5-9, and 5-10 illustrate the calculations necessary for the district to conduct an initial assessment of the AEO under Step 2 of the panel’s proposed procedure. Table 5-8 illustrates the calculation of simulated reimbursements under the AEO, using the preliminary BRRs and counts of total meals served in October of each year. These BRRs are based on the benchmarked ACS eligibility estimates. Table 5-9 displays the calculation of the BRRs that would be associated with using the district’s
TABLE 5-3 Step 1a: Calculate Averages of ACS Eligibility Percentages for Preliminary Benchmarking
| 1-Year ACS Estimate (%) | ||||
| District | 2005 | 2006 | 2007 | Average (%) |
| Percentage Eligible for Free Meals | ||||
| Austin, Texas | 35 | 40 | 42 | 39 |
| Chatham County, Georgia | 34 | 42 | 37 | 37 |
| Norfolk, Virginia | 45 | 47 | 44 | 46 |
| Omaha, Nebraska | 40 | 43 | 35 | 39 |
| Pajaro Valley, California | 36 | 28 | 35 | 33 |
| Percentage Eligible for Reduced-Price Meals | ||||
| Austin, Texas | 10 | 11 | 11 | 11 |
| Chatham County, Georgia | 17 | 16 | 18 | 17 |
| Norfolk, Virginia | 14 | 17 | 11 | 14 |
| Omaha, Nebraska | 10 | 10 | 11 | 10 |
| Pajaro Valley, California | 12 | 15 | 19 | 15 |
NOTE: ACS = American Community Survey.
SOURCE: Prepared by the panel.
| Administrative Estimate (%) | ||||
| District | 2005 | 2006 | 2007 | Average (%) |
| Percentage Certified for Free Meals | ||||
| Austin, Texas | 52 | 52 | 54 | 53 |
| Chatham County, Georgia | 49 | 52 | 57 | 53 |
| Norfolk, Virginia | 48 | 46 | 47 | 47 |
| Omaha, Nebraska | 49 | 57 | 50 | 52 |
| Pajaro Valley, California | 58 | 56 | 55 | 56 |
| Percentage Certified for Reduced-Price Meals | ||||
| Austin, Texas | 9 | 8 | 8 | 9 |
| Chatham County, Georgia | 8 | 9 | 9 | 9 |
| Norfolk, Virginia | 11 | 11 | 11 | 11 |
| Omaha, Nebraska | 9 | 11 | 11 | 10 |
| Pajaro Valley, California | 5 | 7 | 9 | 7 |
NOTE: For Pajaro Valley, the panel was unable to obtain administrative data for 2005 (the 2005-2006 school year) so estimates for that year are based on data from the Common Core of Data (CCD).
SOURCE: Prepared by the panel.
TABLE 5-5 Step 1c: Calculate Preliminary Benchmarking Adjustments
| District | Administrative Average (%) | ACS Average (%) | Preliminary Benchmarking Adjustment (%) | |
| Percentage Certified/Eligible for Free Meals | ||||
| Austin, Texas | 53 | 39 | 14 | |
| Chatham County, Georgia | 53 | 37 | 16 | |
| Norfolk, Virginia | 47 | 46 | 2 | |
| Omaha, Nebraska | 52 | 39 | 13 | |
| Pajaro Valley, California | 56 | 33 | 24 | |
| Percentage Certified/Eligible for Reduced-Price Meals | ||||
| Austin, Texas | 9 | 11 | –2 | |
| Chatham County, Georgia | 9 | 17 | –8 | |
| Norfolk, Virginia | 11 | 14 | –3 | |
| Omaha, Nebraska | 10 | 10 | 0 | |
| Pajaro Valley, California | 7 | 15 | –8 | |
NOTE: ACS = American Community Survey.
SOURCE: Prepared by the panel.
TABLE 5-6 Step 1d: Calculate Preliminary Benchmarked Eligibility Percentages
| Unbenchmarked 1-Year ACS Estimate (%) | Preliminary Benchmarking Adjustment | Preliminary Benchmarked Eligibility Percentage (%) | |||||
| District | 2005 | 2006 | 2007 | (%) | 2005 | 2006 | 2007 |
| Percentage Eligible for Free Meals | |||||||
| Austin, Texas | 35 | 40 | 42 | 14 | 49 | 54 | 55 |
| Chatham County, Georgia | 34 | 42 | 37 | 16 | 49 | 57 | 52 |
| Norfolk, Virginia | 45 | 47 | 44 | 2 | 47 | 49 | 46 |
| Omaha, Nebraska | 40 | 43 | 35 | 13 | 53 | 56 | 48 |
| Pajaro Valley, California | 36 | 28 | 35 | 24 | 60 | 51 | 58 |
| Percentage Eligible for Reduced-Price Meals | |||||||
| Austin, Texas | 10 | 11 | 11 | –2 | 8 | 9 | 9 |
| Chatham County, Georgia | 17 | 16 | 18 | –8 | 9 | 8 | 10 |
| Norfolk, Virginia | 14 | 17 | 11 | –3 | 11 | 14 | 8 |
| Omaha, Nebraska | 10 | 10 | 11 | 0 | 10 | 10 | 11 |
| Pajaro Valley, California | 12 | 15 | 19 | –8 | 4 | 6 | 10 |
NOTE: ACS = American Community Survey.
SOURCE: Prepared by the panel.
TABLE 5-7 Step 1e: Calculate Preliminary BRRs
| Preliminary Benchmarked Eligibility Percentage (%) | Reimbursement Rate ($) | Participation Rate (October 2008) (%) | |||||||
| Year | Free | Reduced Price | Free | Reduced Price | Full Price | Free | Reduced Price | Full Price | Preliminary BRR ($) |
| Austin, Texas | |||||||||
| 2005 | 49 | 8 | 2.34 | 1.94 | 0.24 | 1.81 | |||
| 2006 | 54 | 9 | 2.42 | 2.02 | 0.25 | 86 | 72 | 34 | 1.96 |
| 2007 | 55 | 9 | 2.49 | 2.09 | 0.25 | 2.04 | |||
| Chatham County, Georgia | |||||||||
| 2005 | 49 | 9 | 2.34 | 1.94 | 0.24 | 1.64 | |||
| 2006 | 57 | 8 | 2.42 | 2.02 | 0.25 | 75 | 72 | 48 | 1.83 |
| 2007 | 52 | 10 | 2.49 | 2.09 | 0.25 | 1.82 | |||
| Norfolk, Virginia | |||||||||
| 2005 | 47 | 11 | 2.34 | 1.94 | 0.24 | 1.67 | |||
| 2006 | 49 | 14 | 2.42 | 2.02 | 0.25 | 77 | 71 | 43 | 1.80 |
| 2007 | 46 | 8 | 2.49 | 2.09 | 0.25 | 1.71 | |||
| Omaha, Nebraska | |||||||||
| 2005 | 53 | 10 | 2.34 | 1.94 | 0.24 | 1.69 | |||
| 2006 | 56 | 10 | 2.42 | 2.02 | 0.25 | 92 | 84 | 61 | 1.81 |
| 2007 | 48 | 11 | 2.49 | 2.09 | 0.25 | 1.72 | |||
| Pajara Valley, California | |||||||||
| 2005 | 60 | 4 | 2.34 | 1.94 | 0.24 | 1.97 | |||
| 2006 | 51 | 6 | 2.42 | 2.02 | 0.25 | 68 | 52 | 23 | 1.94 |
| 2007 | 58 | 10 | 2.49 | 2.09 | 0.25 | 2.13 | |||
NOTE: It is assumed that in each year, each district qualified for the additional reimbursement of $0.02 per meal for having served at least 60 percent of meals free or reduced price 2 years earlier. BRR = blended reimbursement rate.
SOURCE: Prepared by the panel.
TABLE 5-8 Step 2: Preliminary Assessment of the AEO: Simulate Reimbursements
| Year | Preliminary BRR ($) | Total Meals Served in October (actual) | Total Reimbursement in October (simulated) ($) |
| Austin, Texas | |||
| 2005 | 1.81 | 1,007,694 | 1,821,797 |
| 2006 | 1.96 | 1,079,986 | 2,120,538 |
| 2007 | 2.04 | 1,126,100 | 2,297,991 |
| Chatham County, Georgia | |||
| 2005 | 1.64 | 425,905 | 697,231 |
| 2006 | 1.83 | 454,688 | 833,189 |
| 2007 | 1.82 | 473,806 | 863,216 |
| Norfolk, Virginia | |||
| 2005 | 1.67 | 506,815 | 847,832 |
| 2006 | 1.80 | 502,823 | 907,084 |
| 2007 | 1.71 | 487,791 | 835,760 |
| Omaha, Nebraska | |||
| 2005 | 1.69 | 656,550 | 1,112,018 |
| 2006 | 1.81 | 708,455 | 1,285,027 |
| 2007 | 1.72 | 751,362 | 1,291,091 |
| Pajara Valley, California | |||
| 2005 | 1.97 | 181,763 | 358,929 |
| 2006 | 1.94 | 188,053 | 365,591 |
| 2007 | 2.13 | 212,526 | 453,627 |
NOTES: For Pajaro Valley, the panel was unable to obtain data on meals served for 200 (the 2005-2006 school year). Therefore, the estimate for 2005 is based on averaging estimate for 2004 and 2006. AEO = American Community Survey (ACS) Eligibility Option; BRR blended reimbursement rate.
SOURCE: Prepared by the panel.
administrative certification percentages instead of the benchmarked ACS eligibility estimates. The BRRs from Tables 5-8 and 5-9 are compared in Table 5-10 and can be used to assess the stability of the reimbursements over time.
It is assumed that these districts decide to continue with the next step and conduct a base year under the AEO. The districts conduct their AEO base years in school year 2009-2010. During that year, the 1-year ACS estimates for 2008 become available and are used in calculating final benchmarking adjustments and conducting a final assessment of the AEO. Tables 5-11 through 5-14 show how the calculations necessary for benchmarking are updated to include the most recent year of data. Tables 5-11 and 5-12 illustrate the derivation of average ACS eligi-
| Administrative Certification Percentage (%) | Reimbursement Rate ($) | Participation Rate (October 2008) (%) | |||||||
| Year | Free | Reduced Price | Free | Reduced Price | Full Price | Free | Reduced Price | Full Price | BRR ($) |
| Austin, Texas | |||||||||
| 2005 | 52 | 9 | 2.34 | 1.94 | 0.24 | 1.87 | |||
| 2006 | 52 | 8 | 2.42 | 2.02 | 0.25 | 86 | 72 | 34 | 1.94 |
| 2007 | 54 | 8 | 2.49 | 2.09 | 0.25 | 2.01 | |||
| Chatham County, Georgia | |||||||||
| 2005 | 49 | 8 | 2.34 | 1.94 | 0.24 | 1.64 | |||
| 2006 | 52 | 9 | 2.42 | 2.02 | 0.25 | 75 | 72 | 48 | 1.76 |
| 2007 | 57 | 9 | 2.49 | 2.09 | 0.25 | 1.90 | |||
| Norfolk, Virginia | |||||||||
| 2005 | 48 | 11 | 2.34 | 1.94 | 0.24 | 1.68 | |||
| 2006 | 46 | 11 | 2.42 | 2.02 | 0.25 | 77 | 71 | 43 | 1.73 |
| 2007 | 47 | 11 | 2.49 | 2.09 | 0.25 | 1.79 | |||
| Omaha, Nebraska | |||||||||
| 2005 | 49 | 9 | 2.34 | 1.94 | 0.24 | 1.61 | |||
| 2006 | 57 | 11 | 2.42 | 2.02 | 0.25 | 92 | 84 | 61 | 1.85 |
| 2007 | 50 | 11 | 2.49 | 2.09 | 0.25 | 1.77 | |||
| Pajara Valley, California | |||||||||
| 2005 | 58 | 5 | 2.34 | 1.94 | 0.24 | 1.97 | |||
| 2006 | 56 | 7 | 2.42 | 2.02 | 0.25 | 68 | 52 | 23 | 2.01 |
| 2007 | 55 | 9 | 2.49 | 2.09 | 0.25 | 2.08 | |||
NOTES: For Pajaro Valley, the panel was unable to obtain administrative data for 2005 (the 2005-2006 school year), so certification percentages for that year are based on data from the Common Core of Data (CCD). Also, it is assumed that in each year, each district qualified for the additional reimbursement of $0.02 per meal for having served at least 60 percent of meals free or reduced price 2 years earlier. AEO = American Community Survey (ACS) Eligibility Option; BRR = blended reimbursement rate.
SOURCE: Prepared by the panel.
| Year | BRRs Based on Benchmarked ACS Estimates ($) | BRRs Based on Administrative Estimates ($) | Difference ($) | Percentage Difference (%) |
| Austin, Texas | ||||
| 2005 | 1.81 | 1.87 | –0.06 | –3 |
| 2006 | 1.96 | 1.94 | 0.03 | 1 |
| 2007 | 2.04 | 2.01 | 0.03 | 2 |
| Chatham County, Georgia | ||||
| 2005 | 1.64 | 1.64 | 0.00 | 0 |
| 2006 | 1.83 | 1.76 | 0.07 | 4 |
| 2007 | 1.82 | 1.90 | –0.08 | –4 |
| Norfolk, Virginia | ||||
| 2005 | 1.67 | 1.68 | –0.01 | –1 |
| 2006 | 1.80 | 1.73 | 0.08 | 5 |
| 2007 | 1.71 | 1.79 | –0.08 | –4 |
| Omaha, Nebraska | ||||
| 2005 | 1.69 | 1.61 | 0.08 | 5 |
| 2006 | 1.81 | 1.85 | –0.03 | –2 |
| 2007 | 1.72 | 1.77 | –0.05 | –3 |
| Pajara Valley, California | ||||
| 2005 | 1.97 | 1.97 | 0.01 | 0 |
| 2006 | 1.94 | 2.01 | –0.07 | –3 |
| 2007 | 2.13 | 2.08 | 0.06 | 3 |
NOTE: ACS = American Community Survey; AEO = ACS Eligibility Option; BRR = blended reimbursement rate.
SOURCE: Prepared by the panel.
bility percentages and average administrative certification percentages. Table 5-13 displays the calculation of the final benchmarking adjustments, and Table 5-14 shows the calculation of benchmarked eligibility percentages for 2005 through 2008. For evaluating the updated benchmarked estimates, Table 5-15 presents the calculation of BRRs based on the bench-marked eligibility percentages and the districts’ participation rates during the base year, which reflect the effects on participation of offering free meals to all students. Of course, the panel has not actually observed these participation effects, and therefore, we must assume what they might have been. Our assumption is that participation rates among students otherwise eligible for free, reduced-price, and full-price meals increase
TABLE 5-11 Step 4a: Calculate Averages of ACS Eligibility Percentages for Final Benchmarking
| 1-Year ACS Estimate (%) | |||||
| District | 2005 | 2006 | 2007 | 2008 | Average (%) |
| Percentage Eligible for Free Meals | |||||
| Austin, Texas | 35 | 40 | 42 | 38 | 39 |
| Chatham County, Georgia | 34 | 42 | 37 | 34 | 36 |
| Norfolk, Virginia | 45 | 47 | 44 | 50 | 47 |
| Omaha, Nebraska | 40 | 43 | 35 | 43 | 40 |
| Pajaro Valley, California | 36 | 28 | 35 | 37 | 34 |
| Percentage Eligible for Reduced-Price Meals | |||||
| Austin, Texas | 10 | 11 | 11 | 10 | 11 |
| Chatham County, Georgia | 17 | 16 | 18 | 12 | 16 |
| Norfolk, Virginia | 14 | 17 | 11 | 13 | 14 |
| Omaha, Nebraska | 10 | 10 | 11 | 12 | 11 |
| Pajaro Valley, California | 12 | 15 | 19 | 18 | 16 |
NOTE: ACS = American Community Survey.
SOURCE: Prepared by the panel.
| Administrative Estimate (%) | |||||
| District | 2005 | 2006 | 2007 | 2008 | Average (%) |
| Percentage Certified for Free Meals | |||||
| Austin, Texas | 52 | 52 | 54 | 56 | 53 |
| Chatham County, Georgia | 49 | 52 | 57 | 59 | 54 |
| Norfolk, Virginia | 48 | 46 | 47 | 48 | 47 |
| Omaha, Nebraska | 49 | 57 | 50 | 50 | 52 |
| Pajaro Valley, California | 58 | 56 | 55 | 59 | 57 |
| Percentage Certified for Reduced-Price Meals | |||||
| Austin, Texas | 9 | 8 | 8 | 8 | 8 |
| Chatham County, Georgia | 8 | 9 | 9 | 9 | 9 |
| Norfolk, Virginia | 11 | 11 | 11 | 11 | 11 |
| Omaha, Nebraska | 9 | 11 | 11 | 11 | 10 |
| Pajaro Valley, California | 5 | 7 | 9 | 9 | 7 |
NOTE: For Pajaro Valley, the panel was unable to obtain administrative data for 2005 (the 2005-2006 school year) so estimates for that year are based on data from the Common Core of Data (CCD).
SOURCE: Prepared by the panel.
TABLE 5-13 Step 4c: Calculate Final Benchmarking Adjustments
| District | Administrative Average (%) | ACS Average (%) | Benchmarking Adjustment (%) |
| Percentage Certified/Eligible for Free Meals | |||
| Austin, Texas | 53 | 39 | 15 |
| Chatham County, Georgia | 54 | 36 | 18 |
| Norfolk, Virginia | 47 | 47 | 1 |
| Omaha, Nebraska | 52 | 40 | 11 |
| Pajaro Valley, California | 57 | 34 | 23 |
| Percentage Certified/Eligible for Reduced-Price Meals | |||
| Austin, Texas | 8 | 11 | –2 |
| Chatham County, Georgia | 9 | 16 | –7 |
| Norfolk, Virginia | 11 | 14 | –3 |
| Omaha, Nebraska | 10 | 11 | 0 |
| Pajaro Valley, California | 7 | 16 | –9 |
NOTE: ACS = American Community Survey.
SOURCE: Prepared by the panel.
by 5, 7, and 10 percentage points, respectively, relative to the rates for the prior year (2008-2009), when the districts were operating under traditional procedures.16
To facilitate districts’ final assessment of the AEO, Table 5-16 presents the total reimbursements that would be provided under the AEO based on the estimated BRRs and assumed increases in the total number of meals served (due to the offer of free meals to all students). Table 5-17 provides BRRs based on administrative certification percentages, and Table 5-18 compares the BRRs based on the benchmarked ACS estimates with the BRRs based on the administrative estimates. We assume for the sake of illustration that the districts evaluate this information and decide to adopt the AEO. Then, as shown in Table 5-19, claiming percentages are calculated. These percentages are used to determine reimbursements under the AEO during the first year following the base year.
In each subsequent year, new ACS estimates are released and can be used to update the districts’ AEO claiming percentages. Table 5-20 shows how benchmarked ACS estimates for 2009 are calculated. Table 5-21 illustrates how the new benchmarked ACS estimates are used with the participation rates from the AEO base year to obtain updated claiming percentages.
____________
16 Although the panel might have wanted to apply these assumed increases to the rates that were actually observed in 2009-2010, administrative data on meals served by the case study districts during that year were not available to us.
TABLE 5-14 Step 4d: Calculate Benchmarked Eligibility Percentages
|
Unbenchmarked 1-Year ACS Estimate (%) |
Benchmarked Eligibility Percentage (%) |
||||||||
|
District |
2005 |
2006 |
2007 |
2008 |
Benchmarking Adjustment (%) |
2005 |
2006 |
2007 |
2008 |
|
Percentage Eligible for Free Meals |
|||||||||
|
Austin, Texas |
35 |
40 |
42 |
38 |
15 |
50 |
55 |
56 |
53 |
|
Chatham County, Georgia |
34 |
42 |
37 |
34 |
18 |
52 |
60 |
55 |
52 |
|
Norfolk, Virginia |
45 |
47 |
44 |
50 |
1 |
46 |
48 |
45 |
51 |
|
Omaha, Nebraska |
40 |
43 |
35 |
43 |
11 |
51 |
54 |
47 |
54 |
|
Pajaro Valley, California |
36 |
28 |
35 |
37 |
23 |
60 |
51 |
58 |
60 |
|
Percentage Eligible for Reduced-Price Meals |
|||||||||
|
Austin, Texas |
10 |
11 |
11 |
10 |
–2 |
7 |
9 |
9 |
8 |
|
Chatham County, Georgia |
17 |
16 |
18 |
12 |
–7 |
10 |
9 |
11 |
5 |
|
Norfolk, Virginia |
14 |
17 |
11 |
13 |
–3 |
11 |
14 |
8 |
10 |
|
Omaha, Nebraska |
10 |
10 |
11 |
12 |
0 |
10 |
10 |
10 |
12 |
|
Pajaro Valley, California |
12 |
15 |
19 |
18 |
–9 |
3 |
6 |
10 |
9 |
NOTE: ACS = American Community Survey.
SOURCE: Prepared by the panel.
TABLE 5-15 Step 4e: Calculate BRRs
| Benchmarked Eligibility Percentage (%) | Reimbursement Rate ($) | Assumed Base-Year Participation Rate (with free meals for all) (%) | |||||||
| Year | Free | Reduced Price | Free | Reduced Price | Full Price | Free | Reduced Price | Full Price | BRR ($) |
| Austin, Texas | |||||||||
| 2005 | 50 | 7 | 2.34 | 1.94 | 0.24 | 1.75 | |||
| 2006 | 55 | 9 | 2.42 | 2.02 | 0.25 | 91 | 79 | 44 | 1.91 |
| 2007 | 56 | 9 | 2.49 | 2.09 | 0.25 | 1.99 | |||
| 2008 | 53 | 8 | 2.59 | 2.19 | 0.26 | 2.00 | |||
| Chatham County, Georgia | |||||||||
| 2005 | 52 | 10 | 2.34 | 1.94 | 0.24 | 1.65 | |||
| 2006 | 60 | 9 | 2.42 | 2.02 | 0.25 | 80 | 79 | 58 | 1.85 |
| 2007 | 55 | 11 | 2.49 | 2.09 | 0.25 | 1.83 | |||
| 2008 | 52 | 5 | 2.59 | 2.19 | 0.26 | 1.74 | |||
| Norfolk, Virginia | |||||||||
| 2005 | 46 | 11 | 2.34 | 1.94 | 0.24 | 1.60 | |||
| 2006 | 48 | 14 | 2.42 | 2.02 | 0.25 | 82 | 78 | 53 | 1.73 |
| 2007 | 45 | 8 | 2.49 | 2.09 | 0.25 | 1.63 | |||
| 2008 | 51 | 10 | 2.59 | 2.19 | 0.26 | 1.85 | |||
| Omaha, Nebraska | |||||||||
| 2005 | 51 | 10 | 2.34 | 1.94 | 0.24 | 1.62 | |||
| 2006 | 54 | 10 | 2.42 | 2.02 | 0.25 | 97 | 91 | 71 | 1.74 |
| 2007 | 47 | 10 | 2.49 | 2.09 | 0.25 | 1.64 | |||
| 2008 | 54 | 12 | 2.59 | 2.19 | 0.26 | 1.90 | |||
| Pajaro Valley, California | |||||||||
| 2005 | 60 | 3 | 2.34 | 1.94 | 0.24 | 1.88 | |||
| 2006 | 51 | 6 | 2.42 | 2.02 | 0.25 | 73 | 59 | 33 | 1.83 |
| 2007 | 58 | 10 | 2.49 | 2.09 | 0.25 | 2.04 | |||
| 2008 | 60 | 9 | 2.59 | 2.19 | 0.26 | 2.16 | |||
NOTES: It is assumed that in each year, each district qualifed for the additional reimbursement of $0.02 per meal for having served at least 60 percent of meals free or reduced-price 2 years earlier. Also, it is assumed that offering free meals to all students during the American Community Survey (ACS) Eligibility Option (AEO) base year will increase participation rates among students otherwise eligible for free, reduced-price, and full-price meals by 5, 7, and 10 percentage points, respectively, relative to the participation rates during the prior year, when the meals programs were operated under traditional procedures. The actual participation effects of free meals for all students could be substantially different. BRR = blended reimbursement rate.
SOURCE: Prepared by the panel.
TABLE 5-16 Step 5: Final Assessment of the AEO: Simulate Reimbursements
| Year | BRR ($) | Total Meals Served in October (simulated) | Total Reimbursement in October (simulated) ($) | |
| Austin, Texas | ||||
| 2005 | 1.75 | 1,039,289 | $1,813,969 | |
| 2006 | 1.91 | 1,218,713 | 2,325,666 | |
| 2007 | 1.99 | 1,306,676 | 2,594,775 | |
| 2008 | 2.00 | 1,285,461 | 2,566,296 | |
| Chatham County, Georgia | ||||
| 2005 | 1.65 | 470,642 | 775,083 | |
| 2006 | 1.85 | 508,795 | 938,984 | |
| 2007 | 1.83 | 548,438 | 1,006,208 | |
| 2008 | 1.74 | 517,731 | 901,720 | |
| Norfolk, Virginia | ||||
| 2005 | 1.60 | 512,977 | 819,495 | |
| 2006 | 1.73 | 547,106 | 947,629 | |
| 2007 | 1.63 | 514,439 | 837,414 | |
| 2008 | 1.85 | 530,040 | 981,970 | |
| Omaha, Nebraska | ||||
| 2005 | 1.62 | 774,990 | 1,257,158 | |
| 2006 | 1.74 | 803,735 | 1,400,777 | |
| 2007 | 1.64 | 830,806 | 1,361,501 | |
| 2008 | 1.90 | 885,620 | 1,681,162 | |
| Pajara Valley, California | ||||
| 2005 | 1.88 | 234,119 | 439,247 | |
| 2006 | 1.83 | 228,119 | 416,916 | |
| 2007 | 2.04 | 258,285 | 527,601 | |
| 2008 | 2.16 | 252,468 | 544,635 | |
| NOTE: The estimates of total meals served include the effects on participation of offering free meals to all students. AEO = American Community Survey (ACS) Eligibility Option; BRR = blended reimbursement rate. SOURCE: Prepared by the panel. |
||||
| Administrative Certification Percentage (%) | Reimbursement Rate ($) | Assumed Base-Year Participation Rate (with free meals for all) (%) | |||||||
| Year | Free | Reduced Price | Free | Reduced Price | Full Price | Free | Reduced Price | Full Price | BRR ($) |
| Austin, Texas | |||||||||
| 2005 | 52 | 9 | 2.34 | 1.94 | 0.24 | 1.79 | |||
| 2006 | 52 | 8 | 2.42 | 2.02 | 0.25 | 91 | 79 | 44 | 1.86 |
| 2007 | 54 | 8 | 2.49 | 2.09 | 0.25 | 1.94 | |||
| 2008 | 56 | 8 | 2.59 | 2.19 | 0.26 | 2.05 | |||
| Chatham County, Georgia | |||||||||
| 2005 | 49 | 8 | 2.34 | 1.94 | 0.24 | 1.58 | |||
| 2006 | 52 | 9 | 2.42 | 2.02 | 0.25 | 80 | 79 | 58 | 1.70 |
| 2007 | 57 | 9 | 2.49 | 2.09 | 0.25 | 1.84 | |||
| 2008 | 59 | 9 | 2.59 | 2.19 | 0.26 | 1.96 | |||
| Norfolk, Virginia | |||||||||
| 2005 | 48 | 11 | 2.34 | 1.94 | 0.24 | 1.62 | |||
| 2006 | 46 | 11 | 2.42 | 2.02 | 0.25 | 82 | 78 | 53 | 1.66 |
| 2007 | 47 | 11 | 2.49 | 2.09 | 0.25 | 1.72 | |||
| 2008 | 48 | 11 | 2.59 | 2.19 | 0.26 | 1.81 | |||
| Omaha, Nebraska | |||||||||
| 2005 | 49 | 9 | 2.34 | 1.94 | 0.24 | 1.57 | |||
| 2006 | 57 | 11 | 2.42 | 2.02 | 0.25 | 97 | 91 | 71 | 1.81 |
| 2007 | 50 | 11 | 2.49 | 2.09 | 0.25 | 1.73 | |||
| 2008 | 50 | 11 | 2.59 | 2.19 | 0.26 | 1.80 | |||
| Pajaro Valley, California | |||||||||
| 2005 | 58 | 5 | 2.34 | 1.94 | 0.24 | 1.87 | |||
| 2006 | 56 | 7 | 2.42 | 2.02 | 0.25 | 73 | 59 | 33 | 1.92 |
| 2007 | 55 | 9 | 2.49 | 2.09 | 0.25 | 1.98 | |||
| 2008 | 59 | 9 | 2.59 | 2.19 | 0.26 | 2.13 | |||
NOTES: For Pajaro Valley, the panel was unable to obtain administrative data for the 2005-2006 school year, so certifcation percentages for that year are from the Common Core of Data (CCD). Also, it is assumed that in each year, each district qualifed for the additional reimbursement of $0.02 per meal for having served at least 60 percent of meals free or reduced price 2 years earlier. In addition, it is assumed that offering free meals to all students during the AEO base year will increase participation rates among students otherwise eligible for free, reduced-price, and full-price meals by 5, 7, and 10 percentage points, respectively, relative to the participation rates during the prior year, when the meals programs were operated under traditional procedures. The actual participation effects of offering free meals to all students could be substantially different from what is assumed for one of these districts or any other particular district. AEO = American Community Survey (ACS) Eligibility Option; BRR = blended reimbursement rate.
SOURCE: Prepared by the panel.
| Year | BRR Based on Benchmarked ACS Estimates ($) | BRR Based on Administrative Estimates ($) | Difference ($) | Percentage Difference (%) |
| Austin, Texas | ||||
| 2005 | 1.75 | 1.79 | –0.05 | –3 |
| 2006 | 1.91 | 1.86 | 0.04 | 2 |
| 2007 | 1.99 | 1.94 | 0.05 | 3 |
| 2008 | 2.00 | 2.05 | –0.05 | –2 |
| Chatham County, Georgia | ||||
| 2005 | 1.65 | 1.58 | 0.07 | 4 |
| 2006 | 1.85 | 1.70 | 0.14 | 8 |
| 2007 | 1.83 | 1.84 | –0.01 | –1 |
| 2008 | 1.74 | 1.96 | –0.22 | –11 |
| Norfolk, Virginia | ||||
| 2005 | 1.60 | 1.62 | –0.02 | –1 |
| 2006 | 1.73 | 1.66 | 0.07 | 4 |
| 2007 | 1.63 | 1.72 | –0.10 | –6 |
| 2008 | 1.85 | 1.81 | 0.05 | 3 |
| Omaha, Nebraska | ||||
| 2005 | 1.62 | 1.57 | 0.06 | 4 |
| 2006 | 1.74 | 1.81 | –0.06 | –4 |
| 2007 | 1.64 | 1.73 | –0.09 | –5 |
| 2008 | 1.90 | 1.80 | 0.10 | 6 |
| Pajaro Valley, California | ||||
| 2005 | 1.88 | 1.87 | 0.00 | 0 |
| 2006 | 1.83 | 1.92 | –0.09 | –5 |
| 2007 | 2.04 | 1.98 | 0.06 | 3 |
| 2008 | 2.16 | 2.13 | 0.02 | 1 |
NOTE: AEO = American Community Survey (ACS) Eligibility Option; BRR = blended reimbursement rate.
SOURCE: Prepared by the panel.
| Benchmarked Eligibility Percentage (2008) (%) | (Assumed) Base-Year Participation Rate (%) | Initial Claiming Percentage (%) | |||||||
| District | Free | Reduced Price | Free | Reduced Price | Full Price | Free | Reduced Price | Full Price | |
| Austin, Texas | 53 | 8 | 91 | 79 | 44 | 67 | 9 | 24 | |
| Chatham County, Georgia | 52 | 5 | 80 | 79 | 58 | 59 | 6 | 35 | |
| Norfolk, Virginia | 51 | 10 | 82 | 78 | 53 | 59 | 11 | 30 | |
| Omaha, Nebraska | 54 | 12 | 97 | 91 | 71 | 60 | 12 | 28 | |
| Pajaro Valley, California | 60 | 9 | 73 | 59 | 33 | 74 | 9 | 17 | |
NOTES: It is assumed that offering free meals to all students during the American Community Survey (ACS) Eligibility Option (AEO) base year will increase participation rates among students otherwise eligible for free, reduced-price, and full-price meals by 5, 7, and 10 percentage points, respectively, relative to the participation rates during the prior year, when the meals programs were operated under traditional procedures. The actual participation effects of offering free meals to all students could be substantially different from what is assumed for one of these districts or any other particular district.
SOURCE: Prepared by the panel.
TABLE 5-20 Step 7a: Benchmark Newly Released ACS Eligibility Percentages
| Unbenchmarked 1-Year ACS Estimate (2009) (%) | Benchmarking Adjustment (%) | Benchmarked Eligibility Percentage (2009) (%) | ||||
| District | Free | Reduced Price | Free | Reduced Price | Free | Reduced Price |
| Austin, Texas | 49 | 10 | 15 | -2 | 63 | 8 |
| Chatham County, Georgia | 39 | 14 | 18 | -7 | 57 | 7 |
| Norfolk, Virginia | 44 | 7 | 1 | -3 | 45 | 4 |
| Omaha, Nebraska | 46 | 11 | 11 | 0 | 58 | 11 |
| Pajaro Valley, California | 37 | 14 | 23 | -9 | 60 | 5 |
NOTE: ACS = American Community Survey.
SOURCE: Prepared by the panel.
TABLE 5-21 Step 7b: Update AEO Claiming Percentages
| Benchmarked Eligibility Percentage (2009) (%) | (Assumed) Base-Year Participation Rate (%) | Updated Claiming Percentage (%) | ||||||
| District | Free | Reduced Price | Free | Reduced Price | Full Price | Free | Reduced Price | Full Price |
| Austin, Texas | 63 | 8 | 91 | 79 | 44 | 75 | 8 | 16 |
| Chatham County, Georgia | 57 | 7 | 80 | 79 | 58 | 63 | 8 | 29 |
| Norfolk, Virginia | 45 | 4 | 82 | 78 | 53 | 55 | 5 | 41 |
| Omaha, Nebraska | 58 | 11 | 97 | 91 | 71 | 63 | 11 | 25 |
| Pajaro Valley, California | 60 | 5 | 73 | 59 | 33 | 75 | 5 | 19 |
NOTES: It is assumed that offering free meals to all students during the American Community Survey (ACS) Eligibility Option (AEO) base year will increase participation rates among students otherwise eligible for free, reduced-price, and full-price meals by 5, 7, and 10 percentage points, respectively, relative to the participation rates during the prior year, when the meals programs were operated under traditional procedures. The actual participation effects of offering free meals to all students could be substantially different from what is assumed for one of these districts or any other particular district.
SOURCE: Prepared by the panel.
IMPLEMENTATION OF THE AEO UNDER SPECIAL CIRCUMSTANCES
This section addresses implementation of the AEO in a group of schools within a district and by a district or group of schools already operating under Provision 2 or 3. It also describes adjustments made to benchmarked ACS estimates to reflect large numbers of special populations not well captured in the ACS, such as the homeless or migrants living in labor camps.
Implementing the AEO for a Group of Schools Within a District
If a district does not want to implement the AEO in all of its schools for financial or other reasons, it can assess the benefits and costs of implementation in a group of schools within the district. The following steps can be carried out by a district that is potentially interested in the AEO for a group of its schools:
- Conduct a preliminary assessment of the use of benchmarked ACS estimates to implement the AEO for the entire district.
- Identify the group of schools in which the AEO might be implemented.
- Obtain ACS estimates for that group of schools.
- Follow the seven steps for assessing and implementing the AEO for an entire district, treating the group of schools as if it were a district.
Step 1: Conduct a Preliminary Assessment of the Use of Benchmarked ACS Estimates to Implement the AEO for the Entire District
Although ACS estimates for the entire district will be readily available, obtaining estimates for individual schools or a group of schools will involve more substantial effort. Therefore, the panel suggests that the district begin its empirical assessment of the AEO by using the ACS estimates that are readily available and carrying out the first two steps in the procedure for districtwide adoption of the AEO, as described earlier in this chapter. If financial considerations are causing the district to explore the adoption of the AEO in only a group of its schools, the BRRs that are calculated for the entire district will likely appear too low and should not deter the district from continuing its assessment of the AEO. Instead, the district’s preliminary assessment should focus on determining whether the BRRs based on benchmarked ACS estimates for the entire district are sufficiently stable. If so, the district should proceed to the next step. If not, the BRRs pertaining to only a group of schools may exhibit
too much volatility from year to year. In that case, the district may not want to devote further resources to consideration of the AEO. On the other hand, the BRRs for a homogenous group of schools may be more stable than the BRRs for the more heterogeneous collection of schools that constitutes the entire district.
Step 2: Identify the Group of Schools in Which the AEO Might Be Implemented
Several nonfinancial and nonstatistical considerations, including the typography of the district and local politics, will potentially influence which schools are selected for this group. An important financial consideration is that the group of schools as a whole should have a high percentage of students certified to receive free or reduced-price meals—on the order of, perhaps, 75 percent. A statistical consideration is that the group of schools should have sufficiently high aggregate enrollment to make it likely that ACS estimates for the group will remain stable from year to year. Based on results presented in Chapter 4, a general rule of thumb is that the schools in the group should have a combined enrollment of at least 400. The district’s selection of schools will be determined by such financial and statistical considerations and any other considerations it regards as important.
Step 3: Obtain ACS Estimates for That Group of Schools
Districts will need to develop attendance boundary information for their selected group of schools. This information may be in the form of a list of census blocks that make up the attendance areas for the schools, as well as school-specific information on grade structure. In some situations, boundary information may be readily available from a local planning office. Districts will need to provide this information in their request to FNS. FNS will collect all such requests and submit them to the Census Bureau once a year. The timing of the process will be determined by FNS in consultation with the Census Bureau. ACS estimates for the selected geographic areas containing the group of schools will be provided by the Census Bureau from at least the four most recent ACS data releases.
Step 4: Follow the Seven Steps for Assessing and Implementing the AEO for an Entire District, Treating the Group of Schools as If It Were a District
The district will next need to follow each of the seven steps outlined in the previous section, but treat the group of schools it has selected as if it were a district
Implementing the AEO in Provision 2 and 3 Districts
The AEO is likely to be of greatest interest to districts that are already operating under Provision 2 or 3. However, these districts will not have available the data needed to use the methodology described above, even though they may well be the districts that would benefit most from the AEO. This section describes how these districts could shift to the AEO without conducting a new base year. However, the panel recognizes that this approach locks in place estimates that are of unknown quality, and there are policy issues to be considered in deciding whether to implement the approach.
The calculations specified in this section assume that the only data available for districts that are currently operating under Provision 2 or 3 are the claiming percentages developed during the base year—that is, there are no administrative data on the distribution of students across categories. An implication of this assumption is that participation rates cannot be calculated. An alternative approach, similar to the approach described above for all districts, is possible if the Provision 2 or 3 base-year data on certification percentages, total enrollment, and counts of meals served are also available. With these additional data, it is possible to calculate participation rates. The advantage of this alternative approach is that the district would have benchmarked eligibility percentages from the ACS in addition to claiming percentages. The benchmarked eligibility percentages could be used to satisfy the data needs of other programs, as discussed below.
For districts currently operating under Provision 2 or 3, no AEO base year would be required. Hence, there would be no return to the taking of applications or other traditional operating procedures during the transition from Provision 2 or 3 to the AEO, although a district could do so if it wished. A district operating under Provision 2 or 3 would need to wait until at least four sets of ACS estimates were available.17 If Provision 2 or 3 had been implemented for a group of schools, the district would need to obtain boundary information for those schools and submit the request for ACS estimates to FNS.18 The four steps for implementing the AEO in a Provision 2 or 3 district (or group of schools) are described below.
____________
17 For small districts, the fourth set of 5-year estimates (for 2008-2012) will be available in early 2014. For medium and large districts, there are already at least four sets of 3- and 1-year estimates.
18 It may be feasible for the AEO to be implemented in a group of schools that is not identical to the group operating under Provision 2 or 3. The panel, however, has not addressed those details.
Step 1: Calculate Benchmarked ACS Estimates
For Provision 2 or 3 districts, the initial calculations in the benchmarking process are shown in Box 5-7. However, because these estimates are based on 4 years of ACS data, and there is no base year, the benchmarking adjustments are the final adjustments that will be used annually to update ACS estimates for use as claiming rates under the AEO.
The benchmarking adjustments are different only in that they are based on the differences between the Provision 2 or 3 claiming percentages (rather than average certification percentages) and average ACS eligibility percentages. The benchmarking adjustments for a small district are shown in Box 5-7. For a medium district, the AEO Calculator will produce two additional benchmarking adjustments: one for the 3-year estimates of the percentage of students eligible for free meals and one for the 3-year estimates of the percentage of students eligible for reduced-price
BOX 5-7
Calculating ACS and Administrative Averages and Benchmarking Adjustments Provision 2 or 3 Districts
Step 1a: Calculate averages of ACS estimates
![]()
where k = 1, 3, or 5, indicating whether the average pertains to 1-, 3-, or 5-year ACS estimates.
Step 1b: Calculate benchmarking adjustments (illustrated for 5-year estimates)
For a small district, there are two benchmarking adjustments:
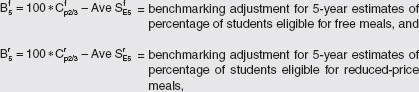
where Cp2/3 and Cpr2/3 are the claiming rates for free and reduced-price meals, respectively, under Provision 2 or 3.
SOURCE: Prepared by the panel.
meals. For a large district, the AEO Calculator will produce two more benchmarking adjustments, which correspond to the 1-year estimates.
The benchmarked ACS estimates shown in Box 5-8 reflect adjusted claiming percentages rather than eligibility percentages. For a small district, the AEO Calculator will produce eight such benchmarked estimates. The same approach will be used for benchmarking 3- and 1-year ACS estimates for medium and large districts.
Box 5-9 illustrates the calculation of the BRRs based on the bench-marked ACS estimates for the past 4 years for a small district. In addition to the BRRs based on the benchmarked 5-year ACS estimates, a medium district will examine six BRRs based on the benchmarked 3-year estimates, and a large district will also examine eight BRRs based on the benchmarked 1-year estimates.
BOX 5-8
Benchmarking of ACS Estimates Provision 2 or 3 Districts
Step 1d: Calculate benchmarked ACS claiming percentages (illustrated for 5-year estimates)
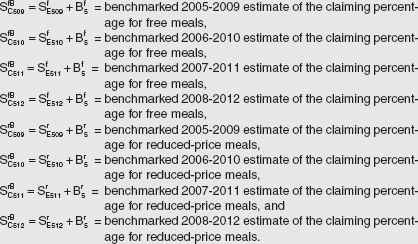
SOURCE: Prepared by the panel.
BOX 5-9
Calculating Blended Reimbursement Rates Based on Benchmarked ACS Claiming Percentages in Provision 2 or 3 Districts
Step 1d: Calculate BRRs (illustrated with 5-year estimates)
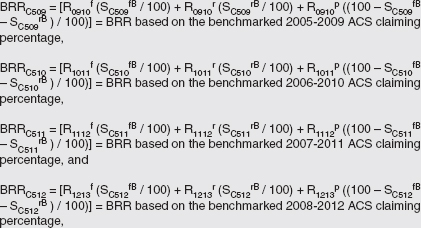
where Rf, Rr, and Rp, respectively, are the district’s per meal reimbursement rates for free, reduced-price and full-price meals (with subscripts referencing school years).
SOURCE: Prepared by the panel.
Step 2: Conduct an Assessment of the Use of Benchmarked ACS Estimates to Implement the AEO
The district will examine the BRRs calculated in Step 1 to determine whether they are sufficiently stable from year to year and within an acceptable range for operating the school meals programs. For this assessment, the AEO Calculator can multiply each BRR, which gives the average reimbursement per meal, by a recent monthly or annual figure for the total number of meals served to estimate the total reimbursement the district would have received based on the benchmarked ACS estimates. The district can also compare the BRRs based on benchmarked ACS estimates with BRRs based on the district’s claiming percentages under Provision 2 or 3, derived by the AEO Calculator using the BRR formulas in Box 5-9—the benchmarked ACS claiming percentages being replaced
by the Provision 2 or 3 claiming percentages. While small districts will examine the benchmarked 5-year estimates in their assessment, medium districts can also consider the benchmarked 3-year estimates, weighing the generally greater stability associated with 5-year estimates against the generally greater responsiveness to socioeconomic change associated with the 3-year estimates. Large districts can consider benchmarked 5- and 3-year estimates, as well as benchmarked 1-year estimates, which are generally the least stable but the most responsive to change. If a large district determines that the BRRs based on 1-year estimates fluctuate too much from year to year, it may find that the BRRs based on 3- or 5-year estimates are sufficiently stable.
When conducting its assessment, a district should examine especially carefully the 1-year estimates for 2010, 2011, and 2012; the 3-year estimates for 2008-2010, 2009-2011, and 2010-2012; and the 5-year estimates for 2006-2010, 2007-2011, and 2008-2012. These estimates will reflect the effects of using the new ACS population controls based on the 2010 decennial census. If the BRRs based on these estimates are substantially higher or lower than BRRs based on previous estimates, the district should consider waiting another year until the 2013, 2011-2013, and 2009-2013 ACS estimates are released, allowing the assessment of four BRRs constructed from benchmarked ACS estimates based on the new population controls.
Step 3: Make a Decision About Adopting the AEO and Obtain Necessary Approvals
Based on its assessment in Step 2, a district will decide whether to adopt the AEO. If a district concludes from its assessment that it will be financially viable to operate under the AEO using benchmarked ACS estimates and that BRRs are likely to be sufficiently stable, the district may want to adopt the AEO. If the BRRs fall outside an acceptable range or are excessively variable, the district can cease its consideration of the AEO or conduct further research to determine, for example, whether a different adjustment method would improve the estimates.
A large district will have to determine whether it wishes to base its claiming rates on benchmarked 1-, 3-, or 5-year estimates, while a medium district will have to choose between benchmarked 3- and 5-year estimates as the basis for its claiming rates. If a district chooses to base its claiming rates on the k-year estimates, where k = 1, 3, or 5, its AEO claiming rates based on 2012 data will be calculated as shown in Box 5-10. These are the claiming rates that will be used during school year 2014-2015.
To obtain approval for adopting the AEO, the district will have to comply with any regulations or other requirements imposed by FNS and state and local authorities.
BOX 5-10
Calculation of AEO Claiming Rates for Use in 2014-2015 Provision 2 or 3 Districts
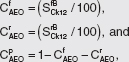
where SCfBk12 and SrCBk12 are the benchmarked k-year estimates (k = 1, 3, or 5) from the most recent release of ACS estimates (assumed for this example to be the 2012, 2010-2012, or 2008-2012 estimates).
SOURCE: Prepared by the panel.
Step 4: Update Claiming Rates for Ongoing Operation of the AEO
If a district’s request for approval to adopt the AEO is granted, the district will update its claiming rates each year based on the most recently released ACS estimates as shown in Box 5-11. The benchmarking adjustments will be used indefinitely as long as the district operates under the AEO. The district will continuously assess whether the AEO is meeting the district’s objectives. If it is not, the district can return to traditional operating procedures or Provision 2 or 3 at any time, subject to whatever conditions are specified by FNS or state or local authorities.
Adjusting for Students Living in Nontraditional Housing19
As discussed in Chapter 4, one reason for discrepancies between ACS and administrative estimates is that the ACS estimates for school districts exclude students who do not live in traditional housing. However, homeless students and students living in migrant labor camps, for example, are likely known to school districts (which receive lists of such students), and they are categorically eligible for free meals. A school district that has a substantial number of such students and has data for at least 3 years should consider an adjustment to its ACS estimates.
____________
19 To adjust for seasonal fluctuations in the student population associated, for example, with the movement of migrant workers, districts can replace their October certification estimates with averages based on the entire school year.
BOX 5-11
Benchmarking Future ACS Estimates and Updating of AEO Claiming Rates Provision 2 or 3 Districts
Assume that the district is using the k-year ACS estimates to establish claiming rates. Then the benchmarked ACS claiming percentages are
![]()
where TT is the last year in the reference period for the k-year estimates (e.g., TT = 13 for the 5-year estimates for 2009-2013), and Bkf and Bkr are the benchmarking adjustments calculated in Step 1.
AEO claiming rates are
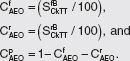
SOURCE: Prepared by the panel.
In addition to certification rates and participation rates for at least 3 years, the district will need to have total enrollment (E) and the total number of students who live in nontraditional housing and are categorically eligible for free meals (H) in each year. The adjustment will be applied to ACS eligibility estimates, before benchmarking, as illustrated in Box 5-12. The adjusted ACS estimates will then be used in all benchmarking equations instead of the unadjusted numbers.
The accuracy of both ACS and administrative estimates may vary over time. ACS sample sizes may be cut. Continued improvements in direct certification may reduce certification error. Some changes in the quality of estimates may affect the accuracy and stability of AEO benchmarking adjustments for districts that are considering the AEO, as well as districts that have already adopted it. Thus, it is important that FNS track such changes, identify their causes, and assess their implications.
These activities should be conducted for a broad sample of districts that are potential candidates for adopting the AEO but are not operating
BOX 5-12
Adjustment of ACS Eligibility Percentages to Account for Students Who Live in Nontraditional Housing
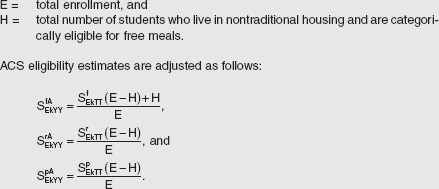
SOURCE: Prepared by the panel.
under the AEO or any other special provision or option.20 Within this sample, separate analyses should be performed for high and very high FRPL districts (or for a more detailed categorization of districts) and for small, medium, and large districts. Because the districts in the sample are operating under traditional procedures, ACS eligibility estimates can be compared with administration certification estimates, as the panel has done in this report.
FNS also should monitor the accuracy of ACS eligibility estimates for districts that have already adopted the AEO and are no longer certifying students. To facilitate such monitoring, the panel suggests that FNS allow districts that have adopted the AEO to continue working with state agencies to match district enrollment lists with lists of SNAP recipients, as is done for direct certification, and derive SNAP recipiency rates.21 Then, the relationships between these SNAP recipiency rates and ACS eligibility estimates can be analyzed to identify districts with substantial changes
____________
20 One limitation of this sample for learning about changes that might be affecting districts that have already adopted the AEO is that it will become more selective over time, consisting of proportionately more districts for which the AEO is not attractive.
21 Temporary Assistance for Needy Families (TANF) and Food Distribution Program on Indian Reservations (FDPIR) lists can also be used if the district has previously used them for direct certification.
over time. Analyses can be conducted not only for the districts that have adopted the AEO but also for districts that are still potential candidates for doing so.22
The AEO may give school districts a new opportunity to provide free meals to all students. The AEO base year is essentially the same as a Provision 2 base year. During this year, the district continues to take applications, conduct verifications, and count meals served by category; however, all meals are served free. During the base year, the district is reimbursed based on meals served by category as in the traditional approach. The increase in participation due to offering free meals to all students can then be estimated and incorporated into claiming percentages.
There are several key differences between the AEO and Provision 2. First, under the AEO, no additional base years are required because the ACS estimates released each year provide the means for updating claiming percentages in response to changing socioeconomic conditions. Even schools operating under Provision 2 or 3 may find the AEO attractive because it eliminates the requirement to conduct a base year every 4 years. Second, as just noted, districts need not rely on exactly the same claiming percentages every year under the AEO. Instead, with estimates provided annually by a highly credible and reliable source, the U.S. Census Bureau, districts can use the AEO Calculator to determine updated benchmarked eligibility percentages and claiming percentages that are then used in conjunction with the total number of meals served to determine monthly reimbursements. Third, if a school or district has high numbers of homeless students or migrant students living in nontraditional housing, the district also can adjust the ACS estimates to include those students.
Adopting the AEO will not be burden-free for states and districts, although the tasks they will need to perform are completely different from those required by current administrative processes. If districts wish to implement the AEO for only a group of schools, for example, they must be able to provide accurate geographic boundary information on the attendance areas encompassed by that group of schools.23 Ideally, this information will be provided to the Census Bureau through FNS and will consist of a list of the census blocks that make up the school catchment areas of interest. Furthermore, a district may need to address limitations
____________
22 If a district is operating under the AEO in a subgroup of schools, the analysis can be conducted for that subgroup.
23 Implementation districtwide will be easier in this regard because the Census Bureau maintains school district boundaries through its biennial School District Review Program.
BOX 5-13
Other Uses of Data on Students Certified for Free and Reduced-Price Meals
School meals program certification status is widely used to measure whether students are economically disadvantaged. One of the most significant uses is for Title I, Part A of the Elementary and Secondary Education Act of 1965 (ESEA), as amended. Under ESEA section 1113, a local education agency (LEA) must rank its schools based on the percentage of economically disadvantaged students in each school to determine a school’s eligibility for receiving Title I funds and to allocate funds to selected schools.
To meet these requirements, an LEA must have school-level data on individual economically disadvantaged students. For many districts, information from the National School Lunch Program is likely to be the best, and perhaps the only, source of data available to identify those students. Moreover, in the case of the priority for public school choice and eligibility for supplemental education services, the No Child Left Behind Act of 2001 (NCLB) specifically requires a district to use the same data it uses for making within-district Title I allocations: historically, most LEA’s use school lunch data for that purpose.a
In May 2011 the Department of Education issued guidance to state education officers on how to report the percentage of economically disadvantaged students and assess economic status for individual students under the new Community Eligibility Option (CEO). The guidance states that all students in a CEO school, just as in Provision 2 and 3 schools, are to be reported as economically disadvantaged
of the ACS. For example, the ACS does not represent all populations with equal accuracy. If a school or district has high numbers of homeless students or migrant students living in nontraditional housing, it will be in the district’s interest to augment and refine its ACS estimates with supplementary information available at the local level. The accuracy of the ACS information also is affected by the degree to which open enrollment policies, charter schools, and other school choice opportunities affect whether students attend schools outside their normal attendance areas. States and districts, perhaps in collaboration with FNS or other agencies, will need to determine whether such local attendance policies have an effect on the accuracy of ACS estimates and whether the proposed benchmarking procedure corrects effectively for any errors. An individual district will also be able to monitor whether the number of students exercising the choice to leave the district is rising sharply. If the district has not yet adopted the AEO, certification data are available for use in comparing certification
for purposes of NCLB accountability reporting, implementing supplemental educational services, and identifying priority for school choice. When annually ascertaining the eligibility of a CEO school to receive Title I funding and determining its Title I allocation, LEAs are instructed that the percentage of economically disadvantaged students is equal to the percentage of meals reimbursed at the free rate—that is, the product of the statutory multiplier specified in the Healthy, Hunger-Free Kids Act (initially 1.6) and the percentage of “identified” students in the school during either the base year or a more recent year (up to a maximum of 100 percent). Provision 2 and 3 schools use the number of free and reduced-price students identified in the base year divided by enrollment in that year.
In our survey of Provision 2 and 3 districts (see Appendix E), the panel identified other uses of free and reduced-price data in addition to Title I and NCLB. One commonly mentioned program is E-rate.b Districts also noted the need for individually identifiable data for grants and for waived and reduced textbook, activity, and other fees for qualifying students. Typically, a family is asked to complete a waiver to allow sharing of individually identifiable eligibility information on free and reduced-price meal status (which otherwise is considered confidential) for purposes of obtaining waived and reduced fees and other benefits.
____________
aFrom Department of Education memorandum to State Education Officers from Commissioner of Education, Hanely, May 20, 2011.
bThe Schools and Libraries Program of the Universal Service Fund, commonly known as E-Rate, is administered by the Universal Service Administrative Company under the direction of the Federal Communications Commission. It provides discounts to assist most schools and libraries in the United States in obtaining affordable telecommunications and Internet access. See http://www.universalservice.org/sl/about/overview-program.aspx.
SOURCE: Prepared by the panel.
percentages for students who have exercised choice opportunities and left the district with the certification percentages for students who have remained enrolled in district schools. If certification data are no longer available because the district has already adopted the AEO, the district will be able to match enrollment lists with SNAP records to derive SNAP recipiency rates, as described above. Then, the district will be able to compare SNAP recipiency rates for students who have left and those who remain. Such comparisons will reveal whether school choice opportunities are disproportionately attracting students from higher- or lower-income families and changing the composition of students who remain enrolled in the district in terms of their eligibility for free or reduced-price meals.24
____________
24 The analyses described can be performed for the schools in which the AEO has been or might be adopted, rather than for the whole district.
The methodology proposed by the panel provides a district with estimates that it can use to fulfill other data requirements. Box 5-13 describes some of these uses. Benchmarked eligibility percentages, for example, can be used in place of aggregate certification percentages for purposes of ranking schools based on the percentages of economically disadvan-taged children. As with Provisions 2 and 3 and the Community Eligibility Option (CEO), for purposes of Title I reporting of progress of students toward meeting education goals by subgroup, all students attending an AEO school can be classified as economically disadvantaged. Other needs for data concerning the status of economically disadvantaged children can similarly be met with one of these two approaches.


