
Model-Based Estimates for School Districts and School Attendance Areas
For all school districts in the Census Bureau’s Topologically Integrated Geographic Encoding and Referencing (TIGER) database, the Small Area Income and Poverty Estimates Program (SAIPE), operated by the Census Bureau, has been releasing annual estimates for the number of related1 children aged 5-17 living in families with income below the poverty level since 1999.2 Title I of the No Child Left Behind Act of 2001 directed the U.S. Department of Education to allocate $14 billion to school districts based on SAIPE results.3
The SAIPE model estimates are produced for a given year with about a 1-year time lag. For example, 2008 estimates were released in December 2009; they incorporated administrative records information for 2007. This schedule is only a few months later than the release of direct American Community Survey (ACS) estimates. The SAIPE model-based estimates have the advantage of reducing mean squared error compared with direct estimates for small geographic areas; however, their accuracy depends on the validity of the underlying model and may vary for different kinds of areas. SAIPE estimates are not available for census tracts or block groups, and they pertain to the official statistical poverty level and not the 130 percent and 185 percent ratios of income to the poverty level that determine
____________
1 Related children are people who are aged 5-17 and related by birth, marriage, or adoption to the householder of the housing unit in which they reside; foster children, other unrelated individuals, and residents of group quarters are not considered related children.
2 Estimates were also released in 1995 and 1997.
3 The development of SAIPE is described in National Research Council (2000a,b).
eligibility for free and reduced-price school meals, respectively. The panel partnered with the Census Bureau to develop model-based estimates for the percentages of public school children who are eligible for free and reduced-price meals. The model was developed in a short period of time and with limited resources, and should be viewed as a proof of concept. The work on developing and evaluating the model led to the identification of research topics that could be used to improve the model in the future should resources become available.
HIGHLIGHTS OF THE SAIPE ESTIMATION PROCESS4
The SAIPE estimation process entails several steps. First, state-level poverty estimates are developed for ages 0-4, 5-17, 18-64, and 65 and older. There are two equations for ages 5-17—one for all children and one for related children. These estimates are based on a weighted average of a direct ACS estimate and a prediction from a regression model. The dependent variable in the model is the ACS 1-year direct estimate.5 Independent variables include the poverty rate from the 2000 census, the tax return poverty rate, the tax return nonfiler rate, a Supplemental Nutrition Assistance Program (SNAP, formerly the Food Stamp Program) participation ratio, and the Supplemental Security Income (SSI) receipt rate. The regression-based and ACS-based estimates are combined, each being weighted according to the associated uncertainty, with the more uncertain estimate having less weight. The poverty ratios obtained are multiplied by population estimates to provide counts of the number of people in poverty, which are controlled to sum to the official national total from the ACS.
Second, county-level estimates are developed. Like the state estimates, the county estimates are based on a weighted average of direct ACS estimates and regression predictions. The dependent variable in each regression model is the log of the number of people in a particular age category in that county as measured by the ACS. Predictor variables (appropriately transformed) include the number of child exemptions claimed on tax returns of people in poverty, the number of child exemptions on tax returns, the number of SNAP benefit recipients, the resident population, and the estimated number of people in the age category in poverty according to the 2000 census. Weighting of the ACS and model estimates
____________
4 This section comes from documentation on the Census Bureau’s website, with some minor editing. See http://www.saipe.gov/did/www/saipe/methods/schools/data/20062008.html.
5 ACS direct estimates are estimates produced for a population group, time frame, and geographic area based only on ACS data and the ACS methods documented by the Census Bureau.
is based on the uncertainty associated with each estimate. For counties for which there are no ACS sample observations in the age category, the weight on the model’s prediction is 1. County estimates are adjusted so they sum to the state total from the previous step.
State- and county-level estimates are provided along with estimates of their uncertainty, measured as a margin of error. The margin of error is the half-width of a 90 percent confidence interval for an estimate and is equal to 1.645 times the standard error. The standard errors represent “uncertainty” arising from two major sources: ACS sampling variation and lack of fit of the regression model to what the ACS measures. In general, the former error is larger than the latter.
Finally, school district-level estimates are developed using a “shares methodology,” a way of creating estimates for sub-jurisdictions from estimates for the jurisdiction. Counties are divided into school districts, parts of school districts (for districts that cross county lines), and possibly residual pieces not in any school district. The division may be done separately by grade and type of school. For the 2008 SAIPE estimates, the child poverty shares for each subcounty portion of a school district were constructed by combining the shares from two data sources—2010 decennial Census direct estimate poverty shares and child tax poverty shares. Not all tax returns can be exactly located at the subcounty level, so in areas with less reliable subcounty tax data, the SAIPE estimate relies more heavily on the decennial census share. The precise method used for combining these two shares is termed the minimum change method, Maples and Bell (2007). For each school district and school district piece, estimates are derived for the total population, children aged 5-17, and related children aged 5-17 in families in poverty. Margins of error are not currently provided for school district-level estimates, although the Census Bureau continues to conduct research on the estimation of standard errors for school district-level estimates.
The 2008 school district estimates are based on the 2008 county estimates and tabulations of poverty from the 2000 census and income tax data for tax year 2007 from the Internal Revenue Service (IRS), using school district boundaries corresponding to school year 2007-2008. By construction, the SAIPE school district estimates are arithmetically consistent with the SAIPE county and state estimates.
MODEL SPECIFICATION FOR SCHOOL MEALS PROGRAMS6
Census Bureau staff noted the following challenges in adapting the SAIPE-like model to produce estimates of eligibility for the school meals programs.
- To follow the log-level structure of the SAIPE model would require an estimate of the universe. In the case of the school meals programs, the universe contains children aged 0-19 attending public school. The only source for public school attendance consistent with Census Bureau population and survey estimates is the ACS. This source would inject additional sampling error into the estimates and suggests the possible desirability of modeling public school enrollment.
- County-level modeling of the log of survey-weighted counts causes removal of counties with zero estimates. In the 2009 ACS, about 4 percent of 3,143 counties had zero estimates of eligibility for free meals, and 21 percent had zero estimates for reduced-price meals. This demonstrates two points: (1) deleting these observations to take logs appeared to be more severe than including them in a continuous distribution rate model, and (2) work done by Elizabeth Huang and Jerry Maples of the Census Bureau indicates potential serious bias for successive difference variance estimates of log quantities with small sample sizes.
- SAIPE is designed for Title I allocations, which is a “fixed-pie” funding program; that is, the total funding for Title I is fixed so that an increase in the amount allocated to one jurisdiction entails a decrease in the amounts allocated to one or more other jurisdictions. Therefore, national consistency among the level estimates and top-down controls are important. The school meals programs are fully funded, and the target estimates are eligibility rates.
- To produce accurate (unbiased) estimates of the parameters, the Census Bureau decided to estimate the parameters at the county level, where zero eligible in a sample is less prevalent. However, since a lagged ACS survey variable was also included, the assumption of constant parameters across all sizes of districts may be untenable.
- To allow for variable parameters, separate parameter estimates were produced for each of three partitions (0-20,000 residential population, 20,000-65,000, and 65,000+). All parameters (regres-
____________
6 This is an edited version of documentation provided to the panel on May 12, 2011, by the U.S. Census Bureau.
sion coefficients and model error variance) may differ from one partition to another.7
For the school district-level model, the Census Bureau chose a Fay-Herriot structure similar to SAIPE production, but on an unlogged rate scale8 rather than log-levels. Parameters were estimated independently for both the free and reduced-price eligibility rates at the county level and then applied to school district-level auxiliary data. No raking to higher levels was performed.
County-Level Model
The empirical Bayes model of eligibility rates reflects the general shrinkage form suggested by Fay and Herriot (1979). The model is
![]()
and
![]()
where for a given year and county i,
• yi = ACS direct survey estimate of free (or reduced-price) eligibility rate;
____________
7 The SAIPE county model estimates one set of parameters across all counties. For the school meals programs, the Census Bureau addressed the issues of size variation by using the size partitions associated with 1-year, 3-year, and 5-year ACS estimates. These models may or may not adequately represent school districts within a county that may be very small and have very different urban/rural or other important properties. Census Bureau analysts stated that they do not have solid evidence as to whether the quality of the estimates can be extrapolated to very small areas. They did perform residual analysis, whereby it does not appear visually that excessive outliers are present at smaller sizes, but do not have any statistical testing to report. Appropriate partitioning and evaluation for very small areas is an ongoing field of research at the Bureau. The models for the school meals programs could similarly benefit from additional research.
8 The analysis conducted made it clear that a log transformation was not a good approach. However, no extensive specification search was performed for other transformations, and no testing for linearity of the chosen specification was conducted because of time and resource constraints. This could be a topic for further research. However, the range of estimates did not appear to be that extreme. There were outliers at 0 and 100, but excluding these, the 10th and 90th percentiles for the 2009 ACS dependent variables at the county level were 14-57 percent for free eligibility rates and 1-21 percent for reduced-price eligibility rates. Census Bureau analysts believed that one of the data characteristics driving poor fit for the reduced-price eligibility model was the limited range of the dependent variable.
• Yi = true population value of free (or reduced-price) eligibility rate;
• ei = yi - Yi = sampling error in yi as an estimate of Yi;
• xi = vector of regression variables (see below);
• βk = vector of regression parameters for partition k (population size), k = {k1, k2, k3};
— k1 = counties with population less than 20,000;
— k2 = counties with population greater than or equal to 20,000 but less than 65,000; and
— k3 = counties with population greater than or equal to 65,000;
• ui = random model error (county random effect);
• vi = a generalized variance function (GVF) representation of the ACS sampling variance (the GVF is described below); and
• ![]() = the model variance associated with partition k.
= the model variance associated with partition k.
The independent variables that constitute the vector xi in the free eligibility model and reduced-price eligibility model are as follows:
• Free eligibility model
— Tax income/poverty ratio—the ratio of the number of child exemptions in households with income less than or equal to 130 percent of the poverty level to the total number of child exemptions in the county
— Child tax coverage ratio—the ratio of the number of child exemptions on tax returns in the county divided by the total household population with age less than or equal to 19
— Four-year average ACS rate—the average of the free eligibility rates for the other 4 years of the ACS9
• Reduced-price eligibility model
— Tax income/poverty ratio—the ratio of the number of child exemptions in households with income greater than 130 percent of the poverty level but less than or equal to 185 percent of the poverty level to the total number of child exemptions in the county
— Four-year average ACS rate—the average of the reduced-price eligibility rates for the other 4 years of the ACS
Estimation of the parameters proceeds on the assumption that ACS sampling variances are known, using the GVF estimate, ![]() , described below and iterating the weighted least squares regression equations to the maximum-likelihood estimate of the model variance
, described below and iterating the weighted least squares regression equations to the maximum-likelihood estimate of the model variance ![]() for each partition k.
for each partition k.
____________
9 For example, in the model for 2008, this predictor is the average of the estimates for 2005, 2006, 2007, and 2009.
The GVF model used is as follows:
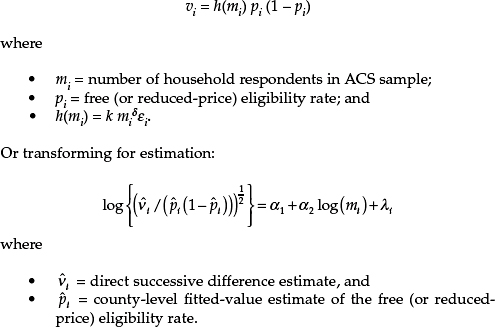
The parameters α1 and α2 were estimated with simple linear regression. The estimated value a2 varies from -0.44 to -0.45 for all years, implying an exponent on mi of nearly negative 1.
School District-Level Estimates
For school district j in county i, there are two estimates for Y: the ACS direct estimate and a predicted value derived by plugging school district-level independent variables into a model with estimated parameters from the county-level model. Values for the school district tax variables—tax income/poverty ratio free, tax income/poverty ratio reduced-price, and child tax coverage level—are calculated using minimum-change synthetic estimates.10 Then, shrinkage estimates (empirical best predictions) for school districts (i.e., predictions of Y for school district j) and the corresponding prediction error variances are computed by plugging the parameter estimates into the following standard formulas (Bell, 1999):
____________
10 The tax variables are prepared by tallying all tax returns that have been coded to a specific district within a county and adding in a “synthetic” estimate for those tax returns that have been coded to the county but not to a specific district. The method used is described in Maples and Bell (2007).
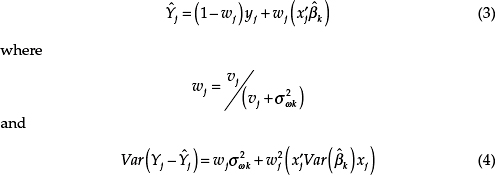
The parameters ![]() and variance
and variance ![]() are estimates from the county model. The parameter vj is the GVF estimate11 for the variance of the direct ACS estimate for the district.
are estimates from the county model. The parameter vj is the GVF estimate11 for the variance of the direct ACS estimate for the district.
The standard error estimator in equation (4) does not account for estimation error in ![]() ; an asymptotic correction for this error was found to be small in the past. Similarly, the estimator does not account for the varying quality of the synthetic estimates of the independent variables across school districts. Hence,
; an asymptotic correction for this error was found to be small in the past. Similarly, the estimator does not account for the varying quality of the synthetic estimates of the independent variables across school districts. Hence, ![]() may be underestimated, leading to reported standard errors that are too low. Future research may be needed to address this issue.
may be underestimated, leading to reported standard errors that are too low. Future research may be needed to address this issue.
Results and Evaluation
Regression results for 2009, including estimated coefficients and summary statistics, are shown in Table C-1. Figure C-1 displays the median free and reduced-price eligibility rates estimated by the model over time. The median free eligibility rate showed a slight upturn in 2009, while the reduced-price eligibility rate was relatively flat. Figure C-2 shows the average across districts of 5-year ACS eligibility rates for free and reduced-price meals by size of school district. Figure C-3 shows the medians (across districts) of the relative standard errors for percentages eligible for free meals estimated by the model and from the 5-year and 1-year ACS by size of school district. Figure C-4 shows the same thing for percentage eligible for reduced-price meals. Figures C-5 and C-6, respectively, show the medians of the root mean squared difference (RMSD)12 (a measure of variation over time) for free-eligible and reduced-price-eligible percentages estimated by the model and from the 1-year ACS by size of district.
____________
11 GVF is used to estimate the direct variance of the ACS estimates to reduce the volatility in this district-level shrinkage estimate.
12 For a given single-year estimate, ![]() for year t and area i, the RMSD is defined as
for year t and area i, the RMSD is defined as ![]()
TABLE C-1 Regression Results for 2009
| Free Eligibility | Reduced-Price Eligibility | ||||||
| Resident Population Partitions | <20k | 20-65k | 65k+ | <20k | 20-65k | 65k+ | |
| Coefficient Estimates, Z < 1.645, Z < 1.00 | |||||||
| Tax ratio | 0.74 | 0.75 | 0.39 | 0.51 | 0.50 | 0.33 | |
| Child filing ratio | -0.18 | -0.12 | -0.07 | ||||
| Lagged ACS 4-year | 0.28 | 0.31 | 0.65 | 0.01 | 0.07 | 0.33 | |
| No. of Counties | 1,321 | 1,024 | 792 | 1,321 | 1,024 | 792 | |
| Average Dependent Variable | 33.3 | 34.2 | 29.5 | 12.0 | 10.6 | 8.7 | |
| Model Error Variance | 0.9 | 0.3 | 0.0 | 0.7 | 0.2 | 0.0 | |
| R2 | 0.356 | 0.576 | 0.873 | 0.014 | 0.048 | 0.363 | |
| Standardized Residual | |||||||
| Mean | 0.00 | -0.01 | -0.02 | 0.00 | 0.00 | 0.00 | |
| Median | -0.08 | 0.01 | -0.05 | -0.26 | -0.15 | -0.08 | |
| Raw Residual | |||||||
| Mean | 0.08 | -0.16 | -0.23 | 0.00 | 0.00 | 0.00 | |
| Median | -1.16 | 0.12 | -0.19 | -2.80 | -0.96 | -0.20 | |
SOURCE: Provided to the panel May 12, 2011, by the U.S. Census Bureau.
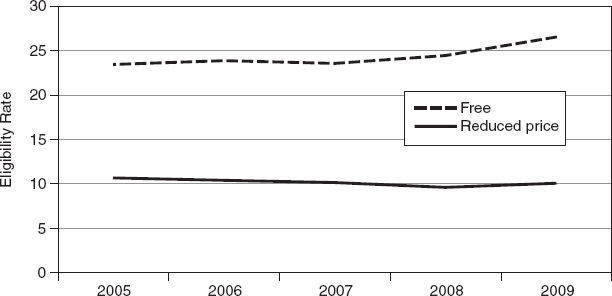
FIGURE C-1 Median free and reduced-price eligibility rates estimated by the models over time.
SOURCE: Provided to the panel May 12, 2011, by the U.S. Census Bureau.
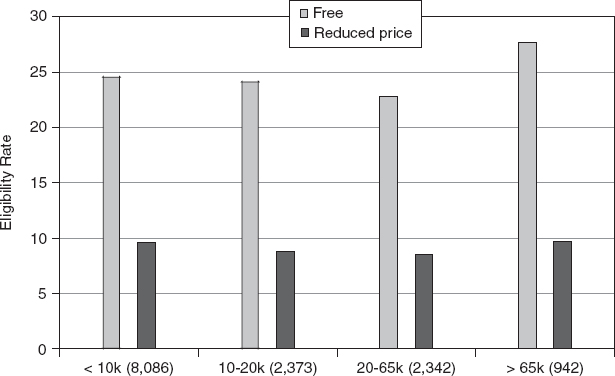
FIGURE C-2 Average 5-year ACS eligibility rates for free and reduced-price meals by size of school district.
SOURCE: Provided to the panel May 12, 2011, by the U.S. Census Bureau.
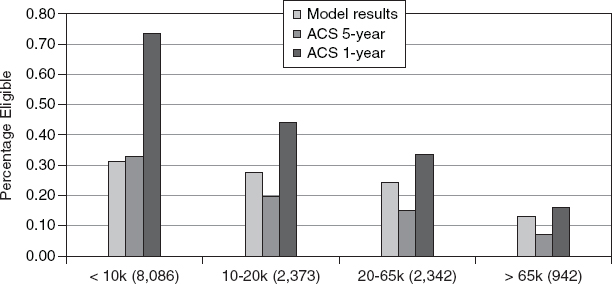
FIGURE C-3 Median of relative standard errors for percentages eligible for free meals estimated by the model and from the 5-year and 1-year ACS by size of school district.
SOURCE: Provided to the panel May 12, 2011, by the U.S. Census Bureau.
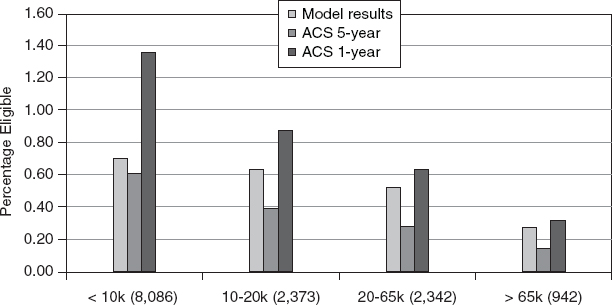
FIGURE C-4 Median of relative standard errors for percentages eligible for reduced-price meals estimated by the model and from the 5-year and 1-year ACS by size of school district.
SOURCE: Provided to the panel May 12, 2011, by the U.S. Census Bureau.
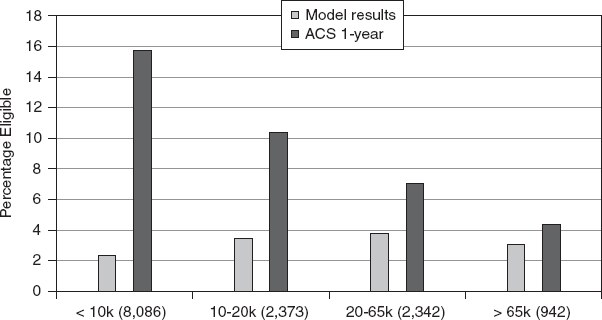
FIGURE C-5 Median of root mean squared differences (RMSDs) for free-eligible percentages estimated by the model and from the 1-year ACS by size of school district.
SOURCE: Provided to the panel May 12, 2011, by the U.S. Census Bureau.
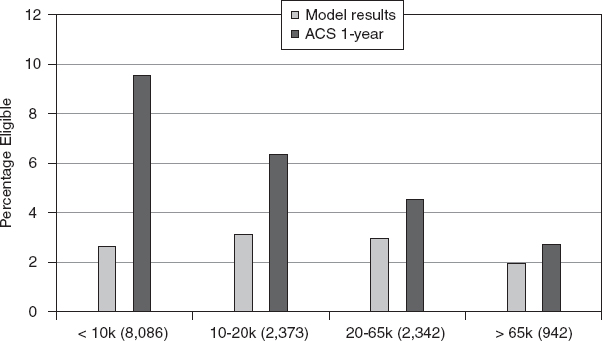
FIGURE C-6 Median of root mean squared differences (RMSDs) for reduced-price-eligible percentages estimated by the model and from the 1-year ACS by size of school district.
SOURCE: Provided to the panel May 12, 2011, by the U.S. Census Bureau.
Table C-2 shows the distribution of estimates, relative standard errors for 2009, and the RMSDs for free and for reduced-price eligibility rates estimated by the model and from the 1-year ACS.
Additional Analysis and Diagnostics
Figures C-7 and C-8 display data for free eligibility percentages, while Figures C-9 and C-10 display data for reduced-price eligibility percentages.13Figures C-7 and C-9 display relative standard errors for model-based estimates and 1-year and 5-year ACS estimates. Figures C-8 and C-10 display the medians of the RMSDs for the model-based and 1-year ACS estimates.
School Attendance Area Estimates
The methodology for school attendance areas is the same as that for school districts:
• The parameters ![]() and variance
and variance ![]() are estimates from the county model.
are estimates from the county model.
• The prediction for a school attendance area is the empirical Bayes shrinkage estimate using:
— the fitted value xs![]() , where xs is the vector of independent variables for school attendance area s computed using the synthetic estimation method described for school districts;
, where xs is the vector of independent variables for school attendance area s computed using the synthetic estimation method described for school districts;
— ys, the ACS direct estimate for school attendance areas;
— vs, the variance of ys, calculated using the same GVF as described for the county and district methodology; and
— the shrinkage estimation methodology described for school districts.
• The school attendance areas are overlapping with respect to both geography and grade ranges,14 so it was impractical to construct a primitive and rake to school district estimates.
The Census Bureau provided the following observations about the choice of prediction methods for school districts and school attendance areas for this study, relative to the shares methodology used for current SAIPE school district production:
____________
13 Figures in this section cover only those districts with combined free and reduced-price eligibility rates over 70 percent, as measured by 5-year average empirical Bayes rate modeled estimates.
14 For example, in many places there are elementary, middle, and secondary schools that serve the same geographic area.
| Variable | N | Min. | 1st Pctl. | 5th Pctl. | 25th Pctl. | 50th Pctl. | 75th Pctl. | 95th Pctl. | 99th Pctl. | Max. |
| Free | ||||||||||
| Model Est., 2009 | 13,753 | 0.2 | 2.3 | 5.8 | 16.2 | 26.5 | 37.7 | 54.4 | 65.9 | 95.6 |
| Model Rel. SE, 2009 | 13,753 | 0.02 | 0.1 | 0.1 | 0.2 | 0.3 | 0.5 | 1.2 | 3.2 | 33.5 |
| Model RMSD, 05-09 | 13,753 | 0.03 | 0.5 | 0.9 | 1.8 | 2.8 | 4.1 | 6.6 | 9.5 | 24.6 |
| ACS Est., 2009 | 13,347 | 0 | 0 | 0 | 9.5 | 25.3 | 44.0 | 75.7 | 100 | 100 |
| ACS Rel. SE, 2009 | 13,753 | 0.02 | 0.1 | 0.2 | 0.4 | 0.6 | 1.0 | 2.5 | 6.2 | 123.4 |
| ACS RMSD, 05-09 | 13,687 | 0 | 0 | 2.3 | 6.7 | 11.5 | 18.6 | 33.3 | 43.3 | 50 |
| Reduced Price | ||||||||||
| Model Est., 2009 | 13,753 | 0.4 | 1.9 | 3.4 | 6.7 | 9.5 | 12.9 | 19.3 | 25.1 | 55.1 |
| Model Rel. SE, 2009 | 13,753 | 0 | 0.2 | 0.3 | 0.4 | 0.6 | 0.9 | 1.6 | 2.3 | 5.1 |
| Model RMSD, 05-09 | 13,753 | 0.1 | 0.4 | 0.7 | 1.8 | 2.7 | 3.9 | 6.2 | 8.5 | 26.7 |
| ACS Est., 2009 | 13,347 | 0 | 0 | 0 | 0 | 6.0 | 13.8 | 36.5 | 68.3 | 100 |
| ACS Rel. SE, 2009 | 13,347 | 0.1 | 0.2 | 0.3 | 0.6 | 1.1 | 1.6 | 2.7 | 3.8 | 14.4 |
| ACS RMSD, 05-09 | 13,687 | 0 | 0 | 0 | 3.7 | 6.8 | 11.9 | 24.9 | 40.9 | 50 |
| Free + Reduced Price | ||||||||||
| Model Est., 2009 | 13,753 | 1.4 | 5.4 | 10.9 | 25.2 | 37.6 | 49.9 | 67.0 | 79.1 | 99.5 |
NOTE: ACS = American Community Survey; RMSD = root mean squared difference; SE = standard error.
SOURCE: Provided to the panel May 12, 2011, by the U.S. Census Bureau.
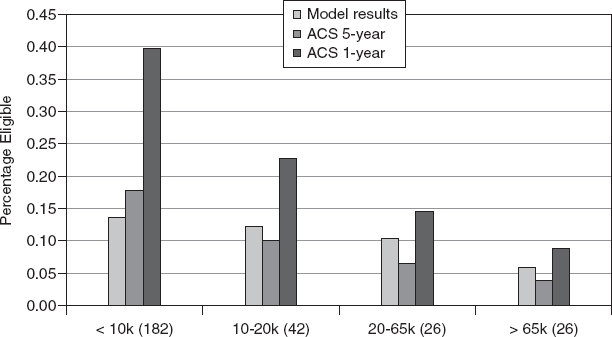
FIGURE C-7 Median of relative standard errors for model-based and 1-year and 5-year ACS-based free eligibility percentages by size of school district.
SOURCE: Provided to the panel May 12, 2011, by the U.S. Census Bureau.
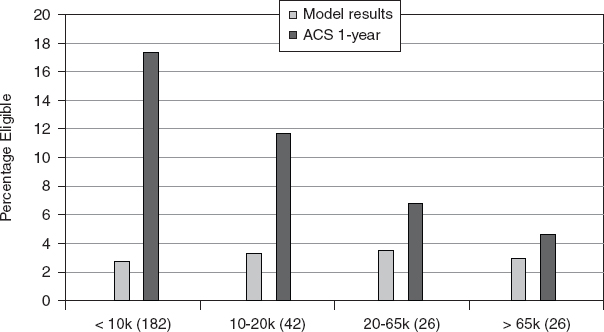
FIGURE C-8 Median of root mean squared differences (RMSDs) for model-based and 1-year ACS-based free eligibility percentages by size of school district.
SOURCE: Provided to the panel May 12, 2011, by the U.S. Census Bureau.
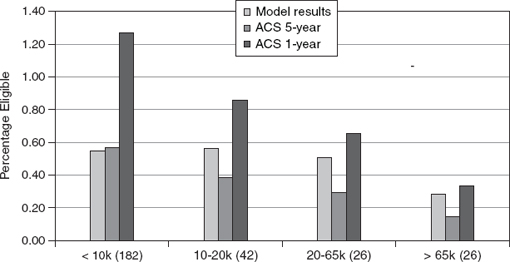
FIGURE C-9 Median of relative standard errors for model-based and 1-year and 5-year ACS-based reduced-price eligibility percentages by size of school district.
SOURCE: Provided to the panel May 12, 2011, by the U.S. Census Bureau.
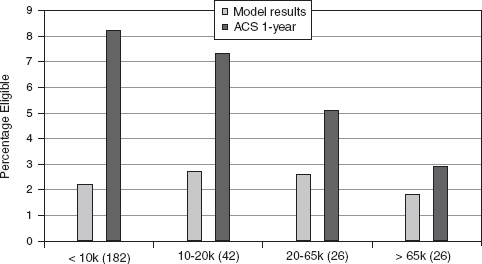
FIGURE C-10 Median of root mean squared differences (RMSDs) for modelbased and 1-year ACS-based reduced-price eligibility percentages by size of school district.
SOURCE: Provided to the panel May 12, 2011, by the U.S. Census Bureau.
• The Census Bureau could not use the SAIPE relative error methodology to evaluate the estimation error of the eligibility rates for the school meals programs because it requires an independent source of poverty estimates.
• The SAIPE model uses shares from the 2000 decennial census long form as an independent variable. These shares are now 10 years old. The Census Bureau has not evaluated the use of shares from the 5-year ACS but suspects that they are less reliable. The models for the school meals programs do not use the decennial census data as an independent variable.
• The SAIPE shares methodology for the 2008 estimates did not use the direct ACS current-year estimate, so there would be a potential loss of information over the school meals model.
• The shares methodology is a two-step process, adding estimation error at each step.
PANEL’S SUGGESTIONS FOR MODELING ELIGIBILITY PERCENTAGES FOR THE SCHOOL MEALS PROGRAMS
As noted previously, the models for the school meals programs were developed quickly as a proof of the concept that using SAIPE-like small-area models for the school meals programs might provide accurate and timely estimates of eligibility. The panel considers that the work done to date demonstrates the feasibility of such an approach. While the model-based eligibility estimates for the school meals programs are timely, they did not prove to be as accurate as the 5-year ACS direct estimates. Accordingly, the panel believes that this promising approach would benefit from further research, particularly if the ACS Eligibility Option (AEO) is adopted.
Among general topics that might warrant research are (1) variations in the synthetic method used to determine school district or school attendance area estimates, (2) consideration of transformations of the variables entering model equations to improve modeling of county data, and (3) variations on the use of partitioning of county data to improve performance at the school district and school attendance area levels. The following are the panel’s specific suggestions concerning approaches for improving the models:
- While the school meals programs are not “fixed-pie” fund allocation programs, controlling estimates to higher levels of geography should give the estimates greater precision and lower bias, while also improving face validity.
- Joint modeling of free and reduced-price percentages might improve the estimates. Because the two percentages are correlated (in both cases), joint modeling should improve efficiency.
- More generally, cross-sectional and time-series models using several years of ACS data could be specified and estimated to improve efficiency. See, for example, Datta, Lahiri, and Lu (1999). This approach would be preferable to using the average of four 1-year estimates as a predictor variable.
- While assuming that estimated eligibility percentages follow nor-mal distributions may be reasonable in some instances, it is not a good assumption for small samples (as for the school attendance areas in a small or medium-sized district) or for small percentages (such as reduced-price percentages) with skewed distributions or many estimates of 0. Better approaches include transformation of the percentage, assuming a discrete distribution, using a mixed distribution, or using a linking distribution defined in [0,1], such as the logistic or beta.
- Variance estimation might be improved. For variances of direct estimates, the approach to GVF modeling should be compared to approaches in the literature. For estimating model variances, generalized maximum likelihood estimation methods have been developed that are consistent and strictly positive (in contrast to variance components methods). Another possibility is to use hierarchical Bayes or some simple approximations, such as the adjustment for density maximization method described in Morris and Tang (2011).
- Exchangeability assumptions on regression coefficients and model variances could be relaxed by introducing heterogeneity using different regression coefficients and model variances for different groups based, for example, on administrative estimates of the percentage of students eligible for free or reduced-price meals, as well as the size of the resident population.


