
Chapter 4 describes the major causes of systematic differences between ACS estimates for percentages eligible for free, reduced-price, and full-price school meals and the data from administrative sources. This appendix provides additional background information about some of those causes, including
- underreporting of Supplemental Nutrition Assistance Program (SNAP, formerly Food Stamp Program) benefits;
- determining eligibility using annual rather than monthly income;
- school choice opportunities;
- imputation for nonresponse; and
- certification errors.
Each of these causes is discussed in turn below.
UNDERREPORTING OF SNAP BENEFITS
As discussed in Chapter 4 and Appendix B, considerable research through the years has documented underreporting of benefits such as SNAP in household surveys. The panel conducted its own evaluation by comparing ACS estimates of SNAP reporting by households with school aged children to estimates from administrative data. The panel received a file from Mathematica Policy Research comparing counts and eligibility percentages for 2009 from two different data sources: the 2009 ACS
Public Use Microdata Sample (PUMS) files and the 2009 SNAP Quality Control file (SNAP QC). The data support an investigation of the potential undercount of SNAP participation in student households by the ACS at the national and state levels.
The SNAP QC data are sample-based administrative data that are representative at the state level and contain detailed demographic, economic, and SNAP eligibility information for an annual sample of more than 45,000 SNAP households. The data are weighted to match administrative counts of individuals and households receiving benefits and the amount of benefits received (adjusted to remove ineligible households that received benefits in error and those receiving disaster assistance benefits). The SNAP QC data represent all SNAP participants regardless of where they live (so noninstitutionalized group quarter residents are included).1
The SNAP QC data do not include all individuals in households where someone receives SNAP benefits. The data include individuals in the SNAP filing unit (those covered by SNAP), and only those individuals outside the filing unit (but in the household) whose income or assets would be counted in determining eligibility and benefits. The tables below include individuals in the filing unit as well as any other individuals in the household that are included in the SNAP QC data. There are about 1.85 children per SNAP household in the SNAP QC data.
In the ACS, SNAP participation is a household question, but it is also asked of group quarter respondents. We counted a household as having SNAP benefits if the household question was answered in the affirmative. We counted everyone living in that household as receiving SNAP benefits. According to the ACS, there were 1.89 children in each SNAP household in 2009, compared with 1.85 children per SNAP household in the SNAP QC data. Differences in household sizes across the two data sets are discussed below. On the ACS, the group quarter respondents who reported SNAP participation were split approximately evenly between institutional and noninstitutional group quarters; only those in noninstitutional group quarters are included in the tables below.
There is an additional difference in the way eligibility is determined in the two data sets. In SNAP QC, eligibility is based on income and filing unit as reported on an application (and determined to be accurate). The SNAP QC file has monthly income,2 and eligibility is based on a
____________
1 There is no way to identify group quarter individuals in the SNAP QC data.
2 The panel’s Food and Nutrition Service (FNS) contacts told us that applications for school meals generally report monthly or more frequent income (e.g., weekly or biweekly). The same is likely to be true of SNAP applications. It is more convenient to recode income to a common monthly value in a data set such as SNAP QC.
comparison with the income eligibility guidelines. The SNAP QC-based eligibility is from applications made in fiscal year 2009, so the data reflect the participant’s situation in that year.
For the ACS data, eligibility is based on “povpip.”3 Povpip is based on annual income as reported on a survey form completed during 2009, adjusted to represent income data in 2009 and compared with the 2009 poverty guidelines. A survey completed in January 2009 would reflect data on income received mainly during 2008 (representing income from the same day in January 2008 through the survey day in January 2009).4 A survey completed in December 2009 would reflect income from the survey date in December 2008 through the survey date in December 2009. Thus there is about a half-year lag in the ACS income data relative to the SNAP QC income data.5 Additionally, as discussed later in this appendix, if monthly income is variable, using annual income smooths over periods of high and low income and may understate income eligibility for the school meals programs.
Similarly, the ACS question on SNAP participation asks whether anyone in the household received food stamp benefits during the last 12 months. Individuals in a household that received SNAP benefits in 2008 could still have been eligible in 2009. However, it is also possible that their situation changed and that they were no longer eligible in 2009. Under the school meals programs, if a household is determined to be eligible for school meals because of SNAP participation or income, a student in that household remains eligible for school meals for the rest of the school year and for 1 month into the next.
The tables provided to the panel compared ACS and SNAP QC estimates of number of households with SNAP benefits, number of households with SNAP benefits with children aged 5-17, number of individuals with SNAP benefits, and number of individuals aged 5-17 with SNAP benefits.
____________
3 Povpip is the ratio of income to the poverty threshold computed by the Census Bureau and made available in its data products. For family members, it is the ratio of family income to the appropriate poverty threshold. For unrelated individuals, it is personal income compared with the one-person poverty threshold. It is not defined for unrelated individuals under age 15 because income data are not collected for these individuals. It is not defined for some GQ individuals. If povpip is not defined, the person is classified as eligible for free meals.
4 Instructions state that the respondent is to report his or her income during the last 12 months and explains that this means “from today’s date one year ago through today.” However, it would be surprising if people know their income by such specific time periods.
5 ACS income are adjusted using the Consumer Price Index to reflect calendar year 2009 dollars.
Comparison of ACS and SNAP QC
Table G-1 shows national-level counts of households (all and those with children aged 5-17) and individuals (all and those aged 5-17) receiving SNAP benefits in 2009, based on the ACS versus SNAP QC. The table presents the difference between the estimates from the two data sources, the difference expressed as a percentage of the ACS count, the standard error of the difference, and a z-statistic for testing whether the difference is statistically significant. The hypothesis that the ACS and SNAP QC estimates are the same is rejected at the 5 percent significance level if z is greater than 1.96 in absolute value. All differences are statistically significant. The ACS overstates individuals receiving SNAP benefits,6 while it understates households, households with children aged 5-17, and individuals aged 5-17 receiving SNAP benefits.
Table G-2 shows counts by state for our population of interest: children aged 5-17 in households receiving SNAP benefits in 2009. At the national level, the difference between the ACS and SNAP QC counts is statistically significant at the 5 percent level. ACS undercounts this population by 4.4 percent. For California, Delaware, New Mexico, and Tennessee, the difference between the ACS and SNAP QC estimates is significant at the .001 level, indicating undercounts by the ACS of 14.5 percent, 32.8 percent, 24.7 percent, and 14.6 percent, respectively. 7 In other states the differences are not statistically significant. These results demonstrate the variability among states in the tendency to underreport SNAP benefits.
DETERMINING ELIGIBILITY USING ANNUAL VERSUS MONTHLY INCOME
This section addresses the potential differences in eligibility percentages due to computing eligibility for school meals based on annual income, the only option available for the ACS, and computing eligibility based on monthly income, as is done in the school meals programs. The panel based its evaluation on the 2004 SIPP, a national panel survey that collects monthly income data.
____________
6 The overstatement of individuals on SNAP by ACS may be due to the fact that receipt of SNAP is a household question and all members of the household are assumed to be on SNAP.
7 The .001 significance level for each state-level test assures that the chance of rejecting the hypothesis of no difference when 51 state-level tests are conducted simultaneously has an overall significance level of .05. The Sidak multiple comparison correction selects alpha per comparison = 1 – (1-alpha*)^(1/n), where alpha* is the desired overall significance level and n is the number of comparisons. If alpha* = .05, then .95^(1/51) = .999, so alpha per comparison should be .001; the critical value for a z-statistic with alpha = .001 is 3.
| ACS (thousands) | SNAP QC (thousands) | ACS– SNAP QC (Diff.) | Diff. as % of ACS |
SE Diff. | z Diff. | |
| Households | 11,718 | 14,981 | –3,263 | –27.8% | 37 | –88.2 |
| Households with | 5,279 | 5,658 | –379 | –7.2% | 48 | –8.0 |
| Children Aged 5-17 | ||||||
| Individuals | 39,590 | 35,073 | 4,517 | 11.4% | 190 | 23.8 |
| Individuals Aged 5-17 | 10,041 | 10,486 | –446 | –4.4% | 95 | –4.7 |
NOTES: ACS = American Community Survey; SE = standard error; SNAP = Supplemental Nutrition Assistance Program (formerly Food Stamp Program); SNAP QC = SNAP Quality Control Data File.
SOURCE: Prepared by the panel using 2009 ACS and FY 2009 SNAP QC estimates provided by Mathematica Policy Research, September 2011.
Survey of Income and Program Participation (SIPP)8
SIPP is a continuing program of the Census Bureau, which began interviewing for the survey in late 1983 and is planning to introduce a major redesign in 2013. Under the survey’s current design, members of sampled households (panels) are interviewed every 4 months for 3 or 4 years. Hence, SIPP not only provides detailed annual and monthly information on income by source for a representative sample of U.S. households but also tracks changes in program eligibility and participation for the household members as their incomes and other circumstances change. SIPP asks about participation of household members in SNAP, the National School Lunch Program (NSLP), the School Breakfast Program (SBP), Temporary Assistance for Needy Families (TANF), and other programs for low-income persons. In addition, it collects data on taxes, assets, liabilities, labor force participation, general demographic characteristics, and many special topics related to families’ economic circumstances.
The survey design is a series of national panels, each representing the U.S. civilian noninstitutionalized population. Over the years, panels have varied in sample size, number of interview waves, and other features. For the 1984-1993 period, a new panel of households was introduced each February. Subsequent panels have not overlapped; they include a 4-year panel beginning in 1996, a 3-year panel beginning in 2001, a
____________
8 This section draws heavily on the discussion of SIPP in Chapter 3 of the panel’s interim report (National Research Council, 2010).
| Total Individuals | ACS-SNAP QC (Difference) (thousands) | Difference as % of ACS | |||
| State | ACS (thousands) | SNAP QC (thousands) | z | ||
| Total | 10,041 | 10,486 | –446 | –4.4 | –4.7 |
| Alabama | 204 | 227 | –23 | –11.1 | –2.5 |
| Alaska | 20 | 20 | 1 | 3.1 | 0.3 |
| Arizona | 277 | 276 | 2 | 0.6 | 0.1 |
| Arkansas | 121 | 119 | 2 | 1.7 | 0.4 |
| California | 1,011 | 1,160 | –148 | –14.6 | –4.3 |
| Colorado | 111 | 107 | 5 | 4.1 | 0.7 |
| Connecticut | 71 | 67 | 4 | 5.0 | 0.8 |
| Delaware | 23 | 31 | –8 | –32.8 | –3.1 |
| District of Columbia | 26 | 27 | 0 | –0.7 | –0.1 |
| Florida | 540 | 550 | –11 | –2.0 | –0.5 |
| Georgia | 356 | 405 | –48 | –13.6 | –3.0 |
| Hawaii | 26 | 30 | –4 | –14.9 | –1.5 |
| Idaho | 47 | 46 | 1 | 2.4 | 0.3 |
| Illinois | 435 | 455 | –19 | –4.4 | –1.1 |
| Indiana | 214 | 210 | 4 | 1.9 | 0.4 |
| Iowa | 83 | 85 | –2 | –2.2 | –0.3 |
| Kansas | 73 | 64 | 9 | 12.1 | 1.6 |
| Kentucky | 190 | 204 | –14 | –7.2 | –1.5 |
| Louisiana | 234 | 225 | 9 | 3.8 | 1.0 |
| Maine | 47 | 52 | –5 | –9.5 | –0.9 |
| Maryland | 129 | 135 | –6 | –4.6 | –0.9 |
| Massachusetts | 160 | 170 | –10 | –6.5 | –1.4 |
| Michigan | 440 | 394 | 46 | 10.4 | 2.7 |
| Minnesota | 100 | 99 | 0 | 0.5 | 0.1 |
| Mississippi | 150 | 159 | –9 | –6.2 | –1.4 |
| Missouri | 211 | 229 | –17 | –8.0 | –1.7 |
| Montana | 31 | 25 | 6 | 19.1 | 1.6 |
| Nebraska | 48 | 42 | 5 | 11.2 | 1.5 |
| Nevada | 62 | 60 | 2 | 3.0 | 0.5 |
| New Hampshire | 22 | 20 | 2 | 8.5 | 0.6 |
| New Jersey | 142 | 152 | –9 | –6.6 | –1.2 |
| New Mexico | 82 | 103 | –20 | –24.7 | –3.7 |
| New York | 617 | 637 | –20 | –3.3 | –0.7 |
| North Carolina | 328 | 364 | –36 | –11.0 | –2.4 |
| North Dakota | 10 | 13 | –3 | –33.0 | –1.8 |
| Ohio | 420 | 387 | 32 | 7.7 | 2.2 |
| Oklahoma | 136 | 142 | –6 | –4.4 | –0.8 |
| Oregon | 162 | 151 | 10 | 6.2 | 1.1 |
| Pennsylvania | 372 | 384 | –12 | –3.2 | –0.8 |
| Rhode Island | 31 | 29 | 2 | 6.0 | 0.8 |
| Total Individuals | ACS-SNAP QC (Difference) (thousands) | Difference as % of ACS | |||
| State | ACS (thousands) | SNAP QC (thousands) | z | ||
| South Carolina | 180 | 201 | –21 | –11.5 | –2.5 |
| South Dakota | 25 | 22 | 3 | 11.0 | 0.9 |
| Tennessee | 276 | 317 | –40 | –14.6 | –3.2 |
| Texas | 1,071 | 1,129 | –58 | –5.4 | –1.8 |
| Utah | 66 | 63 | 3 | 3.9 | 0.5 |
| Vermont | 14 | 18 | –4 | –29.4 | –1.9 |
| Virginia | 179 | 188 | –8 | –4.6 | –0.9 |
| Washington | 219 | 215 | 5 | 2.1 | 0.4 |
| West Virginia | 70 | 81 | –12 | –16.7 | –2.4 |
| Wisconsin | 171 | 174 | –3 | –1.8 | –0.4 |
| Wyoming | 7 | 7 | 0 | –3.6 | –0.2 |
NOTES:
• The ACS-based estimates are of all individuals (aged 5-17) living in households reporting receipt of SNAP benefts and include those living in noninstitutional group quarters. Estimates use person-level weights.
• The SNAP QC-based administrative estimates are of all individuals (aged 5-17) who are members of SNAP fling units. SNAP fling units refer to individuals who together are certifed for and receive SNAP benefts. The estimates of individuals also include those who were living with SNAP participants but who were not receiving SNAP benefts if their income and assets were considered in determining the SNAP fling unit’s eligibility and benefts.
• The ACS-based poverty levels are based on the povpip variable, which measures the poverty status of the family relative to the census poverty thresholds. The SNAP QC-based poverty levels are based on the tpov variable, which measures the poverty status of the SNAP unit relative to the SNAP poverty guidelines.
• The standard error (SE) for SNAP QC in Wyoming was noted only as less than 500. It was entered at .25 to support computation of the z-statistic.
• The z-statistic is the ACS estimate minus SNAP QC estimate divided by the SE of the difference. A test of the hypothesis that the difference between the ACS and SNAP QC estimates is zero is rejected if z is greater than 3 in absolute value.
• For any individual state, this is at the .1 percent signifcance level. For testing of all 52 states at the same time, it is at the 5 percent signifcance level.
• No persons in institutional group quarters are represented in the table.
• ACS = American Community Survey; SE = standard error; SNAP = Supplemental Nutrition Assistance Program (formerly Food Stamp Program); SNAP QC = SNAP Quality Control Data File.
SOURCES: Prepared by the panel using 2009 ACS and FY 2009 SNAP QC estimates provided by Mathematica Policy Research, September 2011.
4-year panel beginning in 2004, and a 4-year panel beginning in 2008. A new, redesigned panel of about the same size as the 2008 panel—45,000 households—is to be introduced in 2013 and followed for 3 or 4 years.
The current SIPP content is built around a “core” of labor force, program participation, and income questions that are repeated at each wave of interviewing, with supplemental topical modules on particular topics being asked one or more times per panel. The survey collects data for each month of a 4-month recall period, with approximately the same number of interviews being conducted in each month of the 4-month period for each wave. Interviews are conducted by personal visit for the first two interview waves and by telephone thereafter, using a computerassisted interview on a laptop computer. As discussed in Bates and Okon (2003), the 2004 SIPP panel instituted a variety of enhancements to better capture income reporting, including dependent interviewing techniques. The new methods allowed respondent-selected defined periods for reporting job earnings: monthly, biweekly/bimonthly, annually, or hourly. The goal was to make retrieval and reporting more natural and consistent with how respondents typically think about their earnings. In cases where an amount other than monthly was selected, the computer program for the survey internally calculated a gross monthly amount based on pay dates, pay periods, hours worked, paycheck totals, and so on, and performed a variety of checks based on comparisons with answers to past questions, asking respondent to confirm estimated values when there appeared to be potential errors. There are many probes to make sure the respondent has reported all relevant income items for each month. Further the income questions are asked after dates of employment are established, and income then is reported for each spell of employment.
As noted by Moore (2007), “panel surveys generally suffer to some extent from seam bias, the tendency for estimates of change measured across the ‘seam’ between two successive survey administrations to far exceed change estimates measured within a single interview.” The changes in survey methodology that were implemented in the 2004 SIPP were intended to reduce seam bias. Moore compared indications of seam bias in SIPP 2001 with those from the first waves of SIPP 2004 to evaluate the impact of changes to survey methodology in 2004. He reported substantial reductions in seam bias from 2001 to 2004 that are attributable to the new survey methods. 9 “However, notwithstanding the clear improvements, seam bias still afflicts SIPP 2004 panel data….”
____________
9 Seam bias generally refers to how a respondent reports a change in status. For example, a respondent who becomes unemployed during a 4-month period is more likely to report that event as occurring during the month of the interview than in the month he became unemployed. Moore (2007) evaluates variables related to change in status. A similar mechaindinism
Data are currently released in cross-sectional core and topical module files for each interview wave. As of mid-2011, core files were available through wave 2 of the 2008 panel; topical module files were available through wave 8 of the 2004 panel.10
The planned redesign of SIPP will change the interviewing cycle from every 4 months to once a year. Each annual interview will include the core question content on income, employment, program participation, and demographic characteristics using an event history calendar to facilitate recollection of monthly information for the previous year. Some content previously in topical modules will be included, and government agencies may pay for special supplements.
Deriving Estimates from the 2004 SIPP Data
The panel calculated percentage eligible for free and for reduced-price meals using the economic units and guidelines described in Appendix B that mirror the special tabulations the panel requested from the Census Bureau. However, in addition to computations based on annual income, we derived estimates based on monthly income under the assumption that eligibility status lasts for a school year. Both estimates were computed with and without accounting for categorical eligibility because of SNAP, TANF, and foster children.
Preparing the Data
The following steps were followed in preparing the SIPP database:
1. Merge people across all waves in the 2004 SIPP. SIPP includes monthly income data from October 2003 through December 2007, although not all data are based on four rotation groups and the full original sample size. (The sample size was reduced by 50 percent beginning with wave 9 in October 2006.11) Keep indi-
____________
may result in a respondent reporting an average value or the value for the most recent month for all 4 months of a wave rather than the exact values for each individual month. This type of misreporting should also have been reduced as a result of the methodology enhancements implemented in the 2004 SIPP. The panel, however, is not aware of empirical evidence of this. Pischke (1995) modeled the measurement error in monthly income data in the 1984 SIPP and found that changes in income tended to be reported in the month of the interview.
10 See http://www.sipp.census.gov/sipp_ftp.html#sipp.
11 The 2004 SIPP panel underwent a 50 percent sample reduction in wave 9. This occurred during the last wave of interviews in 2006, beginning in October. The first interviews with the smaller sample size collected income information for June through September 2006. Hence, only the data from January 2004 through May 2006 are based on a full set of rotation
viduals in the database if there are data for them for all months of 2004-2005 and most of 2006, so that past year’s annual income would be available for each month of 2005 and most of 2006 to match the time pattern of income reported in the ACS for a given calendar year.
2. Keep only households with children aged 5 and up to 15, or aged 15 to 19 (inclusive) enrolled in school but not graduated from high school.12
3. Identify foster children and keep them separate from the household in which they reside. They are categorically eligible for free school meals and will be added back into the tabulations later. For each household, create counts of the number of persons in the household (excluding any foster children) and household income (excluding foster child income).
4. Construct economic unit measures EU1-EU5 (see Appendix B) for each household, counting number of persons and summing total personal income for the relevant units. Note that foster children are excluded from these economic unit definitions (and are added in as being categorically eligible for free meals at a later step).
5. Identify the school year associated with the month of the data (for example, income data representing July 2004 through June 2005 would be associated with school year 2004-2005). Assume the guidelines change in July as is typical.
6. For the monthly income measure, use SIPP income reported for that month. Use the guideline associated with the relevant school year. Compute the ratio of monthly income to the guidelines. Also track eligibility throughout the school year, assuming the school year spans September through June and treating July and August as part of the previous school year. Thus children who are income-eligible for free meals during any month of the school year will be eligible for free meals for all subsequent months of the school year. More generally, eligibility established in any month in a school year ensures continued eligibility for the remainder of the school year at that level even if income increases. Note that since the ACS samples are independent across months of the year, one can obtain the right total number of children for a calendar year
groups. For June 2006, the data are based on three full rotation groups and one reduced-size group. This covers almost two school years: 2004/2005 and 2005/2006, if a school year runs from July of one year to June of the following year. Note that the data set includes these partial panel participants, but the tabulations include information only for those in the data for the relevant calendar year and the preceding calendar year.
12 12 In the SIPP, we do not know whether children are in private or public school and know enrollment only for those aged 15-19.
only by including the children from July and August. Keep current monthly eligibility, as well as cumulative monthly eligibility.
7. For the annual income measures, create the previous 12 months’ income as the sum of income over those months, and also compute an “inflation”-adjusted income for the previous 12 months to mimic the fact that the ACS adjusts income for inflation to reflect real dollars as of July of the relevant calendar year. (Inflation adjustment factors come from the ACS subject definitions.)13,14
8. For each month, for each child in the sample, create indicators for the ratio of economic unit income to the guidelines to reflect eligibility for free, reduced-price, or full-price meals using (1) the ACS adjusted annual income and school year guidelines for second half of calendar year and (2) SIPP monthly income and school year guidelines. Recall that this is income eligibility only, excluding foster children and others categorically eligible but not income-eligible.
9. Construct indicators for uptake of free, reduced-price, or full-price school lunch based on the SIPP question about “usually” getting a lunch. The question is asked only of children aged 5-18. If the respondent says that some children usually get a lunch, then he or she is asked whether the children qualify for free or reduced-price meals under the NSLP.
10. Construct indicators for whether someone in the household has received SNAP benefits or public assistance (presumably mainly TANF) this month, cumulatively over the school year, and in the last calendar year. Create a separate version of the cumulative SIPP and adjusted and unadjusted ACS measures that also accounts for categorical eligibility, adding as eligible for free meals foster children or children in households with SNAP or TANF.
11. Tabulation results use longitudinal weights through 2006, and standard errors and confidence intervals use Taylor series approximations with the Primary Sampling Unit and strata information in the public use files.
____________
13 Inflation adjustment factors are the average for the previous calendar year (thus for July 2004, they are the average for July 2003-June 2004). For 2004, they range from 1.90615 to 1.95206. They then need to be translated to dollars for the relevant calendar year. Since the factors are used to inflate 1982 dollars to the current year, they must be multiplied by the average Consumer Price Index Research Series Using Current Methods (CPI-U-RS) for the relevant calendar year and divided by the Current Population Survey Research Series Using Current Methods (CPSU-RS) for 1982 to yield current dollars. For years 2004-2006, they range from close to 1 (in 2006) to around 1.04 (in 2004).
14 For 2004, for example, they appear at the following link: http://www.census.gov/acs/www/Downloads/data_documentation/SubjectDefinitions/2004_ACSSubjectDefinitions.pdf.
12. Use the above variables to produce for each month three individual dummy variables for children aged 5-14 or 15 and older, enrolled in school currently, and not a high school graduate, corresponding to each of the economic units. The dummies are 1 if the relevant economic unit income is less than or equal to 130 percent of the guideline, more than 130 percent of the guideline but less than or equal to 185 percent, and more than 185 percent, and are zero otherwise. Foster children are not counted as economic unit members for the rest of that economic unit’s calculation. Then, to capture the cumulative nature of the current eligibility process, if a child is eligible for free meals in a given month, free eligibility is carried forward within the school year, and similarly for reduced-price meals. Additional dummy variables are created to reflect both income and categorical eligibility due to receiving SNAP or TANF benefits or being a foster child. In the monthly tabulation, categorical eligibility is determined if someone in the economic unit was receiving SNAP or TANF benefits during the last month. In the annual income tabulations, categorical eligibility is determined if someone in the economic unit was receiving SNAP or TANF benefits during the last calendar year.
13. The microdata also contain child age, race, ethnicity, and gender, along with some other characteristics.
Results
The unit of observation in the tabulations is a child-month. Tabulations represent the mean share of child-months in the sample spent in free, reduced-price, or full-price status. Results are presented for calendar years 2005 and 2006 (so they include part of the 2004-2005 school year, all of 2005-2006, and part of 2006-2007). In the tabulations presented below, only EU4 is used, the economic unit specification adopted by the panel.
Table G-3 illustrates eligibility by category (free, reduced price, and full price) for income eligibility only (IE) and for income and categorical eligibility (IE + cat) based on monthly and annual income for EU4. Results are shown for 2005 and 2006. Eligibility percentages are based on the mean share of child-month eligibility by category for a variety of demographic variables. Table G-3 shows that the annual income eligibility for free meals is almost always below monthly income eligibility, with or without accounting for categorical eligibility. The differences are smaller,15 however, when we account for categorical eligibility.
____________
15 Recall that these results are likely to be conservative (the actual difference may be larger) in the presence of seam bias: for example if respondents tend to report an average of the income they earned during four months instead of actual, more variable, monthly totals.
An underlying assumption of using district and school catchment areas crosswalked to the ACS to estimate eligibility for the school meals programs is that school-age children who attend public school attend in the district and at the school indicated by their address. While this is true for most schoolchildren, such an assumption may introduce error to ACS-based eligibility estimates when students have the option to choose alternatives to their catchment area public school or district.16 If students eligible for free or reduced-price meals are underrepresented in magnet school enrollments, for example, catchment area estimates will understate the percentage of free or reduced-price-eligible students attending nonmagnet schools. Depending on the relative uptake of school choice alternatives by free or reduced-price-eligible students, catchment area estimates may misrepresent the actual percentage of such students. School districts differentially employ or are otherwise affected by various forms of public school choice, such as magnet schools, charter schools, and intra-and interdistrict open enrollment plans.17 We refer to these alternatives generically as public schools of choice.
For the purposes of assessing the effects on the ACS Eligibility Option (AEO), it is important to distinguish between intra- and interdistrict public school choice. Many districts may find the AEO appealing at the district level, in which case intradistrict choice plans will have no effect. Whether free or reduced-price-eligible students are drawn disproportionately to schools of choice (e.g., open enrollment, magnet, or district charter schools) will not affect the overall percentage of these children in the district. As a result, school choice will not pose a problem for ACS estimates. However, if students leave the district—for example, to attend an independent charter school—or are eligible for an interdistrict choice plan, and if free or reduced-price-eligible students choose these options differentially, then ACS estimates will misrepresent the percentage of free or reduced-price-eligible students attending district schools. A similar issue arises if a district is interested in employing the AEO only at some schools within the district. In this case, both intra- and interdistrict choice are potentially problematic, as the ACS estimates of the percentage of eligible children in any school based on residence may misrepresent actual attendance.
The panel used information from one of the case study districts— Omaha, data from the District of Columbia, and the Common Core of
____________
16 This discussion is limited to non-home-schooling public school alternatives because the ACS identifies two categories of students: (1) those attending public school or college and (2) those attending private school or college or being home schooled.
17 This includes a variety of alternatives, such as the option that some districts offer stu dents to choose among some or all high schools in the district (e.g., New York City) or the ability to attend out-of-district public schools.
| Group | Year | Type of Eligibility | Monthly Free (%) |
| All Students | 2005 | IE | 30 |
| All Students | 2005 | IE + cat | 33 |
| All Students | 2006 | IE | 28 |
| All Students | 2006 | IE + cat | 31 |
| Student Age | |||
| 5 to 11 | 2005 | IE | 31 |
| 5 to 11 | 2005 | IE + cat | 35 |
| 12 to 14 | 2005 | IE | 29 |
| 12 to 14 | 2005 | IE + cat | 33 |
| 14 to 18 | 2005 | IE | 26 |
| 14 to 18 | 2005 | IE + cat | 29 |
| Citizenship | |||
| Citizen | 2005 | IE | 29 |
| Citizen | 2005 | IE + cat | 32 |
| Noncitizen | 2005 | IE | 46 |
| Noncitizen | 2005 | IE + cat | 49 |
| Education of Householder | |||
| No HS degree | 2005 | IE | 63 |
| No HS degree | 2005 | IE + cat | 69 |
| HS grad. | 2005 | IE | 38 |
| HS grad. | 2005 | IE + cat | 42 |
| Some college | 2005 | IE | 26 |
| Some college | 2005 | IE + cat | 29 |
| College grad. | 2005 | IE | 13 |
| College grad. | 2005 | IE + cat | 15 |
| Metro vs. Nonmetro | |||
| Metro | 2005 | IE | 29 |
| Metro | 2005 | IE + cat | 32 |
| Nonmetro | 2005 | IE | 34 |
| Nonmetro | 2005 | IE + cat | 37 |
| Census Region | |||
| New England | 2005 | IE | 21 |
| New England | 2005 | IE + cat | 24 |
| Middle Atlantic | 2005 | IE | 28 |
| Middle Atlantic | 2005 | IE + cat | 31 |
| East North Central | 2005 | IE | 28 |
| East North Central | 2005 | IE + cat | 31 |
| West North Central | 2005 | IE | 24 |
| West North Central | 2005 | IE + cat | 27 |
| South Atlantic | 2005 | IE | 29 |
| South Atlantic | 2005 | IE + cat | 32 |
| East South Central | 2005 | IE | 38 |
| East South Central | 2005 | IE + cat | 44 |
| West South Central | 2005 | IE | 36 |
| West South Central | 2005 | IE + cat | 40 |
| Mountain | 2005 | IE | 29 |
| Mountain | 2005 | IE + cat | 32 |
| Pacific | 2005 | IE | 30 |
| Pacific | 2005 | IE + cat | 33 |
SOURCE: Prepared by the panel using the 2004 Survey of Income and Program Participation.
| Monthly Reduced Price (%) | Monthly Full Price (%) | Annual Free (%) | Annual Reduced Price (%) | Annual Full Price (%) | ||
| 12 | 58 | 21 | 13 | 66 | ||
| 11 | 56 | 28 | 10 | 63 | ||
| 13 | 59 | 20 | 14 | 66 | ||
| 12 | 58 | 27 | 11 | 63 | ||
| 13 | 56 | 23 | 13 | 64 | ||
| 11 | 54 | 30 | 10 | 60 | ||
| 12 | 59 | 22 | 12 | 66 | ||
| 10 | 57 | 27 | 9 | 63 | ||
| 12 | 62 | 18 | 12 | 70 | ||
| 10 | 61 | 24 | 9 | 67 | ||
| 12 | 59 | 21 | 12 | 67 | ||
| 10 | 57 | 27 | 9 | 63 | ||
| 19 | 35 | 36 | 21 | 44 | ||
| 18 | 34 | 41 | 18 | 41 | ||
| 16 | 21 | 54 | 19 | 27 | ||
| 12 | 18 | 65 | 13 | 22 | ||
| 16 | 47 | 28 | 17 | 55 | ||
| 13 | 45 | 37 | 13 | 51 | ||
| 14 | 60 | 18 | 13 | 69 | ||
| 13 | 58 | 24 | 10 | 66 | ||
| 7 | 80 | 7 | 6 | 87 | ||
| 6 | 79 | 10 | 5 | 85 | ||
| 12 | 60 | 21 | 12 | 67 | ||
| 10 | 58 | 27 | 9 | 64 | ||
| 14 | 52 | 25 | 14 | 61 | ||
| 12 | 51 | 32 | 10 | 58 | ||
| 10 | 69 | 16 | 8 | 76 | ||
| 8 | 68 | 21 | 6 | 73 | ||
| 12 | 61 | 21 | 11 | 68 | ||
| 10 | 59 | 27 | 9 | 64 | ||
| 12 | 60 | 21 | 12 | 67 | ||
| 11 | 59 | 27 | 8 | 64 | ||
| 11 | 65 | 17 | 10 | 73 | ||
| 10 | 64 | 22 | 8 | 70 | ||
| 13 | 57 | 22 | 13 | 65 | ||
| 12 | 56 | 27 | 10 | 63 | ||
| 12 | 50 | 29 | 13 | 58 | ||
| 9 | 47 | 40 | 8 | 52 | ||
| 15 | 49 | 26 | 16 | 58 | ||
| 12 | 48 | 33 | 12 | 55 | ||
| 12 | 58 | 19 | 15 | 66 | ||
| 11 | 57 | 25 | 11 | 63 | ||
| 12 | 58 | 20 | 13 | 67 | ||
| 10 | 57 | 26 | 10 | 63 | ||
Data to better understand the nature and extent of the problem potentially introduced by school choice. In this regard, we investigated the following research questions:
- Are various forms of school choice sufficiently popular to warrant concern?
- If so, where lies and what is the nature of the potential problem?
- Are ACS estimates potentially misleading?
Based on this analysis, the panel offers recommendations regarding the implications of the issue of school choice for the implementation of the AEO.
Potential Effects of School Choice on ACS Estimates
To explore the potential effects of school choice on estimates of free or reduced-price-eligible students, the panel assembled data from two school districts with differing forms of public school choice that allowed us to compare estimates of the percentage of free or reduced-price-eligible students based on statistics reflecting catchment area residence with the percentage of free or reduced-price-eligible students who actually enroll in schools following choice decisions. We examined the case of inter-district school choice in Washington, DC, followed by a within-district open enrollment plan in Omaha, Nebraska. For the District of Columbia, we received aggregate school data from Umut Ozek, a researcher at the Center for Analysis of Longitudinal Data in Education Research at the American Institutes of Research that allowed us to construct the analysis described below. The analysis for Omaha is based on data provided to the panel by the Omaha school district.
In 2008, Washington, DC, had 60 independent charter schools, schools that were not part of the District of Columbia Public School (DCPS) District, which has 140 schools. Thirty-six percent of all public school students residing in the District of Columbia attended a charter school that was not part of DCPS. This, then, is a case in which estimating free or reduced-price-eligible students with the ACS may be misleading at both the district and school levels. For each DCPS school, Figure G-1 shows the percentage of students eligible for free or reduced-price meals based on the school’s catchment area versus the school’s enrolled students. If the catchment area percentage of eligible students equals the percentage of eligible students who are actually enrolled, that school will lie along the 45° diagonal. Most schools deviate from the 45° diagonal, indicating that catchment area estimates will both over- and underrepresent eligiblity percentages based on enrolled students. A simple unweighted mean dif-
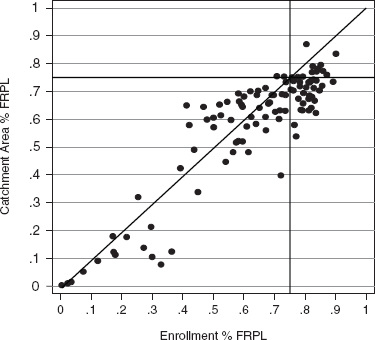
FIGURE G-1 Out-of-district public enrollment, Washington, DC, public schools, 2008: School catchment-based and enrollment-based free or reduced-price-eligible percentages.
NOTE: FRPL = free or reduced-price lunch.
SOURCE: Prepared by the panel from summary data provided by Umut Ozek, CALDER, American Institutes of Research.
ference between schools’ catchment area percentage of free or reduced-price lunch eligibility and the free or reduced-price eligibility percentage based on enrolled students indicates that catchment area eligibility rates understated the enrollment-based eligibility rates by 6.5 percentage points in 2008. This finding is consistent with a situation in which free or reduced-price-eligible students are less likely to opt for charter schools than their economically more advantaged peers. In this situation, the AEO potentially appears less attractive to the district than would be the case if eligibility based on enrolled students were known.
A similar analysis pertains to individual schools. Differences that may be most important occur near the 75 percent free or reduced-price eligibility level, where it may be viable to offer free meals to all students. For example, the ACS or another residence-based source of eligibility estimates may provide misleading information if it signals that free or reduced-price eligibility is either above or below 75 percent when the reverse is true
according to enrolled students. In Figure G-1, instances of these situations occur in the northwest and southeast quadrants created by the 75 percent dashed lines, whereas schools in the northeast quadrant are likely to consider the AEO under either a catchment area (e.g., ACS) estimate or one employing actual enrollment. Only 2 percent of schools are found in the northwest quadrant, while 29 percent of schools are in the southeast quadrant. Using catchment area estimates of free or reduced-price eligibility, these schools in the southeast quadrant will be less likely to opt for the AEO than if they use enrollment-based percentages. Both methods yield eligibility estimates exceeding the benchmark of 75 percent for the 11 percent of DCPS schools in the northeast quadrant. It is clear from the case of DCPS that the calculations based on catchment areas can, in some cases, substantially underestimate enrollment-based percentages. Of the schools whose enrollment-based percentage exceeds 75 percent free or reduced-price-eligible, 45 percent have catchment area estimates that differ from actual enrollment percentages by more than 10 percentage points.
Because such a large share of public school students residing in the District of Columbia attend independent charter schools, it is likely that the District is among the more extreme examples of how choice influences the accuracy of catchment area estimates. That, however, is an empirical question dependent on the availability of public school choice, which, as is discussed in more detail below, is limited to a relatively few districts, and on the differential use of schools of choice by free or reduced-price-eligible and ineligible students. At the district level, catchment area eligibility percentages will differ from enrollment-based eligibility percentages only when interdistrict public school choice is available and is utilized differentially by eligible and ineligible students. At the school level, any type of public school choice is potentially problematic.
Omaha has an open enrollment plan for all of its 59 elementary, 11 middle, and 7 high schools. Students can choose to attend any grade-appropriate school in the district. If students sort to schools based on free or reduced-price eligibility, we will expect to find that catchment area-based free or reduced-price eligible percentages differ from their enrollment-based counterparts. Using data provided by the Omaha school district on students grouped by catchment area and where they actually attend school, Figure G-2 summarizes how the catchment area and enrollment-based percentages differ for each school in the district. Many schools are near the 45° diagonal, indicating small differences. However, 20 percent of the schools have catchment-based free or reduced-price-eligible percentages that differ from their enrollment-based counterparts by at least 10 percentage points.
Two aspects of this analysis are important. First, all of these school choices are within-district choices and will not affect Omaha’s decision
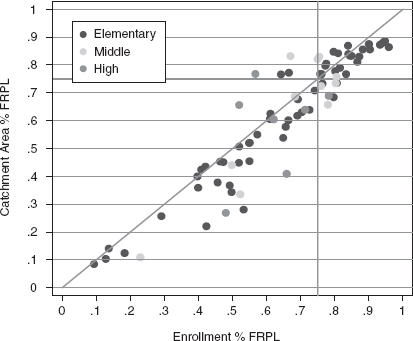
FIGURE G-2 Within-district open enrollment in Omaha public schools, 2008-2009: School catchment-based and enrollment-based free or reduced-price-eligible percentages.
NOTE: FRPL = free or reduced-price lunch.
SOURCE: Prepared by the panel.
to adopt the AEO at the district level because its overall free or reduced-price-eligible percentage does not change as a result of its districtwide open enrollment plan. Second, even at the school level, differences may not matter because many pertain to schools with free or reduced-price-eligible percentages too low for the AEO to be considered. Seven percent of the schools are in the northwest quadrant, indicating that although the catchment area-based free or reduced-price-eligibility percentage exceeds 75, the free or reduced-price-eligibility percentage based on enrolled students is less than 75. The reverse is true for the 9 percent of schools found in the southeast quadrant. Contrast these with the 31 percent of schools in the northeast quadrant that would be correctly classified as exceeding 75 percent under both measures. These results are summarized in the first row of Table G-4. Compared with the misclassification relative to the 75 percent free or reduced-price-eligibility found in the District of Columbia (31 percent in the northwest and southeast quadrants), mis-classification in Omaha is much lower (16 percent).
| Measure | % in Southwest Quadrant | % in Northwest Quadrant | % in Southeast Quadrant | % in NortheastQuadrant |
| First Measure | < 75 | < 75 | ≥ 75 | ≥ 75 |
| Second Measure | < 75 | ≥ 75 | < 75 | ≥ 75 |
| Enrollment vs. Catchment | 53.5 | 6.5 | 9.1 | 31.2 |
| ACS vs. Catchment | 60.0 | 10.7 | 4.0 | 25.3 |
| Enrollment vs. ACS | 54.7 | 6.7 | 16.0 | 22.7 |
NOTE: An “enrollment” measure is an administrative estimate—provided by the district—based on where students are enrolled. A “catchment” measure is an administrativeestimate—provided by the district—based on where students reside in terms of schoolcatchment areas. “ACS” denotes an estimate from the American Community Survey, whichis based on residence.
SOURCE: Prepared by the panel.
In assessing the potential impact of intradistrict school choice on the use of the AEO, it is also useful to consider the ACS 5-year estimates for Omaha schools and how they differ from the catchment- and enrollment-based data provided by the Omaha school district. Assume that Omaha’s administrative estimates accurately reflect the location and free or reduced-price eligibility of students and that deviations from these estimates represent errors by the ACS. The second row of Table G-4 compares the ACS estimates of eligibility percentages for a catchment area with those from the Omaha school district. Presumably, both are attempting to identify the same thing—the catchment area-based free or reduced-price-eligibility percentage. The middle two columns represent instances of misclassification (over vs. under 75 percent). Fifteen percent of the schools will receive different classifications depending on whether the ACS or the administrative catchment area estimates are employed. As noted in the body of the report, the panel finds that ACS estimates are biased downward. In Omaha, we find that an unweighted mean of the ACS estimates of free and reduced-price lunch eligibility is 7.9 percentage points smaller than the corresponding administrative estimate derived from enrollment-based data. This is also indicated in the second row of Table G-4 derived using catchment area-based administrative data, which shows that it is much more likely that the ACS incorrectly classifies a school as below the 75 percent threshold (10.7 percent) than above it (4.0 percent). This highlights the potential measurement problems when ACS estimates are employed at the school level. The final row of Table G-4 shows the dif-
ference between the Omaha estimates of free or reduced-price-eligible percentages for schools based on enrolled students and what would be obtained from the ACS, which includes the measurement errors associated with ACS estimates, as well as errors introduced by the presence of school choice. In this instance, the misclassifications introduced by using catchment area enrollment (first row, 16 percent) are roughly comparable to the total misclassification of catchment area enrollment introduced by the ACS (second row, 15 percent), although the composition of errors differs. Taken together, issues of measurement error and school choice (third row) lead to a misclassification of 23 percent of schools when ACS estimates are employed.
Figure G-3 compares the school-level percentages of free or reduced-price-eligible students enrolled in Omaha schools with the ACS 5-year (2005-2009) estimates (third row of Table G-4). As expected, there is much greater variation around the 45° diagonal than was found in Figure G-2, owing to both the sampling error associated with the ACS estimates and the fact that 5-year estimates are used to approximate the 2008-2009 per-
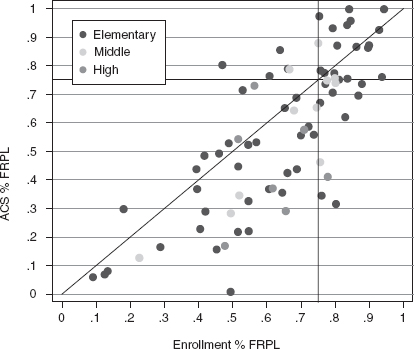
FIGURE G-3 Five-year (2005-2009) ACS-estimated and 2008-2009 actual enrollment by free or reduced-price-eligibility percentages, Omaha public schools.
NOTE: FRPL = free or reduced-price lunch.
SOURCE: Prepared by the panel.
centages. As a result, ACS estimates are more likely to misclassify schools as over or under 75 percent free or reduced-price eligibility, as shown in the third row of Table G-4.
The analysis of the effect of school choice in the District of Columbia Public Schools and the Omaha School District demonstrates that in some instances, school choice may introduce error into free or reduced-price-eligibility estimates from the ACS. Although two observations provide little room for generalization, the analysis suggests that intradistrict choice such as that found in Omaha may be much less problematic than the interdistrict choice found in a district where a very high percentage of students attend charter schools. The panel found that misclassifications near the free or reduced-price-eligibility percentage of 75 percent that may trigger consideration of the AEO were much greater in the District of Columbia (31 percent) than in Omaha (16 percent). We next explore the prevalence of various types of school choice.
Prevalence of School Choice
It is difficult to find summaries of public school choice that are detailed with respect to both forms of school choice and geography. In 2007-2008, it is estimated that nationwide, magnet schools enrolled 4.3 percent of regular public school students, while there were 4,388 charter schools enrolling about 2.7 percent of regular public school students.18 Twenty states have mandatory intradistrict open enrollment policies that allow students to transfer to other schools within the public school district; 14 states have mandatory interdistrict open enrollment policies.19 Many of the mandatory intradistrict policies allow students to leave low-performing schools as a remedy for the schools having failed to meet the No Child Left Behind Act of 2004 Adequate Yearly Performance targets.
Employing a database developed by the panel from the Common Core of Data for recent years, Table G-5 provides a summary of the prevalence of various types of schools of choice for the most recently available years.20 As previously mentioned, charter schools can be created as schools within an existing local education agency (LEA) that also has traditional public schools, or they can receive a charter as an independent LEA that includes only one or more charter schools. We refer to the former as dis
____________
18 Schools: http://nces.ed.gov/programs/digest/d09/tables/dt09_097.asp; enrollments: http://nces.ed.gov/pubs2010/2010305/tables/table_03.asp.
19 These data were taken from the National Center for Education Statistics (NCES) website on school choice policies (Table 4.2) on May 22, 2011.
20 These data differ modestly from the publicly available data in the Common Core of Data as the panel included only districts that were in the Census Bureau’s geographic database, and thus those for which the Bureau could derive ACS estimates.
TABLE G-5 Share of Public School Enrollment by Choice Status
| School Year | Regular | District Charter | Independent LEA Charter | Magnet |
| 2004-2005 | 0.933 | 0.017 | 0.024 | 0.026 |
| 2005-2006 | 0.927 | 0.018 | 0.025 | 0.030 |
| 2006-2007 | 0.928 | 0.020 | 0.026 | 0.026 |
| 2007-2008 | 0.923 | 0.021 | 0.027 | 0.030 |
| 2008-2009 | 0.915 | 0.022 | 0.030 | 0.033 |
NOTES: LEA = local education agency. Regular schools may include open enrollment schools. District charters are charters under the administration of the local LEA. Independent charters are separate LEAs, not part of the local LEA.
SOURCE: Prepared by the panel.
trict charters and the latter as independent LEA charters. As noted above, independent charters are potentially more problematic for use of the AEO as they represent a form of interdistrict choice and thus can affect both district-level and school-level decisions to opt for the AEO. The panel was unable to find national data documenting the prevalence of open enrollment schools and thus cannot comment on its potential impact.
Although potentially problematic when it occurs, school choice currently raises limited concerns, on average, regarding the use of the ACS for estimating eligibility for free and reduced-price school meals. In 2008-2009, fewer than 15 percent of counties in the United States contained either a charter or magnet school (panel database). However, because charter and magnet schools are much more prevalent in urban areas, they accounted for about 9 percent of all enrollment. Thus, although charters and magnets are not common in most areas, they can enroll a large number of students in some places. For example, charter or magnet school enrollment accounted for more than 10 percent of public school enrollment in 92 counties in 2008-2009 (panel database). Charter schools that are independent LEAs accounted for more than 20 percent of enrollment in just 9 counties in 2008-2009, including Washington, DC (35 percent), St. Louis (25 percent), and New Orleans (55 percent) (panel database). Thus for a very limited set of districts, the ACS may provide misleading estimates of eligibility for free or reduced-price meals.
Summary
The above analysis suggests the following:
• School choice is not sufficiently pervasive to cause concern for use of the ACS to estimate free or reduced-price eligibility for the AEO in most schools and school districts.
• In an important subset of schools and districts, however, atten-dance at noncatchment area schools occurs frequently enough that these districts should carefully consider the likely difference between the ACS free or reduced-price-eligibility estimates and estimates based on actual enrollment.
— At the district level, this occurs when a substantial portion of students have exercised the ability to choose schools that are not part of the LEA, such as charter schools in independent LEAs.
— At the school level, this occurs when a relatively large percentage of students have chosen to attend noncatchment area schools.
IMPUTATION FOR ITEM NONRESPONSE
Using the 2008 ACS Public Use Microdata Sample (PUMS) file, the panel developed the following tabulations of income eligibility; reporting of SNAP benefits and public assistance income; and imputation flags for (1) any income item, (2) SNAP, and (3) public assistance income. Tabulations included income eligibility for the school meals programs for all related and unrelated students and excluded foster children. Income eligibility used household income and household size. There were seven tabulations:
- income eligibility for all students;
- income eligibility for all students in households where some income item was imputed;
- income eligibility for all students in households that were receiving SNAP benefits;
- income eligibility for all students in households that were receiving SNAP benefits and for which SNAP was imputed;
- income eligibility for all students in households that were receiving SNAP benefits and for which income was imputed;
- income eligibility for all students in households where some resident reported public assistance income; and
- income eligibility for all students in households where some resident reported public assistance income, and welfare income was imputed for some resident.
Table G-6 shows results for the United States. In the United States, 28.8 percent of households with students had some income imputed, .2 percent had SNAP benefits imputed, and 1.0 percent had public assistance income imputed. Of the households receiving SNAP benefits,
TABLE G-6 Eligibility Distribution for Households with Students, Selected Characteristics
|
Eligibility |
||||
|
Household Characteristic |
Percentage Free |
Percentage |
Percentage Full Price |
Percentage of All Students |
|
With Students |
22.51 |
11.70 |
65.79 |
|
|
With Students, Some Income Imputed |
22.80 |
13.28 |
63.92 |
28.80 |
|
With Students and SNAP |
68.81 |
13.72 |
17.48 |
17.39 |
|
With Students, SNAP, and SNAP Imputed |
65.00 |
10.67 |
24.33 |
0.20 |
|
With Students, SNAP, and Some Income Imputed |
54.77 |
17.34 |
27.89 |
5.87 |
|
With Students and Public Assistance |
65.24 |
13.05 |
21.71 |
4.92 |
|
With Students, Public Assistance, and Public Assistance Imputed |
54.44 |
15.55 |
30.01 |
0.99 |
SOURCE: Prepared by the panel using 2008 ACS Public Use Microdata Sample (PUMS) data.
almost 6 percent had SNAP benefits imputed, and of the households that had someone receiving public assistance income, 20 percent had someone with public assistance income imputed.
Note that in the households receiving SNAP benefits or public assistance income, most students (68.8 percent and 65.2 percent, respectively) were already income-eligible for school meals. Previous tabulations show that accounting for SNAP (but not public assistance) increases the percentage eligible for free meals by 5.4 percent, accounting for public assistance (but not SNAP) increases the percentage eligible for free meals by 1.7 percent, and accounting for both increases the percentage eligible for free meals by 6.1 percent. Comparing rows in Table G-6 shows the impact of imputation on the eligibility percentages for the school meals programs. For example, the eligibility percentages in the third and fourth rows show the impact of imputation of SNAP benefits. Imputation of SNAP benefits (fourth row) tends to increase the percentage eligible for full-price meals while decreasing the percentages eligible for free and for reduced-price meals. However, this will have a minor impact on the eligibility distribution for all students because SNAP is imputed for only .2 percent of them. Comparing the eligibility percentages in the sixth and seventh rows shows the impact of imputation of public assistance income
among households that report receiving such income. The imputation of public assistance income tends to overstate eligibility for reduced- and full-price meals and understate eligibility for free meals. Since only 1 percent of all students live in households where public assistance income is imputed, however, this will have little impact on the overall eligibility distribution. Finally, a comparison of the third and fifth rows shows that for SNAP households with students, income imputation (for any source of income) tends to overstate the full-price- and reduced-price-eligibility percentages and understate the free eligibility percentage. Since roughly one-third of households that report receiving SNAP benefits have some income imputed, this could be a more significant issue. However, because the panel has chosen to use the ACS variables on SNAP benefits and public assistance income to determine categorical eligibility, the children mis classified by income imputation will be correctly assigned as eligible for free meals because of SNAP participation.
As described in Chapter 2, the Access, Participation, Eligibility, and Certification Study (APEC) (U.S. Department of Agriculture/Food and Nutrition Service, 2007b) provided national estimates for the percentage of students who were misclassified by eligibility category in 2005-2006. These certification errors are reproduced in Table G-7. The first three values, for example, indicate that among students certified for free meals, 86.0 percent were actually eligible for free meals, 8.1 percent were actu-
TABLE G-7 Certification Category and Correct Eligibility Category in School Year 2005-2006
| Certification Category | Correct Eligibility Category | As a Percentage of Certification Category |
| Free | Free | 86.0 |
| Free | Reduced price | 8.1 |
| Free | Full price | 5.9 |
| Reduced Price | Free | 34.0 |
| Reduced Price | Reduced price | 40.9 |
| Reduced Price | Full price | 25.1 |
| Full Price | Free | 19.0 |
| Full Price | Reduced price | 16.6 |
| Full Price | Full price | 64.4 |
SOURCE: U.S. Department of Agriculture/Food and Nutrition Service (2007b) also called the APEC study.
ally eligible for reduced-price meals, and 5.9 percent were eligible only for full-price meals. The APEC certification errors apply to all certified students (including those directly certified) and denied applicants; they do not apply to students whose families did not apply for benefits. While it is likely that most of these students were not eligible for free or reduced-price meals, some may have been, and there is no current information about the percentage of eligible students who do not apply. Accordingly, the panel considered a range of assumptions to help illuminate the potential impact of these errors on differences between ACS eligibility estimates and administrative data on certification.
The panel used the APEC certification errors (reproduced in Table G-7) to evaluate the potential impact of certification errors on eligibility estimates for a variety of assumptions. These are illustrated in Tables G-8 through G-12. Each table shows the impact of certification errors for 13 free, reduced-price, and full-price certification distributions. In forming these distributions, the percentage certified as eligible for free meals was varied from 45 percent to 90 percent in increments of 5 percent, and the percentage certified for reduced-price meals assumed values of 5 percent, 10 percent, or 15 percent. As a result, the percentage full-price eligible ranged from 40 percent to 5 percent. In addition, three assumptions are displayed for the percentage of enrolled students who applied for benefits and were denied: 10 percent (Tables G-8 and G-11), 25 percent (Tables G-9 and G-12), and 40 percent (Table G-10). Finally, two different assumptions were made concerning the eligibility status of students who did not apply: either they were all assumed to be eligible only for full-price meals ( G-8 through G-10), or 9.5, 8.3, and 82.2 percent were assumed to be eligible for free, reduced-price, and full-price meals, respectively (Tables G-11 and G-12).
Results were evaluated on both the eligibility percentages and the blended reimbursement rate (BRR) implied by the eligibility percentages. Table G-8 shows that if the percentage of enrolled students who applied for benefits and were denied is 10 percent, and all who did not apply were eligible only for full-price meals, then certification errors result in an overstatement of the BRR by 6-7 percent across all 13 certification distributions. For the highest-percentage free- and reduced-price-eligible districts shown in the table, the overstatement of the BRR remains at 6-7 percent as the percentage of enrolled students who applied and were denied increases to 25 percent (see Table G-9) or 40 percent (see Table G-10). Under these assumptions, however, for districts with low percentages free and reduced-price eligible, the overstatement of the BRR is reduced to 3 percent under the 25 percent assumption (see Table G-9) and to 0 percent under the 40 percent assumption (see Table G-10).
As shown in Tables G-11 and G-12, the assumption that some of the
| (1) | (2) | (3) | (4) | (5) | (6) | (7) | (8) | (9) | (10) | (11) | (12) | (13) | |
| Alternative Distributions of Certified Students (%) | |||||||||||||
| Free | 45 | 50 | 55 | 60 | 60 | 65 | 70 | 70 | 75 | 80 | 80 | 85 | 90 |
| Reduced Price | 15 | 10 | 15 | 10 | 15 | 10 | 5 | 15 | 10 | 5 | 15 | 10 | 5 |
| Full Price | 40 | 40 | 30 | 30 | 25 | 25 | 25 | 15 | 15 | 15 | 5 | 5 | 5 |
| Distributions of Eligible Students, Corrected for Certification Error (%) | |||||||||||||
| Free | 45 | 47 | 53 | 56 | 57 | 60 | 62 | 66 | 68 | 71 | 74 | 77 | 79 |
| Reduced Price | 10 | 9 | 11 | 9 | 11 | 10 | 8 | 12 | 10 | 9 | 13 | 11 | 9 |
| Full Price | 45 | 44 | 36 | 35 | 31 | 30 | 29 | 22 | 21 | 20 | 13 | 12 | 11 |
| BRRs | |||||||||||||
| BRR, Certified Students ($) | 1.60 | 1.62 | 1.83 | 1.85 | 1.95 | 1.97 | 1.99 | 2.18 | 2.20 | 2.22 | 2.41 | 2.43 | 2.45 |
| BRR, Eligible Students ($) | 1.50 | 1.53 | 1.71 | 1.74 | 1.81 | 1.84 | 1.87 | 2.02 | 2.05 | 2.08 | 2.23 | 2.26 | 2.29 |
| Difference (E - C) ($) | -0.10 | -0.09 | -0.12 | -0.11 | -0.14 | -0.13 | -0.12 | -0.16 | -0.15 | -0.14 | -0.18 | -0.18 | -0.17 |
| Percentage Difference |
-6 | -6 | -7 | -6 | -7 | -6 | -6 | -7 | -7 | -6 | -8 | -7 | -7 |
NOTE: BRR = blended reimbursement rate.
SOURCE: Prepared by the panel.
| (1) | (2) | (3) | (4) | (5) | (6) | (7) | (8) | (9) | (10) | (11) | (12) | (13) | |
| Altrnative Distributions of Certified Students (%) | |||||||||||||
| Free | 45 | 50 | 55 | 60 | 60 | 65 | 70 | 70 | 75 | 80 | 80 | 85 | 90 |
| Reduced Price | 15 | 10 | 15 | 10 | 15 | 10 | 5 | 15 | 10 | 5 | 15 | 10 | 5 |
| Full Price | 40 | 40 | 30 | 30 | 25 | 25 | 25 | 15 | 15 | 15 | 5 | 5 | 5 |
| Distributions of Eligible Students, Corrected for Certification Error (%) | |||||||||||||
| Free | 46 | 48 | 54 | 56 | 58 | 60 | 63 | 66 | 69 | 71 | 74 | 77 | 79 |
| Reduced Price | 11 | 10 | 12 | 10 | 12 | 10 | 9 | 12 | 11 | 9 | 13 | 11 | 10 |
| Full Price | 43 | 42 | 34 | 33 | 30 | 29 | 28 | 22 | 21 | 20 | 13 | 12 | 11 |
| BRRs | |||||||||||||
| BRR, Certified Students ($) | 1.60 | 1.62 | 1.83 | 1.85 | 1.95 | 1.97 | 1.99 | 2.18 | 2.20 | 2.22 | 2.41 | 2.43 | 2.45 |
| BRR, Eligible Students ($) | 1.55 | 1.57 | 1.74 | 1.77 | 1.84 | 1.87 | 1.90 | 2.04 | 2.07 | 2.10 | 2.23 | 2.26 | 2.29 |
| Difference (E - C) ($) | -0.05 | -0.04 | -0.09 | -0.08 | -0.11 | -0.10 | -0.09 | -0.14 | -0.13 | -0.12 | -0.18 | -0.17 | -0.16 |
| Percentage Difference |
-3 | -3 | -5 | -4 | -5 | -5 | -4 | -7 | -6 | -6 | -7 | -7 | -7 |
NOTE: BRR = blended reimbursement rate.
SOURCE: Prepared by the panel.
| (1) | (2) | (3) | (4) | (5) | (6) | (7) | (8) | (9) | (10) | (11) | (12) | (13) | |
| Alternative Distributions of Certified Students (%) | |||||||||||||
| Free | 45 | 50 | 55 | 60 | 60 | 65 | 70 | 70 | 75 | 80 | 80 | 85 | 90 |
| Reduced Price | 15 | 10 | 15 | 10 | 15 | 10 | 5 | 15 | 10 | 5 | 15 | 10 | 5 |
| Full Price | 40 | 40 | 30 | 30 | 25 | 25 | 25 | 15 | 15 | 15 | 5 | 5 | 5 |
| Distributions of Eligible Students, Corrected for Certification Error (%) | |||||||||||||
| Free | 47 | 49 | 55 | 57 | 59 | 61 | 64 | 66 | 69 | 72 | 74 | 77 | 79 |
| Reduced Price | 12 | 11 | 13 | 11 | 13 | 11 | 9 | 13 | 11 | 10 | 13 | 11 | 10 |
| Full Price | 41 | 40 | 33 | 32 | 29 | 28 | 27 | 21 | 20 | 19 | 13 | 12 | 11 |
| BRRs | |||||||||||||
| BRR, Certified Students ($) | 1.60 | 1.62 | 1.83 | 1.85 | 1.95 | 1.97 | 1.99 | 2.18 | 2.20 | 2.22 | 2.41 | 2.43 | 2.45 |
| BRR, Eligible Students ($) | 1.59 | 1.62 | 1.78 | 1.81 | 1.87 | 1.90 | 1.93 | 2.06 | 2.08 | 2.11 | 2.24 | 2.27 | 2.30 |
| Difference (E - C) ($) | -0.01 | 0.00 | -0.05 | -0.05 | -0.08 | -0.07 | -0.06 | -0.13 | -0.12 | -0.11 | -0.17 | -0.16 | -0.16 |
| Percentage Difference |
0 | 0 | -3 | -2 | -4 | -4 | -3 | -6 | -5 | -5 | -7 | -7 | -6 |
NOTE: BRR = blended reimbursement rate.
SOURCE: Prepared by the panel.
| (1) | (2) | (3) | (4) | (5) | (6) | (7) | (8) | (9) | (10) | (11) | (12) | (13) | |
| Alternative Distributions of Certified Students (%) | |||||||||||||
| Free | 45 | 50 | 55 | 60 | 60 | 65 | 70 | 70 | 75 | 80 | 80 | 85 | 90 |
| Reduced Price | 15 | 10 | 15 | 10 | 15 | 10 | 5 | 15 | 10 | 5 | 15 | 10 | 5 |
| Full Price | 40 | 40 | 30 | 30 | 25 | 25 | 25 | 15 | 15 | 15 | 5 | 5 | 5 |
| Distributions of Eligible Students, Carrected for Certification Error(%) | |||||||||||||
| Free | 48 | 51 | 56 | 58 | 59 | 62 | 65 | 67 | 69 | 72 | 74 | 77 | 80 |
| Reduced Price | 13 | 12 | 13 | 12 | 13 | 12 | 10 | 13 | 12 | 10 | 13 | 11 | 10 |
| Full Price | 39 | 38 | 31 | 30 | 27 | 26 | 25 | 20 | 19 | 18 | 13 | 12 | 11 |
| BRRs | |||||||||||||
| BRR, Certified Students ($) | 1.60 | 1.62 | 1.83 | 1.85 | 1.95 | 1.97 | 1.99 | 2.18 | 2.20 | 2.22 | 2.41 | 2.43 | 2.45 |
| BRR, Eligible Students ($) | 1.64 | 1.67 | 1.81 | 1.84 | 1.90 | 1.93 | 1.96 | 2.07 | 2.10 | 2.13 | 2.25 | 2.28 | 2.30 |
| Difference (E - C) ($) | 0.04 | 0.05 | -0.02 | -0.01 | -0.05 | -0.04 | -0.03 | -0.11 | -0.10 | -0.09 | -0.17 | -0.16 | -0.15 |
| Percentage Difference |
2 | 3 | -1 | -1 | -3 | -2 | -2 | -5 | -5 | -4 | -7 | -7 | -6 |
NOTE: BRR = blended reimbursement rate.
SOURCE: Prepared by the panel.
| (1) | (2) | (3) | (4) | (5) | (6) | (7) | (8) | (9) | (10) | (11) | (12) | (13) | |
| Alternative Distributions of Certified Students (%) | |||||||||||||
| Free | 45 | 50 | 55 | 60 | 60 | 65 | 70 | 70 | 75 | 80 | 80 | 85 | 90 |
| Reduced Price | 15 | 10 | 15 | 10 | 15 | 10 | 5 | 15 | 10 | 5 | 15 | 10 | 5 |
| Full Price | 40 | 40 | 30 | 30 | 25 | 25 | 25 | 15 | 15 | 15 | 5 | 5 | 5 |
| Distributions of Eligible Students, Corrected for Certification Error (%) | |||||||||||||
| Free | 49 | 51 | 56 | 59 | 60 | 62 | 65 | 67 | 70 | 72 | 74 | 77 | 80 |
| Reduced Price | 14 | 12 | 14 | 12 | 14 | 12 | 10 | 13 | 12 | 10 | 13 | 11 | 10 |
| Full Price | 38 | 37 | 30 | 29 | 27 | 26 | 25 | 20 | 19 | 18 | 12 | 11 | 10 |
| BRRs | |||||||||||||
| BRR, Certified Students ($) | 1.60 | 1.62 | 1.83 | 1.85 | 1.95 | 1.97 | 1.99 | 2.18 | 2.20 | 2.22 | 2.41 | 2.43 | 2.45 |
| BRR, Eligible Students ($) | 1.66 | 1.69 | 1.83 | 1.86 | 1.91 | 1.94 | 1.97 | 2.08 | 2.11 | 2.14 | 2.25 | 2.28 | 2.31 |
| Difference (E - C) ($) | 0.06 | 0.07 | 0.00 | 0.01 | -0.03 | -0.03 | -0.02 | -0.10 | -0.09 | -0.08 | -0.16 | -0.16 | -0.15 |
| Percentage Difference |
4 | 4 | 0 | 0 | -2 | -1 | -1 | -5 | -4 | -4 | -7 | -6 | -6 |
NOTE: BRR = blended reimbursement rate.
SOURCE: Prepared by the panel.
students who did not apply were eligible for free or reduced-price meals does not change the overstatement of the BRR for districts with very high free and reduced-price eligibility percentages. For districts with lower levels of eligibility, however, the impact is more dramatic, even contributing to an understatement of the BRR.


